Data Integrity Matters: Limiting Access to Tools That Could Be Used to Manipulate Data (Part 4)

Suppressing Peak Integration
Being able to optimize peak integration and identification, whether by resetting the method RT settings, manually identifying peaks or suppressing integration of specific known peaks are certainly tools which, in the wrong hands, with the wrong intent and without a robust training and review process, may be used by unscrupulous staff to fraudulently manipulate a failing result into a passing specification.
Earlier we introduced these four scenarios of concern
- System Readiness /Trial /Equilibration injections
- Multiple attempts to optimize the integration parameters to achieve accurate integration
- The use of manual integration to achieve accurate integration
- Suppression of peak integration to eliminate certain peaks from being included in analyses
This blog we will look at scenario four and the legitimate need to exclude peaks from calculations, how inhibiting integration or other integration tools have traditionally been used for this and why the regulators have concerns that peak integration suppression is being used in uncontrolled ways to obscure undesirable peaks.
Useful tools can be used to achieve accurate and consistent results, but also, in the wrong hands or if someone has the intent, they might be used to falsify data. How can you tell the difference?
As previously discussed, experimentally derived chromatograms, from detectors monitoring specific compounds dissolved in a moving mobile phase, passing over a chemically treated stationary phase, sadly do not perfectly behave to any chemical or physical theory. As well as imperfect non Gaussian peak shape, environmental and mobile phase flow considerations will certainly impact the ideally smooth baseline. For instance, it is well known that the introduction of the sample, known as the injection, will, in almost all cases, cause a distinct baseline perturbation which is used by scientists to indicate the void volume of the column (or Vo). Additionally, especially in gradient chromatography, the gradual chemical change of the effective mobile phase by introducing a second mobile phase, commonly creates a slope to the baseline, which then will return to the initial starting point as the analysis returns to initial conditions. These gradient conditions may also be used to “wash” the column and removed strongly retained compounds which are not actually part of the sample under test. These non-sample compounds might come from the mobile phase, the injection diluent or from part of the sample preparation process.
You may be able to guess that the baseline perturbations described above are commonly found in the first or last portions of a chromatogram. These kinds of baseline disturbances or peaks will also be seen in blank injections, which are critical to run as part of method validation but often also during sample analyses. Because the baseline integration parameters may see these as true sample chromatographic peaks, it is a very common practice to instruct the chromatographic software to delay the beginning of peak integration or to end it early, to avoid integrating what are known as “system peaks” as they are non- representative of the sample composition. In many cases, where a column wash step creates extreme baseline noise, data acquisition may be halted once all the true components have eluted.
Other kinds of “non-sample” peaks may also occur in areas other than the beginning and end of a chromatogram. Peaks that are caused by additives in the injection diluent, for example, might elute between genuine sample peaks. Of course, these would also be visible in blank injections.
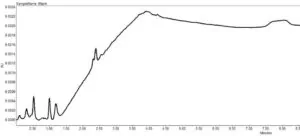
Figure 1 shows a blank injection (auto scaled to fill the screen) which shows all the system effects in the chromatogram
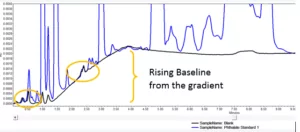
Figure 2 shows how a standard injection (blue) overlaid with the blank (black), has true peaks from the standard but also includes the system peaks and the baseline perturbation from the gradient which are visible in the blank
Clearly these non-sample peaks should be not be included in any sample analysis results. But their exclusion must be clearly explained in the method and justified scientifically. Correct exclusion of the system or diluent peaks should be a part of the second person review, as a quality check to be sure that genuine sample peaks (or new sample impurities) have not been missed.
How are these system effects excluded from chromatographic evaluation? The normal approach is to prevent these peaks from being integrated. This is required, especially when any of the sample evaluation uses values such as Area% or Amount% where these extra peaks will disturb the final result if they were included in the totals. It is also common practice to exclude very small peaks from these kinds of calculations such as any that, on first integration are less than 0.5% of the total area.

But there are other integration events which can be used to suppress peak detection. These include, but are not limited to, setting timed minimum Area or minimum Heights or simply setting a high threshold or peak width value at specific spots in the chromatogram. Each of these events may be needed legitimately for proper peak integration or to suppress baseline fluctuation known as noise, however could equally be used to exclude any chosen peak.
For this reason, there have been regulatory observations suggesting that peak integration events, particularly ones that suppress peak integration, might be used fraudulently to manipulate chromatographic data. In 2017, a Warning Letter was issued with an observation that software was “configured to permit extensive use of the “inhibit integration” function without scientific justification.” The letter went on to describe how in some impurity testing the “software was set to inhibit peak integration at four different time periods.” Of course, it is not possible to know if the use here was justified or not, but in older UV based methods, this may have been simply used to eliminate system or diluent peaks, such as those that appear in my Phthalate blank injection above at around 2.4 minutes.
While this Warning Letter called out Inhibit Integration events specifically, simply banning or restricting access to this single event does not solve the underlying issue, as other legitimate integration parameters might equally be used to hide peaks from evaluation.
There are other solutions available to deal with system peaks which show up in blanks. If the chromatography, with its particular peculiarities, has stable retention times and peak responses, baseline subtraction could be used to remove system peaks. In my example this might be suitable to eliminate the peaks at 2.4 minutes, but less useful to eliminate the peaks before 1 minute which do not overlay directly. In many instances, complications such as system peaks are addressed by bypassing the CDS calculations and performing all calibration and quantitation using external applications like LIMS or even Excel Spreadsheets. Here, cherry picking which peaks to include in calculations and which to ignore is very easily done with little traceability.
In an LC-GC webcast, Neil Lander and I showed how new features in Empower can designate blank, diluent or system peaks. Analysts can then allow them to be integrated and reported but set up specific calculations in the Impurity Analysis functionality to include or exclude these designated peaks. This would be configured and tested during Method Validation to show that the Empower methods are used appropriately. You might also view this Tip from the Empower Tip of the Week Blog on this topic of Impurity Analysis. (Tip #41)
In the next blog post, I will talk about how this specific analyst intervention in setting processing parameters might be a factor in the recent concerns about nitrosamine impurities (NDMA, NDEA) in heart drugs known officially as ARB’s and unofficially as ‘sartans, as well as common antacid over-the-counter drugs containing ranitidine.
Popular Topics
ACQUITY QDa (17) bioanalysis (11) biologics (14) biopharma (26) biopharmaceutical (36) biotherapeutics (17) case study (17) chromatography (14) data integrity (22) food analysis (12) HPLC (15) LC-MS (22) liquid chromatography (LC) (20) mass detection (16) mass spectrometry (MS) (54) method development (13) STEM (12) sustainability (12)


