Cyclosporin (CsA) is a drug commonly used as an immunosuppressant that functions as a signal transduction kinase inhibitor; however, CsA has been shown to induce kidney injuries in humans1. The objective of this study was to examine the distribution of CsA within renal tissues at varying known doses to induce a certain degree of toxicity.
The traditional approach for MALDI imaging of small molecules, e.g. drug compounds in tissue, utilizes a targeted MS/MS approach followed by mass analysis. This selective strategy provides confirmation of the identity of the drug and enables the molecules to be differentiated from endogenous signals of the same molecular weight. However, some small molecules do not produce satisfactory fragmentation and must therefore be monitored by their intact mass in the MS mode.
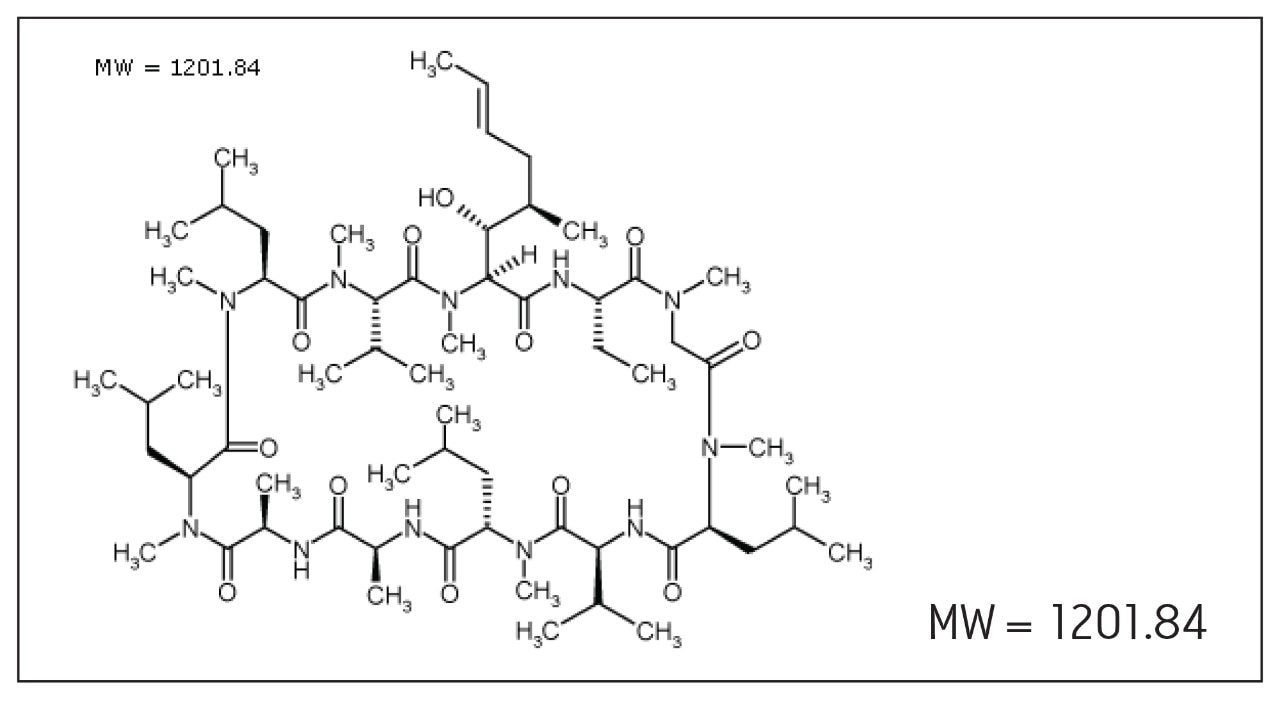
Cyclosporin (Figure 1), does not produce intense fragment ions in MS/MS mode and conventional MALDI-TOF MS alone was unable to provide the selectivity required for the analysis.
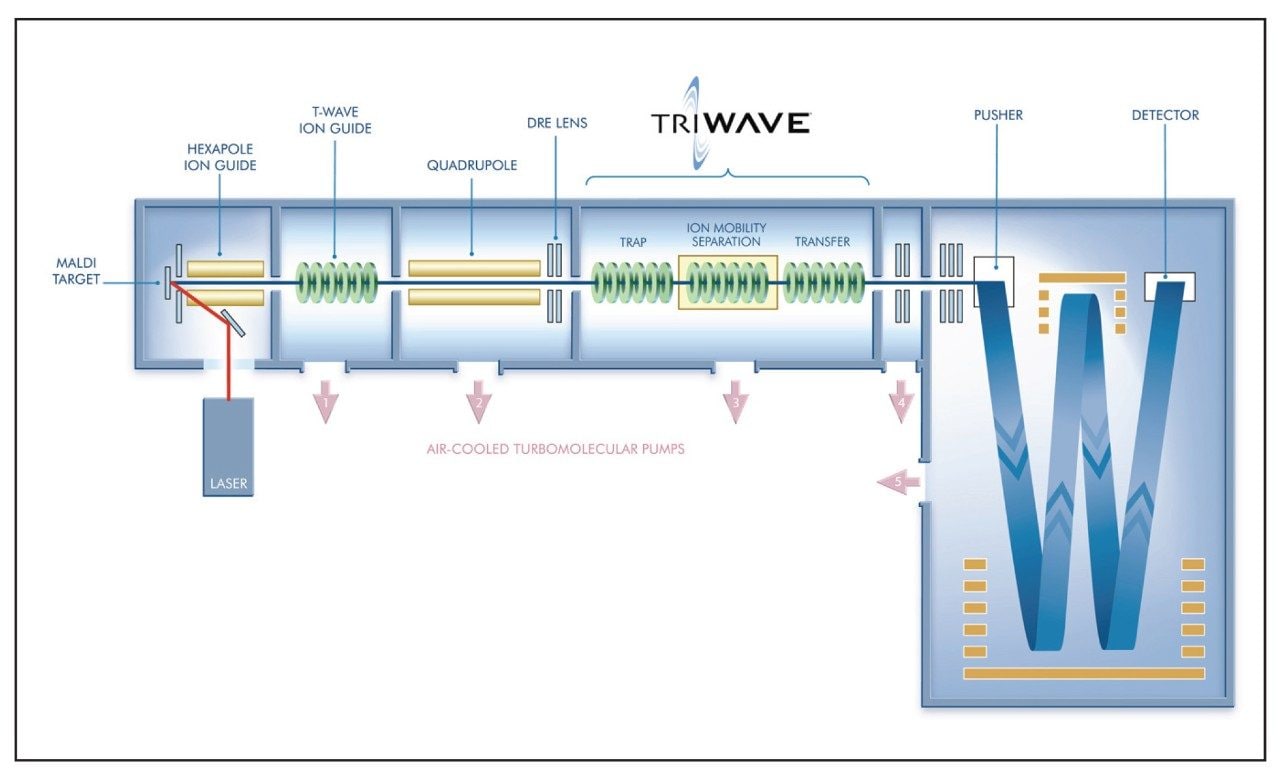
In this application note, High Definition Mass Spectrometry (HDMS) was used as an alternative approach for imaging CsA distribution. HDMS is based on travelling wave (T-Wave) technology2 incorporated into the mass spectrometer. Triwave consists of three T-Wave devices, as shown in Figure 2. The first T-Wave (Trap) is used to trap ions during the period when an ion mobility separation (IMS) is being performed in the second T-Wave, thus greatly enhancing the efficiency of the IMS process. The final T-Wave (Transfer) transports the separated ions to the TOF analyzer.