This application note has demonstrates the versatility of direct injection using the ACQUITY UPLC I-Class System combined with the Xevo TQ-S Mass Spectrometer for the analysis of phenoxyacetic herbicides in natural spring water.
Phenoxyacetic acids are classified as herbicides. They were first introduced in the 1940’s and were in widespread use in agriculture by the middle of the 1950’s. Phenoxyacetic acids are widely used in forestry applications, and to some extent in home gardening, and they account for approximately 70% of the weed killers used in agriculture.1 Consequently, these herbicides are of interest for environmental monitoring in surface and ground waters and are also monitored in drinking water supplies.
When using chemicals for crop protection, toxicity is a crucial factor and these chemicals will often be subject to health evaluations and risk assessments. For example, 2,4-D is used for a variety of crop protection (fruit and vegetable), as well as for turf and lawn care. This herbicide is registered in the United States because it has a favorable environmental profile, and exposures are expected to be minimal in both terrestrial and aquatic environments. 2,4-D is also rapidly broken down by microbial action in soil and it does not persist, accumulate, or leach into groundwater under proper use.2 In 2005, the U.S. EPA approved the continued use of 2,4-D,3 with a maximum contaminant level goal (MCLG) of 70 ug/L. The European Union has also evaluated 2,4-D and included it on the list of approved pesticides, since residue levels do not produce any measurable harmful health issues in humans or animals.4
Not all phenoxyacetic acid herbicides exhibit low toxicity levels. For example, the toxicity of 2,4,5-T came to light during the Vietnam War. Because phenoxyacetic acids exhibit a rapid activity against broad-leaf plants, they were extensively used as a fast-acting defoliant under the code name “Agent Orange”.5 The formulation was equal parts of 2,4,5-T and 2,4-D. Its toxicity was linked to the contamination of 2,4,5-T with an extremely toxic dioxin.6 In 1985, the U.S. EPA banned all remaining uses of 2,4,5-T within the United States.
For those phenoxyacetic acids currently registered for commercial use, the EU council directive7 states that water intended for human consumption should not contain more than 100 ng/L for individual pesticides, and must not exceed 500 ng/L for the sum of all pesticides. In the U.S., they are monitored with EPA methods 515.4 (GC/ECD) with minimum detection limits (MDL’s) at 50 ng/L, and method 555 (LC/UV) with MDL’s at 100 ng/L.
This application note presents a novel analytical approach for the analysis of phenoxyacetic herbicides in drinking water by direct injection using Waters highly sensitive Xevo TQ-S tandem quadrupole Mass Spectrometer with the ACQUITY UPLC System. The option of direct injection on the ACQUITY UPLC I-Class System permitted trace level analysis as low as 2.5 ng/L; without the traditional requirement of high volume enrichment during sample preparation. This resulted in faster analysis times and the ability to rapidly report results.
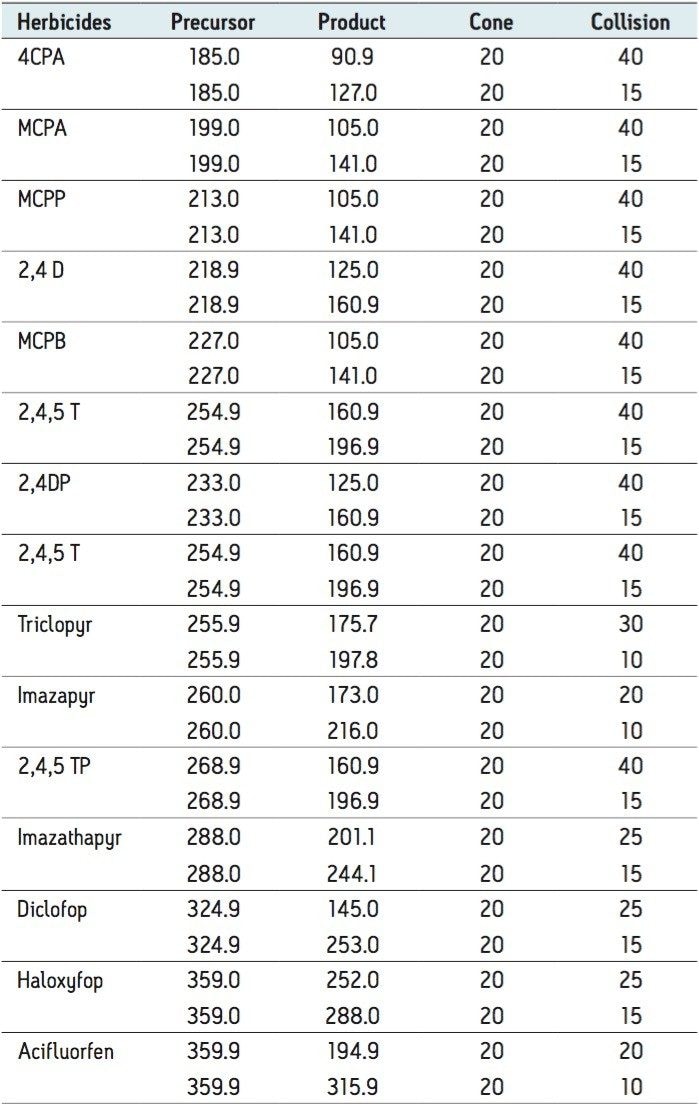
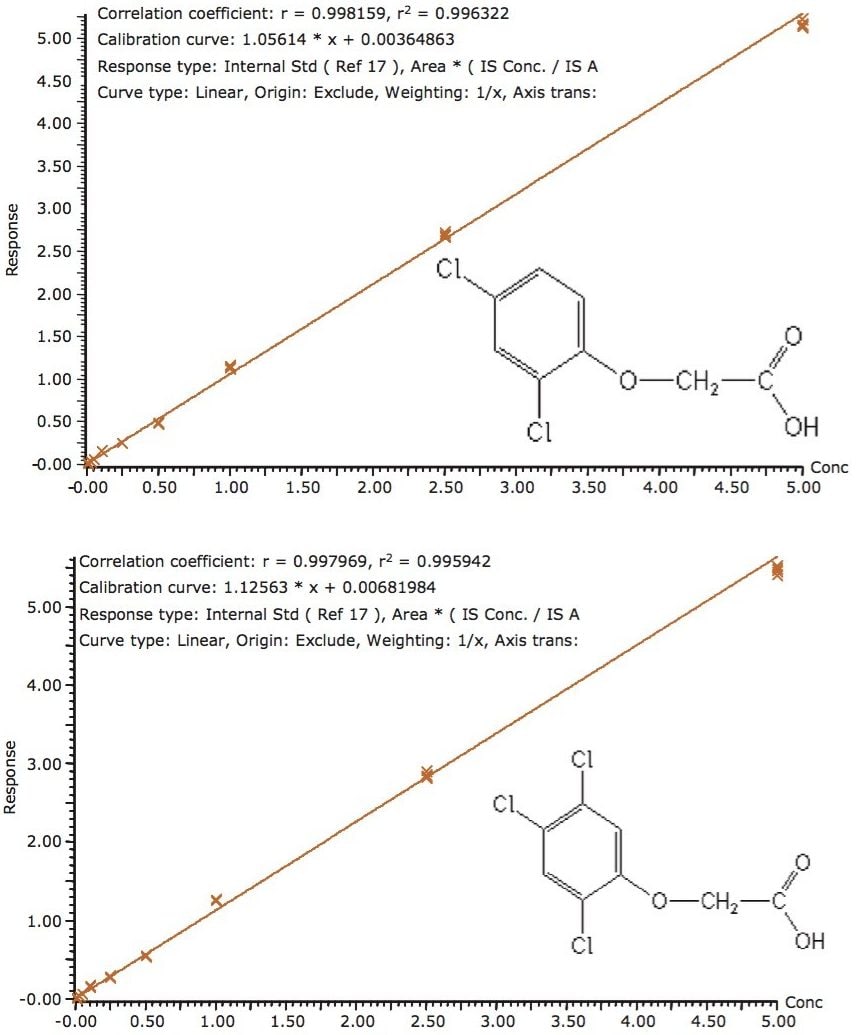
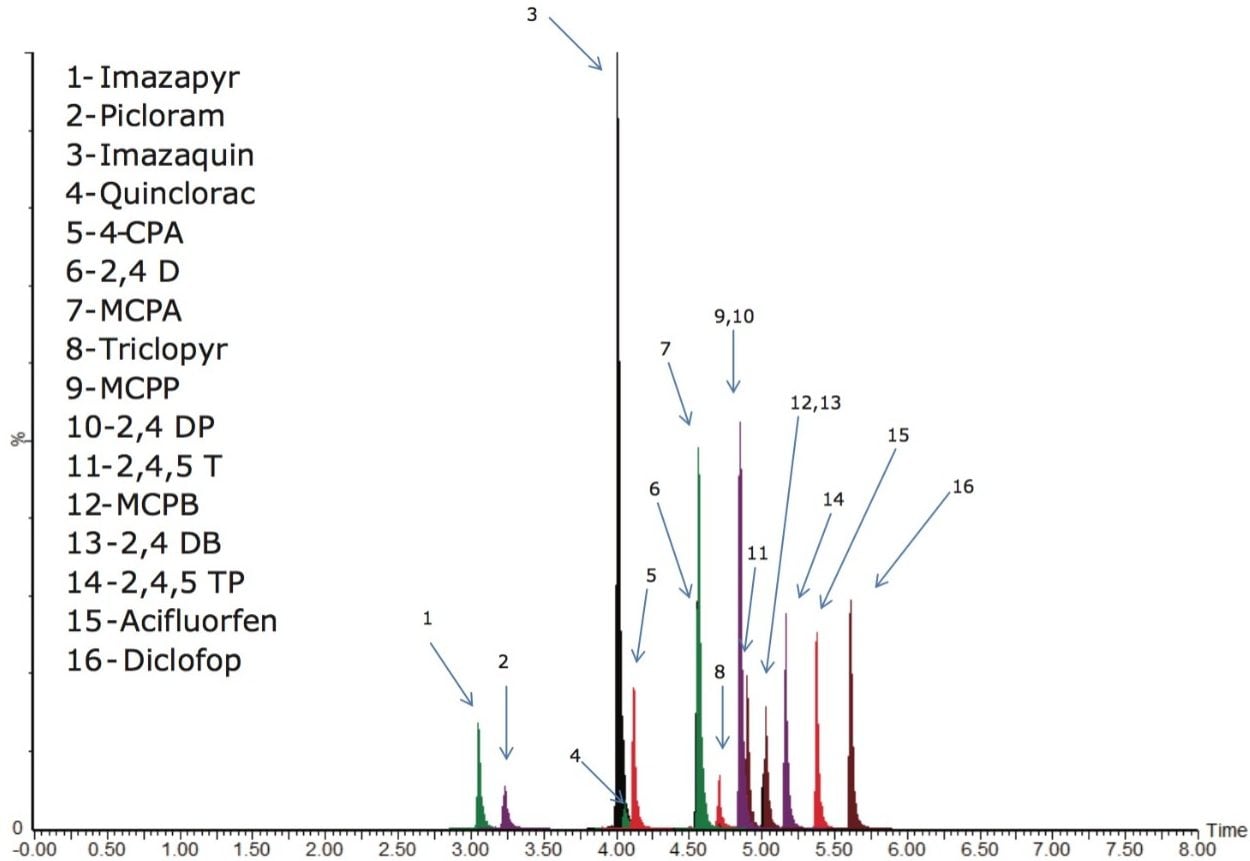
The chemical structures and MRM conditions used for the phenoxyacetic acid herbicides are listed in Figure 1 and Table 1, respectively.
UPLC system: |
ACQUITY UPLC I-Class |
Runtime: |
8.0 min |
Column: |
ACQUITY UPLC BEH C18, 2.1 x 100 mm, 1.7 μm |
Column temp.: |
60 °C |
Mobile phase A: |
0.5 % Formic acid in water |
Mobile phase B: |
0.5 % Formic acid in acetonitrile |
Elution: |
5-min linear gradient from 5% (B) to 95% (B) |
Flow rate: |
0.5 mL/min |
Injection volume: |
100 μL |
MS system: |
Xevo TQ-S |
Ionization mode: |
ESI negative |
Capillary voltage: |
2.0 kV |
Cone voltage: |
20.0 V |
Source temp.: |
140 °C |
Desolvation temp.: |
550 °C |
Desolvation gas: |
1100 L/hr |
Cone gas: |
50 L/hr |
The application began by selecting MRM transitions stored in the Quanpedia database and using IntelliStart Technology to optimize conditions for one additional compound. Quanpedia is an extensible and searchable database for quantitative LC-MS and LC-MS/MS method information that simplifies and accelerates quantitative analytical method creation. IntelliStart’s intuitive software is used to start up, tune, and calibrate Waters’ mass spectrometers and, more importantly, to automate analyte tuning and MS method building. Chromatographic separation was performed on an ACQUITY UPLC I-Class System, equipped with an ACQUITY UPLC BEH C18 2.1 x 100 mm Column. A 5-minute linear water/acetonitrile gradient with 0.5 % formic acid was used. The detection was performed using the Xevo TQ-S Mass Spectrometer. The phenoxyacetic acids standards were purchased from Sigma Aldrich (St-Louis, MO, U.S.A.). MilliQ water was used to produce calibration standards. The deuterated 2,4 D was selected as the internal standard. Water samples were collected from natural spring water sources.
When dealing with trace level analysis in the ng/L range, the extraction protocol incorporates an enrichment factor to reach the targeted level of sensitivity. This sensitivity requirement means processing a large sample volume (up to 1000 mL), which translates into long and laborious sample handling. With the introduction of the novel StepWave ion optics, the Xevo TQ-S Mass Spectrometer offers unsurpassed performance for trace-level analysis. Its high sensitivity allows for the option to bypass the tedious sample concentration requirement associated with trace-level detection of contaminants in drinking water. A clean water sample can be pre-concentrated directly on-column by simply increasing the injection volume (up to 100 µL) using the ACQUITY UPLC I-Class System with Xevo TQ-S.
In this application, MilliQ water was used to prepare calibration standards for quantification of natural spring water. As shown in Figure 2, the calibration curve for 2,4-D and 2,4,5-T for natural spring water showed excellent linearity from 5 ng/L to 1000 ng/L (r2 at 0.995). The other phenoxyacetic acids in the mix showed similar linear regression with r2 ranging from 0.995 to 0.999 for the same dynamic range, with the exception of Triclopyr, which showed good linearity from 25 ng/L to 1000 ng/L with an r2 value of 0.995.
The limit of detection (LOD) was 2.5 ng/L for all phenoxyacetic acids, except for Triclopyr, which had an LOD value of 5 ng/L. The MRM chromatograms at the LOD for a selection of the analytes are shown in Figure 3. The recoveries for a 100 ng/L spike for the phenoxyacetic acids are shown in Table 2. The fortified natural spring water samples were measured against a MilliQ water standard curve and showed recoveries in the range of 107% to 117%. For the majority of the herbicides, the average coefficient of variation (CV’s) was well below 5% in natural spring water samples.
RADAR Technology, is a unique capability of Waters’ Xevo tandem quadrupole Mass Spectrometers that enables the simultaneous acquisition of full scan MS data and MRM transitions. This functionality leads to the ability to make informed decisions during the method development process. Using RADAR mode, crucial information can be collected, such as an overview of the water sample’s complexity, which will ultimately impact the lifetime of the analytical column and the robustness of the method. Figure 4 shows the MRM chromatograms for a standard of the herbicides at 100 ng/L.
Overall, the chromatogram showed well-resolved peaks with a Gaussian distribution for all analytes, which is a key parameter for peak integration during quantitation. The chromatography also showed three co-elution zones. With mass spectrometry detection, analytes co-eluting during chromatography are resolved according to their mass-to-charge ratio. The RADAR data – which is acquired simultaneously – can be used to identify whether the herbicides are eluting in regions of potential matrix interferences. The TIC chromatogram of the RADAR data for MilliQ, and natural spring water samples are shown in Figure 5. The MilliQ and natural spring water, shown in Figure 5, detail a potential matrix effect zone during the last minute of the gradient, with a retention time range from 4.2 to 5.2 minutes.
By overlaying the MRM chromatograms of the earliest and latest eluting herbicides with the RADAR data, shown in Figure 6, it can be seen that the herbicides eluted at least 30 seconds ahead of the matrix zone. With the information gleaned from the use of RADAR Technology, confidence in the robustness of the method is gained, and changes in the matrix over time can be monitored for any new potential interference.
The results for a column lifetime study using natural spring water are shown in Figure 7. Samples were injected onto the same analytical column, and demonstrated that even after 500 injections, the analytical performance was not compromised. As shown in Figure 7, the peak shape from the first and the 500th injections for both water samples show no indication of distortion or tailing.
An example of TrendPlot Software, shown in Figure 8, gives an overall perspective of the excellent reproducibility for 150 injections of 2,4,5-T in natural spring water.
Monitoring the analytical column’s backpressure throughout its use provides a good indicator of the analytical performance of the column. With UltraPerformance Liquid Chromatography (UPLC) using sub-2 μm particles in an analytical column that is pressure rated at 18,000 psi, the direct injection technique showed reliable results for these drinking water samples.
For example, in this application, the backpressure for natural spring water showed an increase of less than 200 psi after 500 injections. Overall, for this application, the peak shape for phenoxyacetic acids in natural spring water samples showed excellent peak shape with no distortion after 500 injections. The chromatography indicates that the system is still operating at peak performance.
Trace level analysis using legacy analytical instrumentation (e.g. HPLC) will always be associated with tedious and laborious standard operating procedures (SOPs). This application note has demonstrated the versatility of direct injection using the ACQUITY I-Class UPLC System combined with the Xevo TQ-S Mass Spectrometer for the analysis of phenoxyacetic herbicides in natural spring water. The limit of detection (LOD) for the majority of the phenoxyacetic acids in this study was 2.5 ng/L, which exceeded the detection requirements of the U.S. EPA and European Union Directives. The high sensitivity of the Xevo TQ-S enabled excellent quantitation for acidic herbicides using a 100-µL injection without any pre-treatment prior to injection. The recovery data showed good results with excellent CV’s below 5% for natural spring water samples. RADAR Technology proved its value during the chromatography optimization process by identifying potential interferences or matrix effect zones.
Please contact the application note authors for additional information required for this application.
720004300, February 2013