The UPC2/MS FFA analysis described provides a simple and fast method with a significant reduction in analysis time compared to alternative techniques such as GC-MS, which requires FAME derivatization. In addition, the organic layer extract containing the lipids can be injected directly into the system, omitting the need for solvent exchange for compatibility with reversed-phase LC methods.
Fatty acids, both free and as part of complex lipids, play a number of key roles in metabolism – as major metabolic fuel (storage and transport of energy), as essential components of all membranes, and as gene regulators. In addition, dietary lipids provide polyunsaturated fatty acids that are precursors of powerful locally acting metabolites, e.g., eicosanoids.
The common fatty acids of animal and plant origin have even-numbered chains of 16 to 24 carbon atoms with 0 to 6 double bonds. Nature provides countless exceptions, however, and odd- and even-numbered fatty acids with up to nearly 100 carbon atoms exist. In addition, double bonds can be of the cis (Z) and trans (E) configuration and there can be innumerable other structural features, including branch points, rings, oxygenated functions, and many more.
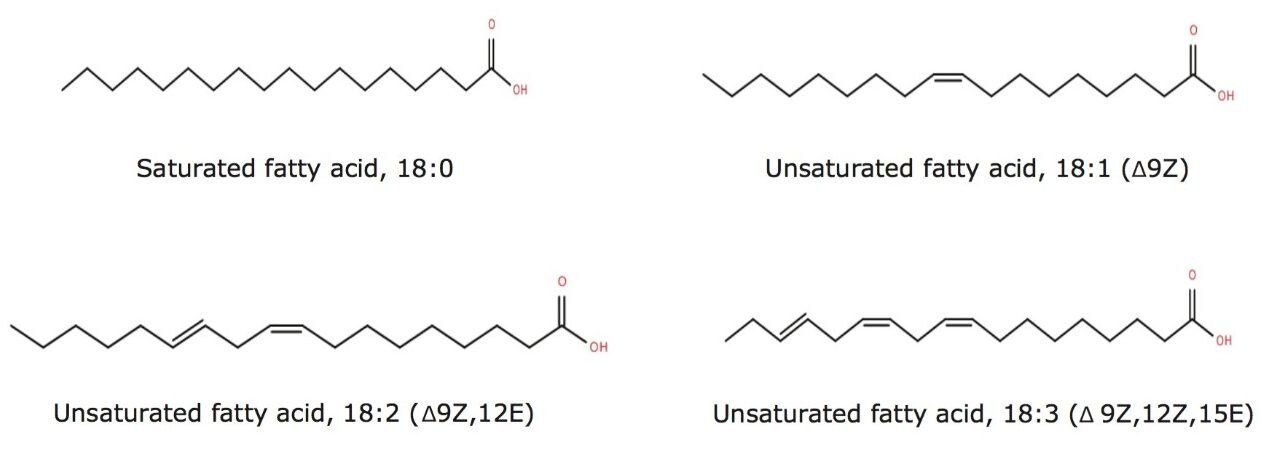
Fatty acid chains may contain one or more double bonds at specific positions (unsaturated and poly unsaturated with cis (Z) or trans (E) configuration) or they may be fully saturated. The LIPIDMAPS systematic nomenclature for fatty acids indicates the location of double bonds with reference to the carboxyl group with “Δ”.1 Fatty acid structures also contain a methyl group at one end of the molecule (designated omega, ω) and a carboxyl group at the other end. The carbon atom next to the carboxyl group is called α carbon and the subsequent one the β carbon. The letter “n” is also often used instead of ω to indicate the position of the double bond closest to the methyl end.2 Figure 1 outlines the structures of different straight chain fatty acids.
The isolation of free fatty acids (FFA) from biological materials is a complex task and precautions should be taken at all times to prevent or minimize the effects of hydrolyzing enzymes. After isolation, the typical chromatographic methods for analyzing fatty acids include gas chromatography/mass spectroscopy (GC-MS) and liquid chromatography-tandem mass spectrometry (LC-MS/MS). However, there are shortcomings associated with each of these methods.
For example, GC methods require derivatization of the fatty acids to hydrolyze and convert to methyl esters, which is time-consuming and risks re-arrangement of the fatty acids during derivatization, leaving doubt as to whether the esters formed are from FFA or intact complex lipids. Moreover, the GC-MS analysis of low volatile, very-long-chain fatty acids with high molecular weight (>C24) is a problem even after fatty acid methyl ester (FAME) derivatization.
In LC/MS methods, although no sample derivatization is required, the runs typically involve labor-intensive and time-consuming sample preparation, and utilize toxic organic solvents, which are expensive to purchase and dispose. In a typical reversed phase (RP) LC/MS analysis, the organic extracts containing all the lipids have to be evaporated and re-constituted in a more compatible injection solvent.
Thus, it would be beneficial to have streamlined methods for the separation and determination of fatty acids. Here, we present a rapid, high-throughput and efficient method for the separation and analysis of FFA using UltraPerformance Convergence Chromatography (UPCC, or UPC2) with mass spectrometry.
UPC2 is a complementary, orthogonal separation technology that is taking its place alongside LC and GC. While all three use a stationary phase to interact with compounds of interest and a mobile phase to move compounds through the stationary phase and achieve separation, the techniques differ mainly by the mobile phases used.
GC is defined by using a gas as its mobile phase, LC is defined by using liquids as its mobile phase, and CC is defined by using both gas and liquids. It is this convergence of mobile phases in combination with a far greater choice of stationary phases that makes CC a powerful additional choice for laboratory scientists. Because UPC2 can receive samples in organic solvents such as hexane and chloroform, it significantly simplifies the requirements for sample preparation, while maintaining all the advantages of RPLC.
Here, the analysis of fatty acids in the free form instead of FAME derivatives results in easier and faster sample preparation. The organic phase extract containing all the FFA can be injected directly into the system, which results in significant savings in sample preparation and analysis time, solvent costs, and solvent waste disposal. Additionally, artifact formation that can result from a derivatization procedure is eliminated.
System: |
ACQUITY UPC2 |
Columns: |
Viridis HSS C18 SB 1.8 µm, 2.1 x 150 mm |
Column temp.: |
50 °C |
Sample vial: |
Total Recovery Vial |
Sample temp.: |
10 °C |
Injection volume: |
0.5 µL |
Flow rate: |
0.6 mL/min |
Mobile phase A: |
CO2 |
Mobile phase B: |
Methanol in 0.1% formic acid |
Make up: |
Methanol in 0.1% NH4OH (0.2 mL/min) |
Splitter: |
Upchurch cross 1/16 PEEK |
Time (min) |
%A(CO2) |
%B |
Curve |
---|---|---|---|
0.0 |
95.0 |
5.0 |
Initial |
5.0 |
75.0 |
25.0 |
6.0 |
5.1 |
50.0 |
50.0 |
1.0 |
6.0 |
50.0 |
50.0 |
11.0 |
8.0 |
95.0 |
5.0 |
1.0 |
Mass spectrometer: |
Xevo G2 QTof |
Ionization mode: |
ESI negative |
Capillary voltage: |
1.0 kV |
Cone voltage: |
30 V |
Source temp.: |
100 °C |
Desolvation temp.: |
500 °C |
Cone gas flow: |
10 L/h |
Desolvation gas flow: |
600 L/h |
Acquisition range: |
50 to 600 m/z |
Individual saturated FFA standards containing even carbon number C8 to C24 were purchased from Sigma. A complex model mixture of different FFA standards (GLC-85 in FFA form) was purchased from Nu-Chek Prep (Elysian, MN, USA). The list of FFA standards analyzed and other detailed information is provided in Table 1. A 1 mg/mL stock solution was prepared in chloroform, and 0.1 mg/mL working lipid mixtures were prepared in chloroform, then injected onto the UPC2/MS System.
Oil produced from hydrous pyrolysis of algae and algaenan at low and high pyrolysis temperature were provided from Old Dominion University (Norfolk, VA, USA). Algae 1 and algaenan 1 were treated at a pyrolysis temperature of (310 °C); and Algae 2 and algaenan 2 were treated at a pyrolysis temperature of (360 °C).
Extraction of algaenan was performed by a modified extraction procedure. Briefly, lipids were removed from the algae by Soxhlet extraction with 1:1 (v/v) benzene/methanol solvent mixture for 24 hours. The residue was treated with 2N sodium hydroxide at 60 °C for two hours. The remaining residue was then washed excessively with deionized water, followed by treatment with Dowex 50W-x8 cation exchange resin to exchange any residual sodium. Finally, the solid was rinsed with deionized water. The oil samples were diluted 10 times in dichloromethane, and 1 µL was injected onto the UPC2/MS System.
When using multivariate data analysis for sample comparison, it is crucial that each sample is randomized and injected a minimum of three times to ensure that the data analysis is statistically valid. For this study, five replicates of each algae and algaenan oil extracts were acquired in MSE mode, an unbiased Tof acquisition method in which the mass spectrometer switches between low and elevated collision energy on alternate scans. Data analysis and FFA identification were performed using TransOmics Informatics for Metabolomics and Lipidomics (TOIML).
Figure 2 shows the separation of saturated FFA with carbon chain length C8 to C24. The Viridis High Strength Silica (HSS) C18 SB 1.8 µm, 2.1 x 150 mm Column provides an RP-like separation that results in effective separation of the different FFA species. The gradient is run under acidic conditions using a small percentage of formic acid (0.1% v/v in methanol) to improve the peak shape and decrease peak tailing.
The ACQUITY UPC2 method is 10X faster (only a three-minute run) than GC-MS and RPLC methods, and uses less toxic and cheaper CO2 as a solvent. A typical lipidomics study involves the analysis of thousands of biological samples, and the additional speed allows for large sample sets to be analyzed efficiently, improving the overall power of the experiment.
The FFA lipid molecular species separation mechanism is mainly based on hydrophobic interaction of the FFA carbon numbers and number of double bonds with the HSS C18 SB material. Therefore, the elution order of the FFA species depends on the length and the number of double bonds on the fatty acid chain. Thus, the longer and the more saturated the acyl chain length the longer the retention time.
The co-solvent mobile phase B (methanol in 0.1% formic acid) can be optimized to increase the chromatographic resolution and peak capacity. The higher the percentage of the co-solvent, the shorter the retention time and the narrower the peaks. However, when analyzing a complex biological sample containing saturated and unsaturated FFA species with different carbon chain length, peak capacity is important in order to reduce coeluting lipid species. The co-solvent gradient 5% to 25% methanol in 0.1% formic acid was used for further analysis.
Reversed-phase chromatography separates lipids according to both chain-length and degree of unsaturation. The problem lies in the fact that the dual nature of the reversed-phase separation process (a double bond in the fatty acyl chain reduces the retention time and the fatty acyl chain length increases the retention time) can hamper the analysis of real samples; the number of components is often so great that identification becomes difficult due to coelution (Figures 3A and B).
On the other hand, by using the precursor exact mass, corresponding product ion information and ion mobility (separation of lipid ions in the gas phase according to their size and molecular shape), each coeluting peak can be extracted and identified.
Another benefit of the method is the ability to separate between lipid isomers. FFA can have different biological functions based on the double bond position (e.g., omega-3 and omega-6). Figure 4 shows the separation of FFA isomers based on the position of the double bond. The separation of 18:3 (Δ6,9,12) and 18:3 (Δ9,12,15); and 20:3 (Δ8,11,14) and 20:3 (Δ11,14,17) isomers have been observed.
The developed UPC2/Xevo G2 QTof MS method was applied with minor modifications for the profile of FFA in algae and algaenan extracts treated at low (310 °C) and high (360 °C) pyrolysis temperatures.
Algaenan is a non-hydrolyzable, insoluble biopolymer in the cell walls of several green freshwater and marine microalgae.3 Figure 5 shows a representative chromatogram from algaenan 1 with the UPC2 conditions used for the analysis. For complete analysis of the data, set the gradient 1% to 10% co-solvent mobile phase B (methanol in 0.1% formic acid) in 10 minutes was used.
The lipid profiles of the algae and algaenan oil were investigated using TransOmics (TOIML) Software to determine the pattern and composition of FFA at two different pyrolysis temperatures. Differential analysis of results across different treatments can quickly be performed, thereby facilitating identification and quantitation of potential biomarkers. The software adopts an intuitive workflow approach to performing comparative UPC2/Xevo G2 QTof MS metabolomics and lipidomics data analysis.
The workflow starts with UPC2/MS raw data file loading, then retention time alignment and deconvolution, followed by analysis that creates a list of features. The features are then identified with compound searches and explored using multivariate statistical methods.
Principal component analysis (PCA) was used in the first instance to identify the combination of the FFA species that best describe the maximum variance between algae 1, algae 2, algaenan 1, and algaenan 2 oils (Figure 6). The PCA plot showed excellent technical UPC2/MS measurements. The PCA plot effectively displays the inter-sample relationships in multi-dimensional hyperspace, with more similar samples clustering together and dissimilar samples separated.4
The clustering in Figure 6 indicates that algae 1 and algaenan 1 are different, but algae 2 and algaenan 2 have more similarity in their FFA compositions after high pyrolysis temperature treatment. Orthogonal projections latent structure discriminant analysis (OPLS-DA) binary comparison can be performed between the different sample groups (algae 1 vs. algae 2, algaenan 1 vs. algaenan 2, algae 1 vs. algaenan 1, and algae 2 vs. algaenan 2) to find out the features that change between the two groups.
As an example, the OPLS-DA binary comparison between algae 1 vs. algae 2 is shown in Figure 7A. As shown in the S-plot, the features that contribute most to the variance between the two groups are those farthest from the origin of the plot, highlighted in red (Figure 7B). These selected features can be exported to TransOmics for further identification. This helps the researcher focus on the features/compounds that change between samples instead of spending time on the whole data set.
Figures 7C and 7D show representative trend plots that change most between algae 1 and algae 2. Figure 8A shows the ion map, mass spectrum, and chromatogram across all the runs for FFA 29:0. This view allows to review compound measurements such as peak picking and alignment to ensure they are valid across all the runs. Figure 8B shows the normalized abundance of FFA 29:0 across all the conditions. FFA 29:0 is elevated in algeanan 1 compared to algae 1, algae 2, and algeanan 2; however, there is no significant difference between algae 2 and algeanan 2. Detailed investigation and comparison between algae 1 and algae 2 showed that algae 1 contains elevated levels of short (C9:0 to C13:0) and long (C31:0 to C37:0) chain FFA, whereas algae 2 contains elevated levels of medium (C14:0-C29:0) chain FFA. Similarly, the comparison between algaenan 1 and algaenan 2 showed that algaenan 1 contains elevated levels of long (C28:0 to C37:0) chain FFA, whereas algaenan 2 contains elevated levels of short and medium (C9:0 to C27:0) chain FFA.
Identification can be performed by means of local or web-based (such as LIPID MAPS, HMDB, and METLIN) compound searches based on retention time, low energy exact mass, high energy fragment ion, theoretical isotope pattern distribution, and collision cross section area (CCS) (Figure 8C). In this example, the feature with retention time and exact mass 3.31_437.4353 is identified as nonacosanoic acid (29:0 FFA) based on retention time, low energy exact mass, and theoretical isotope pattern distribution. Figure 9 shows the expression and abundance profile of selected features according to their relative similarity between the different groups.
The UPC2/MS FFA analysis described provides a simple and fast method with a significant reduction in analysis time compared to alternative techniques such as GC/MS, which requires FAME derivatization. In addition, the organic layer extract containing the lipids can be injected directly into the system, omitting the need for solvent exchange for compatibility with reversed-phase LC methods.
Saturated and unsaturated FFA containing C8 to C36 carbons were separated and determined, including low volatile very long chain fatty acids (>24 carbon atoms) that have challenged GC/MS even after FAME derivatization. Data analysis and FFA identification was facilitated using TransOmics for Metabolomics and Lipidomics Software that adopts an intuitive workflow approach to performing comparative ACQUITY UPC2/Xevo G2 QTof MS metabolomics and lipidomics data analysis.
720004763, July 2013