• Applikationsbericht

Data Processing Workflows for DDA and DIA LC-MS data using Symphony and MSConvert

Data Processing Workflows for DDA and DIA LC-MS data using Symphony and MSConvert

  • Jimmy Yuk
  • Giorgis Isaac
  • Hans Vissers
  • Waters Corporation

For research use only. Not for use in diagnostic procedures.

This is an Application Brief and does not contain a detailed Experimental section.

Abstract

This application brief enables the use of third party platforms for the data analysis of data dependent acquisition (DDA) and data independent acquisition (DIA) high resolution mass spectrometry (HRMS) acquisitions mode data.

Benefits

A simple and seamless data processing workflow is demonstrated to convert all MassLynx acquisitions mode data to open source data formats for downstream, application centric analysis.

Introduction

Mass spectrometry (MS) open source data formats such as Mascot generic format (mgf), mzML, mzXML, etc., are becoming increasingly more popular for the analysis of LC-MS data, which allow the MS community to analyze their datasets independent of the vendor MS platform software. Many third party MS informatics products utilize these data formats to perform a wide variety of analytics, such as multivariate statistics, metabolic flux analysis, and library screening. An example of a third party MS application software is Global Natural Products Social Molecular Networking (GNPS).¹ GNPS is a web-based platform that allows for on-line de-replication, molecular network analysis, and online compound searching through crowdsourced MS/MS spectrum curation. GNPS accepts open source data formats. Other tools that consume open source formats include, for example, Polly,² MetaboAnalyst,³ and MZmine 2.⁴ For Waters Corporation MS datasets, third party application software typically consumes MassLynx data in either raw, converted, or processed format. In the case of the latter, peak detection, centroiding, and deconvolution would be required. 

Symphony Data Pipeline is a software product that enables automated data processing functions in sequence after data acquisition. It allows streamlined data conversion of MassLynx .raw files to the appropriate open source data formats so that they can be used by third party applications. In this Technology Brief, a catechin standard mixture will be used as an example LC-MS dataset, which is converted to an open source data format for GNPS analysis using Symphony. Additional informatics products, and which open source formats they require and/or consume, are provided as a reference.

Mode

Method/tool

Data type

Third party software

Raw

API

All*

Progenesis QI, SimLipid, Skyline

Raw

MassWolf

MS1, DDA

Mzmine 2

Converted

MSConvert

All*

XCMS, EIMAven, Polly, Curatr

Processed

Symphony

MSE, HDMSE, SONAR

GNPS, MetaboAnalyst

Processed

MSConvert

DDA

GNPS, MetaboAnalyst

Table 1. Small molecule omics data conversion modes, methods, and third party software examples. * MS, DDA, HD-DDA, MSE, HDMSE and SONAR; ° Other, non-small molecule omics third party software include Mascot/Distiller, Spectronaut, Mass-MetaSite, and Byonic.

Results and Discussion

Three cases are shown in Table 1, including application analysis software examples.

The first case outlines application software that access the raw data directly and typically use Application Programming Interfaces (APIs), (available at https://interface.waters.com/) and are distributed, under license, together with the software, offering direct interfacing for data analysis to end-users.

The second case involves application/data analysis software that utilizes converted continuum data as input. Common open source formats include mzXML and mzML. Although the former is superseded by the latter, it is still used by many (bio)informatics tools. A popular conversion tool is MSConvert by ProteoWizard,5,6 which can take format features, coding options, and vendor particularities into consideration. Typically, the conversion is conducted prior to the import, but certain applications, such as Skyline,⁷ use the MSConvert data access library to import data directly. Following import, the application software conducts peak detection and analysis.

The last application software group utilizes peak detected, centroided, and optionally, deconvoluted data as input. Open source and commercial software tools are available to conduct these types of tasks, but typically vendor software is applied. The output in all cases, a flat file comprising a precursor-product ion list, in a community accepted format. This is typically required for unique DIA modes such as MSE, HDMSE, and SONAR, that are specific to vendors and require specialized peak detection algorithms to create the final peak list file.

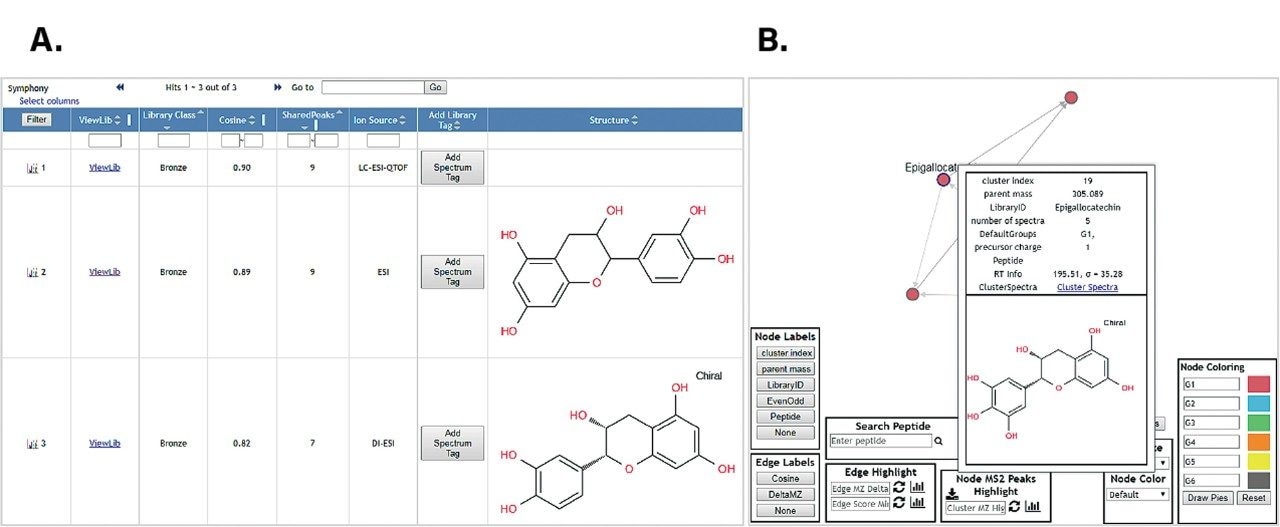
The GNPS¹ case, representing an application software group that consumes peak detected, centroided, and optionally, deconvoluted data as input, is used as an example to illustrate how Symphony,⁸ can be used to peak detect and deconvolute MSE, HDMSE, and SONAR data, and subsequently generate a community standards peak lists in various formats. For DDA files, which is commonly used in GNPS, Symphony is not required and an open source tool such as MSConvert can be used to convert the data instead. 

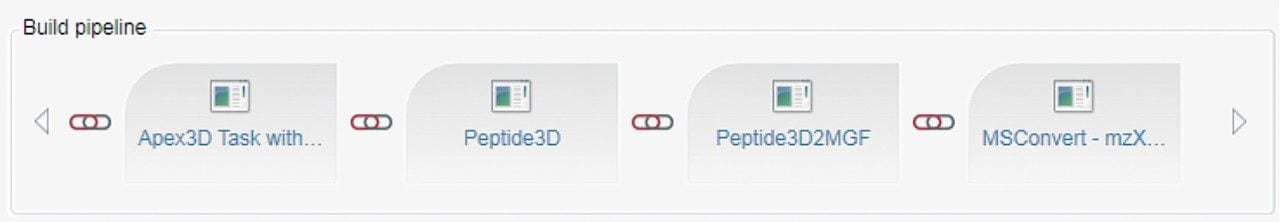
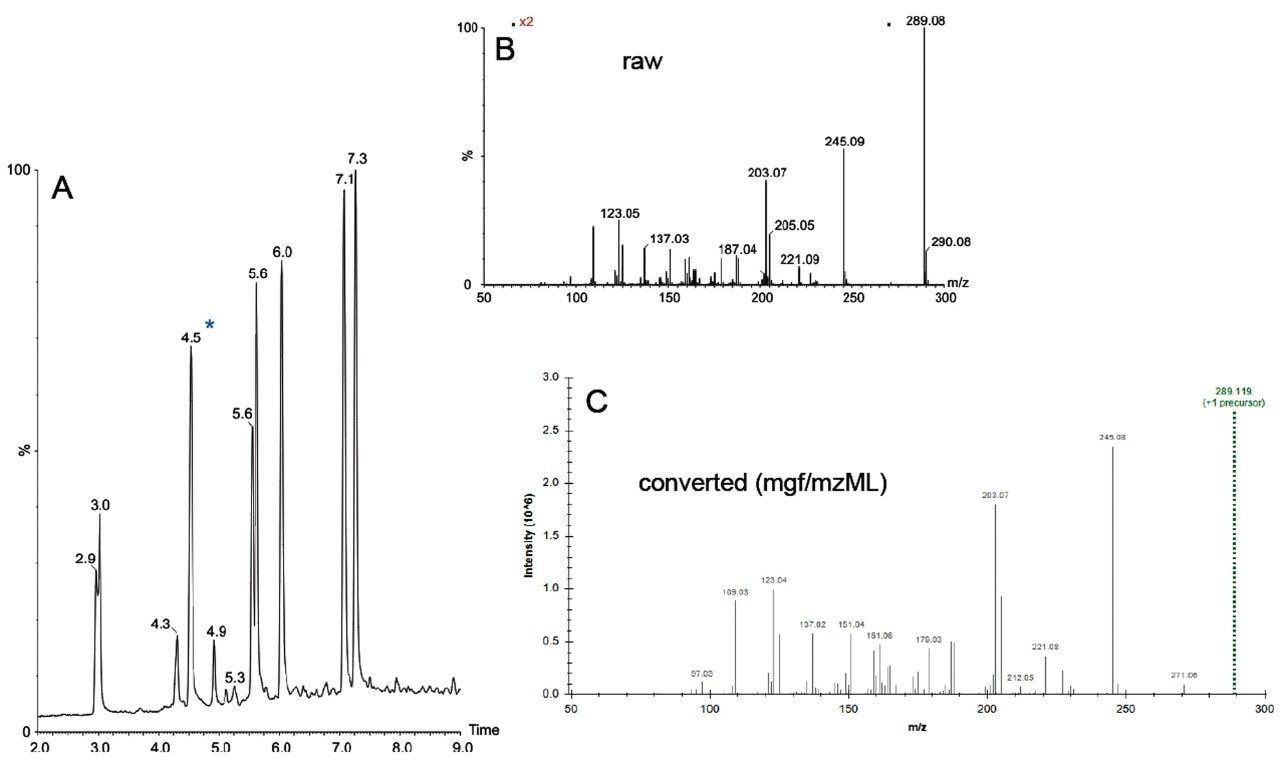
Shown in Figure 1 are the basis components of the conversion pipeline, available at https://marketplace.waters.com/home.⁸ The first module detects peaks in multiple dimensions (retention time, drift time (HDMSE) or quadrupole m/z (SONAR), m/z, and intensity), the resulted data matrix is deconvoluted to a peak list that contains m/z intensity pairs, which is subsequently converted to mgf, mzXML, and mzML files. The two latter conversion steps use a script and MSConvert, respectively. All executables and scripts are command line controlled by Symphony and the process is initiated from the sample list of the MassLynx instrument operating software. In practice, this means that the conversion from raw to processed data is conducted as soon as data acquisition finishes, typically when the LC-MS resets itself for the next injection. This means that all converted files are available for application analysis as soon as the LC-MS data acquisition finishes.

Figure 1. A Symphony pipeline example that chains 3D peak detection (Apex3D), deconvolution and deisotoping (Peptide3D), conversion to mgf, and subsequent MSConvert data conversion from mgf to mzML.

The conversion process and the result are graphically summarized in Figure 2, showing the TIC of the reversed phase separation of a catechin standard mixture (A), the raw MSE data independent acquisition spectrum of the component eluting at 4.5 min (B), and its corresponding deconvoluted and centroided spectrum (C). A similar workflow/pipeline is applicable for HDMSE and SONAR data acquisition types (not shown). DDA and HD-DDA can be processed and converted directly using MSConvert, either embedded in a Symphony pipeline, affording productivity benefits, or via its graphical user interface. 

Figure 2. Synopsis conversion workflow illustrating the deconvolution of LC-MSE data, (A) and (B), conversion to open source format spectra in mgf or mzML peak list format (C), viewed with SeeMS [2], for the blue asterix labeled peak eluting at 4.5 min.

The converted spectra were submitted in either protonated or deprotonated form for a GNPS search to investigate and demonstrate the compatibility of the processing workflow/pipeline with community resources. The results of a single spectrum search are shown in Figure 3, illustrating the library and molecular network search results of the data shown in Figure 2.

Figure 3. Library hits from a single spectrum (A) and library network (B) GNPS search excerpts for the data shown in Figure 2C and the 10 compound Catechin sample/data set as a whole, respectively.

Conclusion

Mass spectrometry open source data are important for the analytical community to have full flexibility to use third party software for their data analysis. Symphony Data Pipeline software provides a simple and seamless workflow for converting Waters datasets into open source data formats and allows customers to customize how the data is processed, including linking with data conversion tools like MSConvert. In this technology brief, we have shown the use of Symphony Data Pipeline software to convert a catechin standard mixture to mgf and mzML open source formats and their use in third party software, GNPS, for molecular networking and library searching. To learn more about the benefits of using Symphony to create data pipelines for automation and throughput please visit cited reference.⁹  

References

  1. Sharing and community curation of mass spectrometry data with Global Natural Products Social Molecular Networking. Wang M. et al. Nat Biotechnol. 2016 Aug 9;34(8):828–837.
  2. Elucidata Website.
  3. MetaboAnalyst 4.0: towards more transparent and integrative metabolomics analysis. Chong, J., Soufan, O., Li, C., Caraus, I., Li, S., Bourque, G., Wishart, D.S. and Xia, J. Nucl. Acids Res. 2018 July Volume 46, Issue W1, 2 Pages W486–W494.
  4. MZmine 2: Modular framework for processing, visualizing, and analyzing mass spectrometry-based molecular profile data. T. Pluskal, S. Castillo, A. Villar-Briones, M. Orešič, BMC Bioinformatics. 2010. 11:395.
  5. Employing ProteoWizard to Convert Raw Mass Spectrometry Data. Holman JD, Tabb DL, Mallick P. Curr Protoc Bioinformatics. 2014 Jun 17;46:13.24.1–9.
  6. Proteowizard website.
  7. Skyline: an open source document editor for creating and analyzing targeted proteomics experiments. MacLean B, Tomazela DM, Shulman N, Chambers M, Finney GL, Frewen B, Kern R, Tabb DL, Liebler DC, MacCoss MJ. Bioinformatics. 2010 Apr 1;26(7):966–8.
  8. Symphony Software Webpage
  9. Improved Efficiency of Proteomics Data Processing Using Symphony Data Pipeline Software, Waters Corporation, Application Note 720005784EN, 2016.

Featured Products

720006415, November 2018

Zurück zum Seitenanfang Zurück zum Seitenanfang