• Applikationsbericht

Method Development and Transfer of Synthetic Peptide Impurity Analysis by Waters Reversed-Phase Columns

Method Development and Transfer of Synthetic Peptide Impurity Analysis by Waters Reversed-Phase Columns

  • Hua Yang
  • Stephan M. Koza
  • Weibin Chen
  • Waters Corporation

Abstract

This application note shows examples of successful method development and transfer from UPLC to HPLC using the synthetic peptide eledoisin.

Benefits

  • Method development factors
  • Method transfer from UPLC to HPLC

Introduction

Impurities of synthetic peptides can be introduced during manufacturing and upon storage. These impurities need to be characterized and monitored, since they can potentially affect the safety and efficacy of the therapeutic peptide.

Reversed-phase chromatography has been one of the most useful tools in synthetic peptide impurity separations, due to its high resolving power. In addition to the column selected, the primary factors affecting peptide impurity resolution include gradient slope, flow rate, column length, and separation temperature. While method development time and sample throughput can benefit from the use of columns containing sub-2-μm particles, method transfer from UPLC (i.e., <2 μm particles) to HPLC (i.e., >2 μm) may be necessary if only HPLC instrumentation is available. This application note shows examples of successful method development and transfer from UPLC to HPLC using the synthetic peptide eledoisin.1 Eledoisin has the amino acid sequence pGlu-Pro-Ser-Lys-Asp-Ala-Phe-Ile-Gly-Leu-Met-NH2 and a monoisotopic mass of 1187.6 Da.

Experimental

Sample description

Eledoisin was purchased from New England Peptide, Gardner, MA, USA. The received lyophilized material was reconstituted in water to a concentration of 2 mg/mL. The samples were further diluted to lower concentrations in 0.1% formic acid.

LC conditions

System

ACQUITY UPLC H-Class Bio

Sample temp.

4 °C

Analytical

column temp.:

60 °C

Flow rate:

0.3 mL/min (general gradient)

0.2 mL/min (optimized gradient)

Injection volume

2.5–10 μL

Column:

ACQUITY UPLC Peptide CSH C18, 130Å,

1.7 μm, 2.1 × 150 mm

(p/n: 186006938)

ACQUITY UPLC Peptide CSH C18, 130Å,

1.7 μm, 2.1 × 100 mm

(p/n: 186006937)

ACQUITY UPLC CSH C18, 130Å,

1.7 μm, 2.1 × 75 mm

(p/n: 186005620)

ACQUITY UPLC Peptide CSH C18, 130Å,

1.7 μm, 2.1 × 50 mm

(p/n: 186006936)

XSelect Peptide CSH C18 XP, 130Å,

2.5 μm, 4.6 × 150 mm

(p/n: 186007038)

XSelect CSH C18 XP, 130Å,

2.5 μm, 4.6 × 75 mm

(p/n: 186006110)

XSelect Peptide CSH C18, 130Å,

3.5 μm, 4.6 × 150 mm

(p/n: 186006957)

Detection:

ACQUITY UPLC TUV with

5 mm titanium flow cell, 214 nm

Sample

collection/vials:

LCGC Certified Clear Glass 12 × 32 mm

Screw Neck Total Recovery Vial, with

Cap and Pre-slit PTFE/Silicone Septa,

1 mL volume, 100/pkg

(p/n: 186000385C)

Mobile phase A:

0.1% (v/v) trifluoroacetic acid (TFA)

in water

Mobile phase B:

0.1% (v/v) trifluoroacetic acid (TFA)

in acetonitrile

General gradient (Figure 1a):

Time

Flow rate

(mL/min)

%A

%B

0.00

0.3

82

18

2.00

0.3

82

18

22.00

0.3

62

38

24.00

0.3

5

95

24.01

0.3

82

18

34.00

0.0

82

18

Optimized gradient (Figure 1b):

Time

Flow rate

(mL/min)

%A

%B

0.00

0.2

80

20

2.00

0.2

80

20

32.00

0.2

72

28

34.00

0.2

5

95

34.01

0.2

80

20

44.00

0.0

80

20

Method transfer gradient:

Time

Flow rate

(mL/min)

%A

%B

0.00

0.2

84

16

2.00

0.2

84

16

32.00

0.2

74

26

34.00

0.2

5

95

34.01

0.2

84

16

44.00

0.0

84

16

Results and Discussion

Method development tools

Gradient slope and flow rate

Figure 1 shows the separation of eledoisin and its impurities on a Peptide CSH C18, 130Å, 1.7 μm column. The gradient slope of the screening method (Figure 1a) is 1.73% DB/CV (CV = column volume), while that of the optimized method using a more focused gradient (Figure 1b) is 0.69% DB/CV. Not only is the gradient slope shallower but the flow rate is also reduced in the optimized method (Figure 1, bottom). As a result, the peak to valley ratio (p/v) is increased significantly. The p/v ratio is a measure for the extent of separation of two partially-resolved chromatographic peaks where the determination of resolution can be unreliable. USP Chapter <621> defines peak to valley ratio.2

Figure 1. Effect of flow rate and gradient slope.

Column length

Figure 2 shows the effect of column length on the resolution. Eledoisin was run on 2.1 × 50, 75, 100, and 150 mm length Peptide CSH C18, 130Å, 1.7 μm columns. The run times were proportionally increased to the column length so that the gradient slope relative to column volume was the same. This helps ensure that the selectivity on each column is the same. Therefore, any changes in resolution are solely due to the difference in column length and not by differences in selectivity. Clearly, as the column length increases, the resolution increases. With the gradient slope adjusted for column volume, this increase is indeed predicted to be proportional to the square root of column length.3

It is important to point out that increasing column length will not increase resolution infinitely. Longer run times are needed when using longer columns. So there should be a balance between separation time and component resolution when considering varying column length.

Figure 2. Effect of column length.

Column temperature

Column temperature can affect reversed-phase separations in many ways. Mass transfer of the sample into and out of the stationary phase pores will vary with temperature. Viscosity of the mobile phase will also be reduced at higher temperature, which will lower the back pressure generated by the column. Temperature can also affect the pH of the mobile phases, potentially resulting in changes in selectivity. Recovery could increase due to better solubility of the sample at higher temperature. However, not all peptides separate better at higher temperatures. Therefore, it is recommended that the effect of temperature be evaluated as part of the method development process.

Figure 3 shows the effect of column temperature on the eledoisin separation. In this case, higher temperature increased the observed component resolution. Please note that eledoisin has a proline residue, which undergoes bond rotation slowly at lower temperatures which could potentially broaden the peak due to the existence of distinct conformers during the separation.4 At higher temperature, the rate of bond rotation will increase and as a result, the conformational differences will not have as great an impact on selectivity and the peak width would consequently decrease. This could be one of the reasons why the resolution is increased at higher column temperature. 

Figure 3. Effect of temperature.

Other factors

Organic solvent and mobile phase additives used can change selectivity of the separation. Although acetonitrile (ACN) is the most commonly used organic solvent in reversedphase separations, methanol and isopropanol are effective, too. They can also be used in combination with ACN, or as additives in the ACN mobile phases. Formic acid and TFA are commonly used additives that lower the separation pH and decrease non-desired ionic interactions between peptide and separation media and to increase peptide retentivity. For changes of selectivity in synthetic peptide separation, please see Waters application note Synthetic Peptide Impurity Analysis on Waters Reversed-Phase Columns (p/n: 720006244EN).5

Method transfer from UPLC to HPLC

It has been proven over the years that UPLC instrumentation with columns containing sub-2-μm particles provide better resolution while not increasing analysis time compared to use of columns containing larger particles for use on HPLC instrumentation. However, sometimes a developed UPLC method needs to be transferred to use on HPLC platforms due to a lack of UPLC instrumentation in certain working environments.

Figure 4 showed scalability of the developed eledoisin separation from UPLC to HPLC. In order to keep L/dp (L = column length, dp = particle size) constant, two HPLC columns containing >2 μm particles had to be connected. The reduced linear velocity and gradient slope were also kept constant, and the injection volume and run time were scaled accordingly. All the calculations can be done using Waters Gradient Calculator. Notice that in order to maintain the same resolution, the run time for the columns containing the 2.5 μm particles is doubled, and for columns containing the 3.5 μm particles it quadrupled. 

Figure 4. UPLC to HPLC scalability while keeping L/dp constant.

If L/dp is not required to be the same, then a single column with 2.5 μm particle size is the most convenient and efficient way to be used on a HPLC instrument, as shown in Figure 5. In this case, although the resolution is sacrificed to some extent, connecting columns and generating much longer run times are avoided.

Figure 5. UPLC to HPLC scalability while avoiding longer run times.

Conclusion

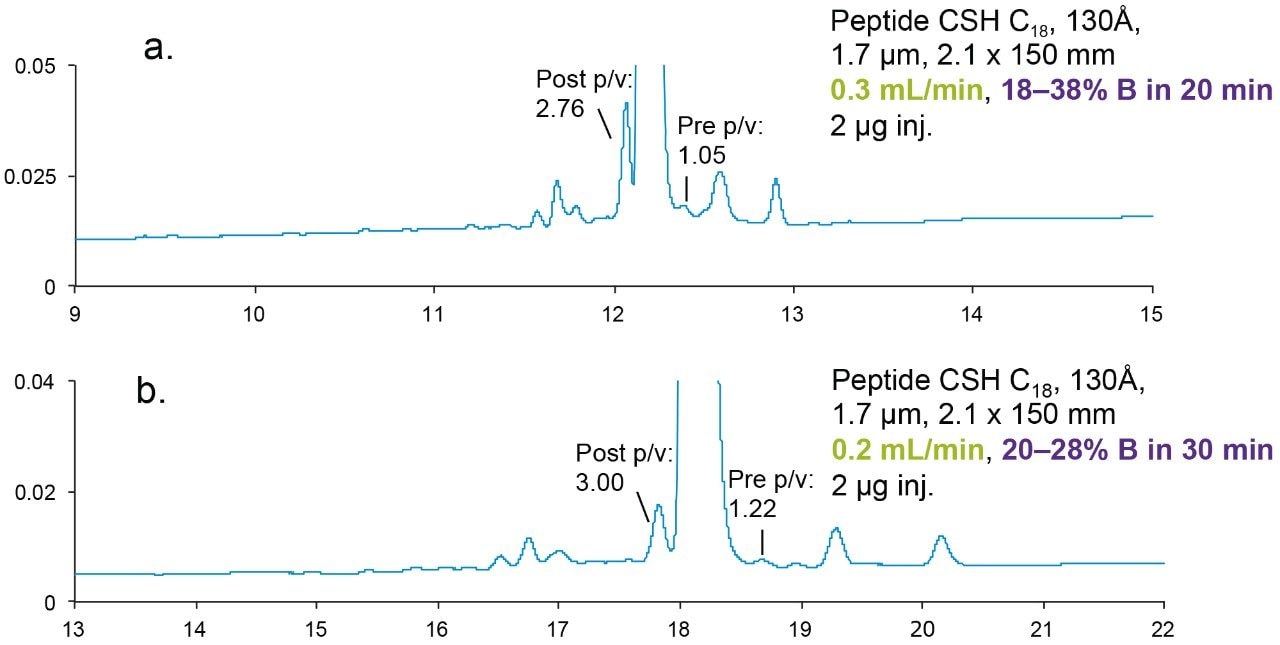
Method development is an important step in synthetic peptide impurity analysis. There are many factors that can be manipulated in reversed-phase chromatography to improve the separation of a synthetic peptide and its impurities.

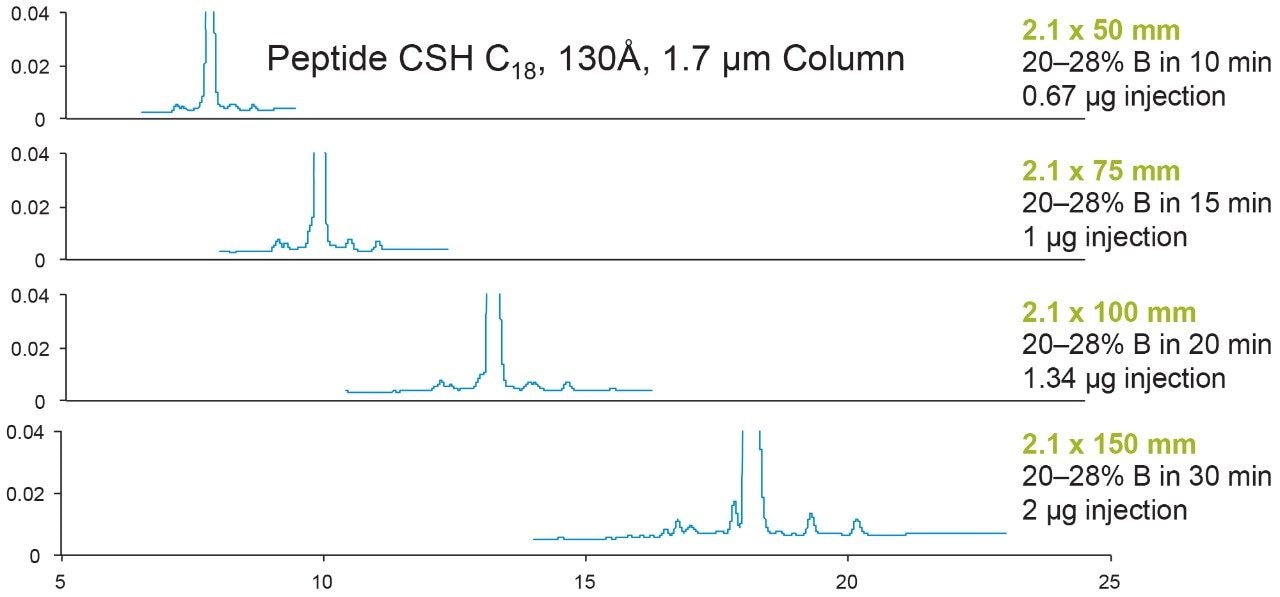
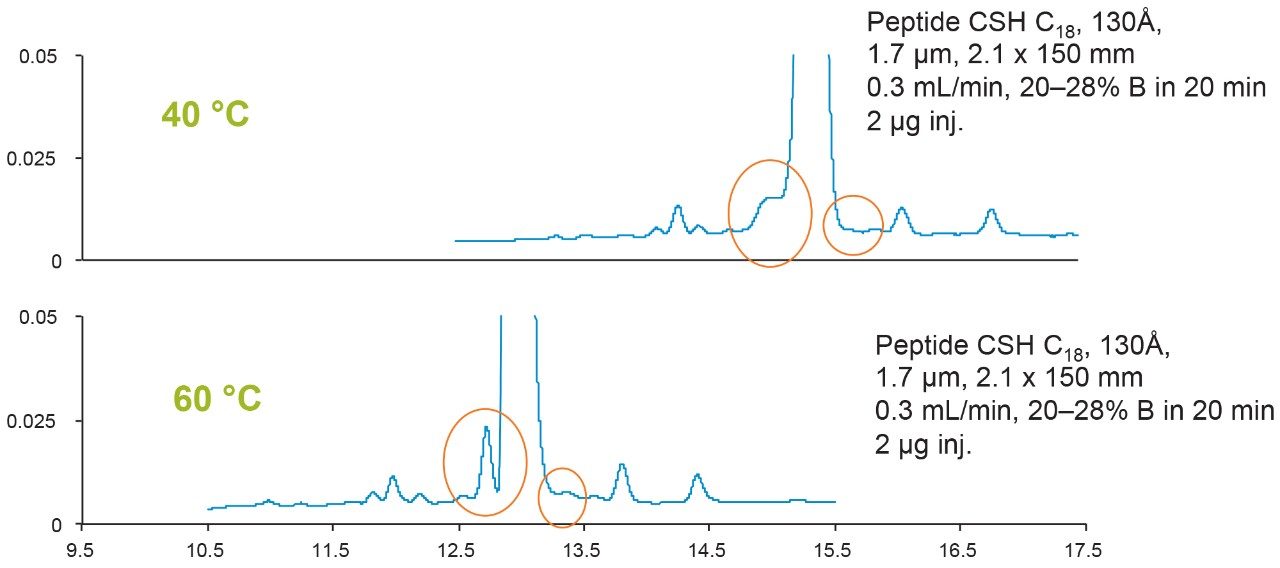
Using a shallower and more focused gradient can increase resolution. If greater gains in resolution are required, increasing column length has a significant impact on resolution as well. Altering the temperature can also provide better separations. Finally, altering the organic modifier and using alternative ion-pairing reagents can help increase the quality of the separation.

The use of columns containing sub-2-μm particles with an appropriately configured UPLC system has been proven to improve resolution while not increasing analysis time. This characteristic is due to the principle that separation efficiency is inversely proportional to the diameter of the particles used in an efficiently packed column.

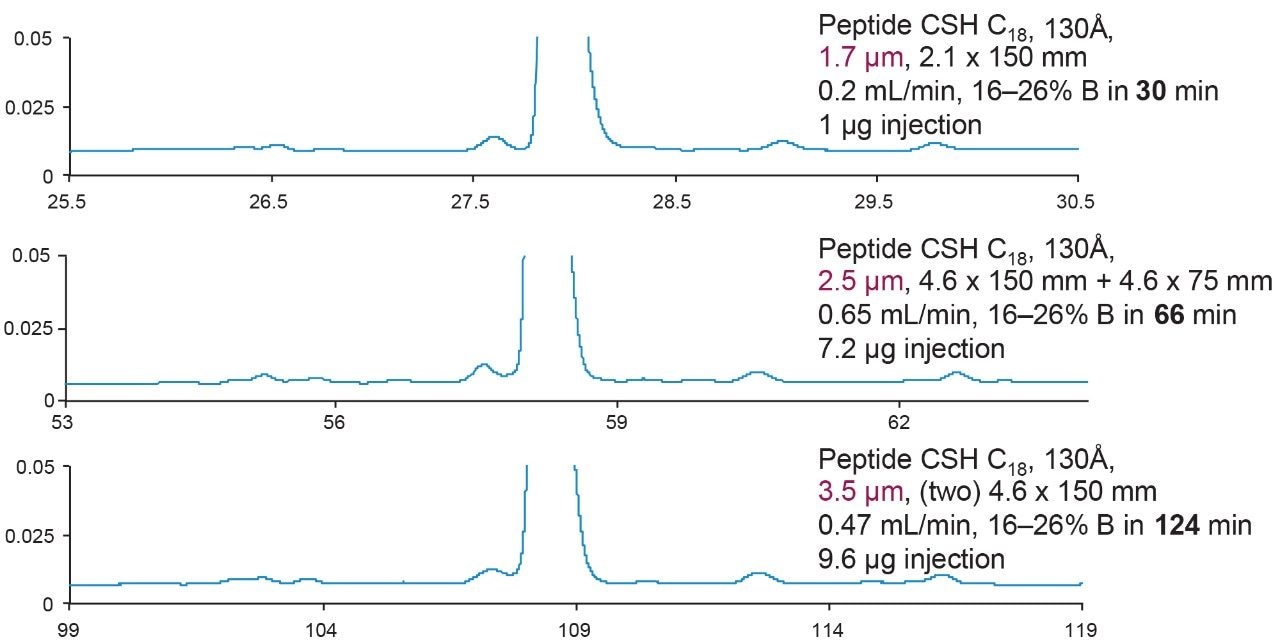
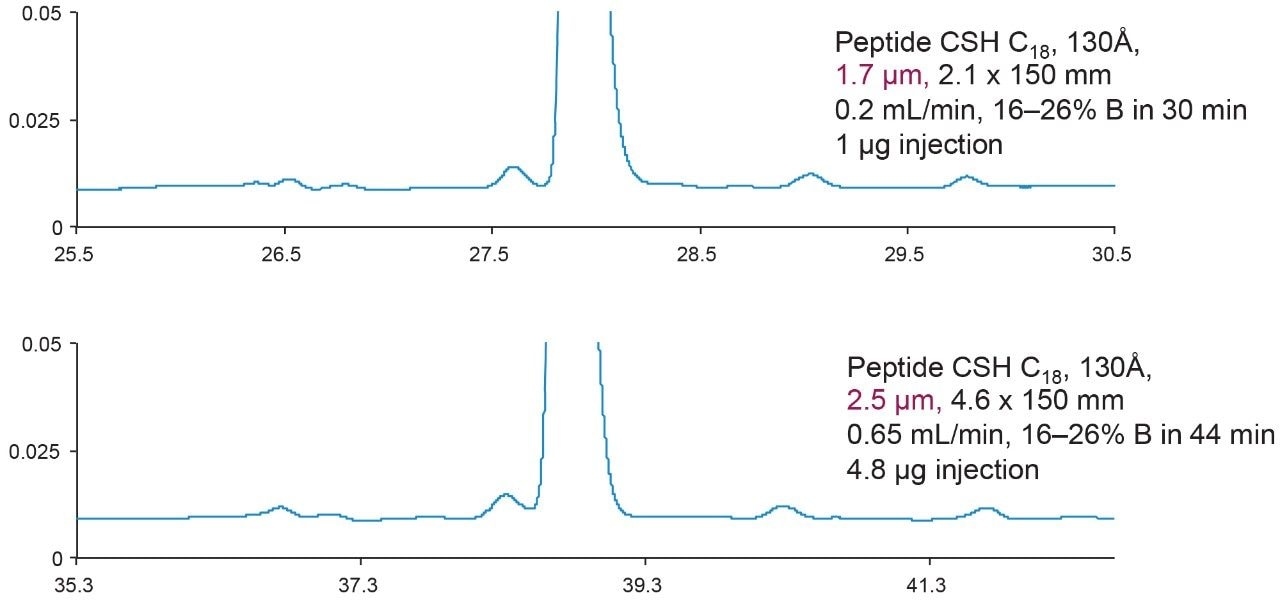
In some cases, it is necessary to transfer a method from UPLC to HPLC due to either instrument limitations or when lab-scale isolations are required for structure/function testing. Method transfer from UPLC to HPLC can be done readily, provided that the particles of varying diameter produce the same separation selectivity. The successful transfer will require use of a column containing larger particles with the same particle chemistry so that the separation will not have to be redeveloped. In order to obtain the same degree of component resolution, a longer column with scaled sample load, flow rate, and gradient will have to be used. Additionally, since HPLC systems generally exhibit greater extra-column dispersion, the use of columns with larger internal diameters is also beneficial.

References

  1. Sanz-Nebot, V.; Toro, I.; Barbosa, J. Fractionation and characterization of a crude peptide mixture from the synthesis of eledoisin by liquid chromatography-electrospray ionization mass spectrometry. J. Chromatogr. A. 1999, 846, 25–38.
  2. <621> Chromatography – USP.
  3. Gilar, M.; Neue, U.D. Peak capacity in gradient reversed-phase liquid chromatography of biopolymers: Theoretical and practical implications for the separation of oligonucleotides. J. Chromatogr. A. 2007, 1169 (1–2), 139–150.
  4. Xie, H.; Gilar, M. Improving LC peak shape of proline-rich peptides within an antibody peptide map. Waters Application Note 720003063EN, May 2009.
  5. Yang, H.; Koza S.; Warren, B; Chen, W. Synthetic peptide impurity analysis on Waters reversed-phase columns. Waters Application Note 720006244EN, April 2018.

720006311, June 2018

Zurück zum Seitenanfang Zurück zum Seitenanfang