Advanced Polymer Chromatography Reverse Phase Method for Polymer Additives Using Tetrahydrofuran and Evaporative Light Scattering Detection in Under Three Minutes per Sample
Abstract
The reverse phase liquid chromatographic (RPLC) separation of polymer additives with tetrahydrofuran (THF) as a mobile phase can be a challenge for many LC systems and detectors. LC systems and detectors are not commonly compatible with THF and other organic solvents used for dissolving polymeric samples. This application demonstrates the separation of six polymer additives with two sets of known coeluting additives: Tinuvin 327 and 328, also Irganox 1010 and 1076.1,2 The separation method for the six polymer additives is modified from high performance liquid chromatography (HPLC) to ultra-high performance liquid chromatography (UHPLC) and from UHPLC to UltraPerformance Liquid Chromatography (UPLC) using the columns calculator tool and a family of C18 columns. Evaporative light scattering detection (ELSD) is chosen for organic solvent compatibility, sensitivity, and ability to detect samples that may not be UV active.3,4
Benefits
- A 3-minute RPLC separation of six polymer additives
- System compatibility with THF
- Robust and non-swelling BEH column technology
- Columns calculator software tool for intuitive method development
- ELSD for THF compatibility and without dependency on UV activity
Introduction
Polymers have long been subject to degradation from high temperature synthesis, processing, weather, and light exposure.5 The use of polymer additives to minimize polymer degradation is a common practice.6 The first chromatographic separations of polymers and polymer additive mixtures used large particles and required long analysis times. Over the years, chromatographic technology has improved with smaller separation particles and significantly shorter analysis times.7 Older separation methods using HPLC are commonly updated to more advanced LC systems for higher quality or faster results. The polymer industry typically uses aggressive organic solvents, like THF, to dissolve their samples, and many LC systems are not intended for use with these harsh solvents.
This document presents a series of chromatographic methods to separate a blend of six polymer additives demonstrating the ability to convert methods from an older HPLC technique to the more advanced UHPLC and UPLC techniques using one solvent compatible system and one column family: the ACQUITY Advanced Polymer Chromatographic (APC) System with a polymer Quaternary Solvent Manager (p-QSM) and ELSD, and the ACQUITY BEH C18 Columns.8,9
Experimental
This document includes three experiments that calculate a method from a 5 µm column to a 2.5 µm column, and from a 2.5 µm column to a 1.7 µm column. Each column experiment has a unique set of instrumental parameters.
The sample preparation contains six polymer additives listed in Table 1 that were dissolved in THF at 1.0 mg/mL each, and then 100 µL of each solution was then added to a 2 mL LC vial (p/n: 186005660CV) and diluted with 600 mL of THF for a final concentration of 0.5 mg/mL. Experiment 1, 2, and 3 used the same samples and sample tray with its corresponding column. The gradient, injection volume, and flow rate were adjusted for each experiment based on the results from the columns calculator software tool (Figures 1, 2).10
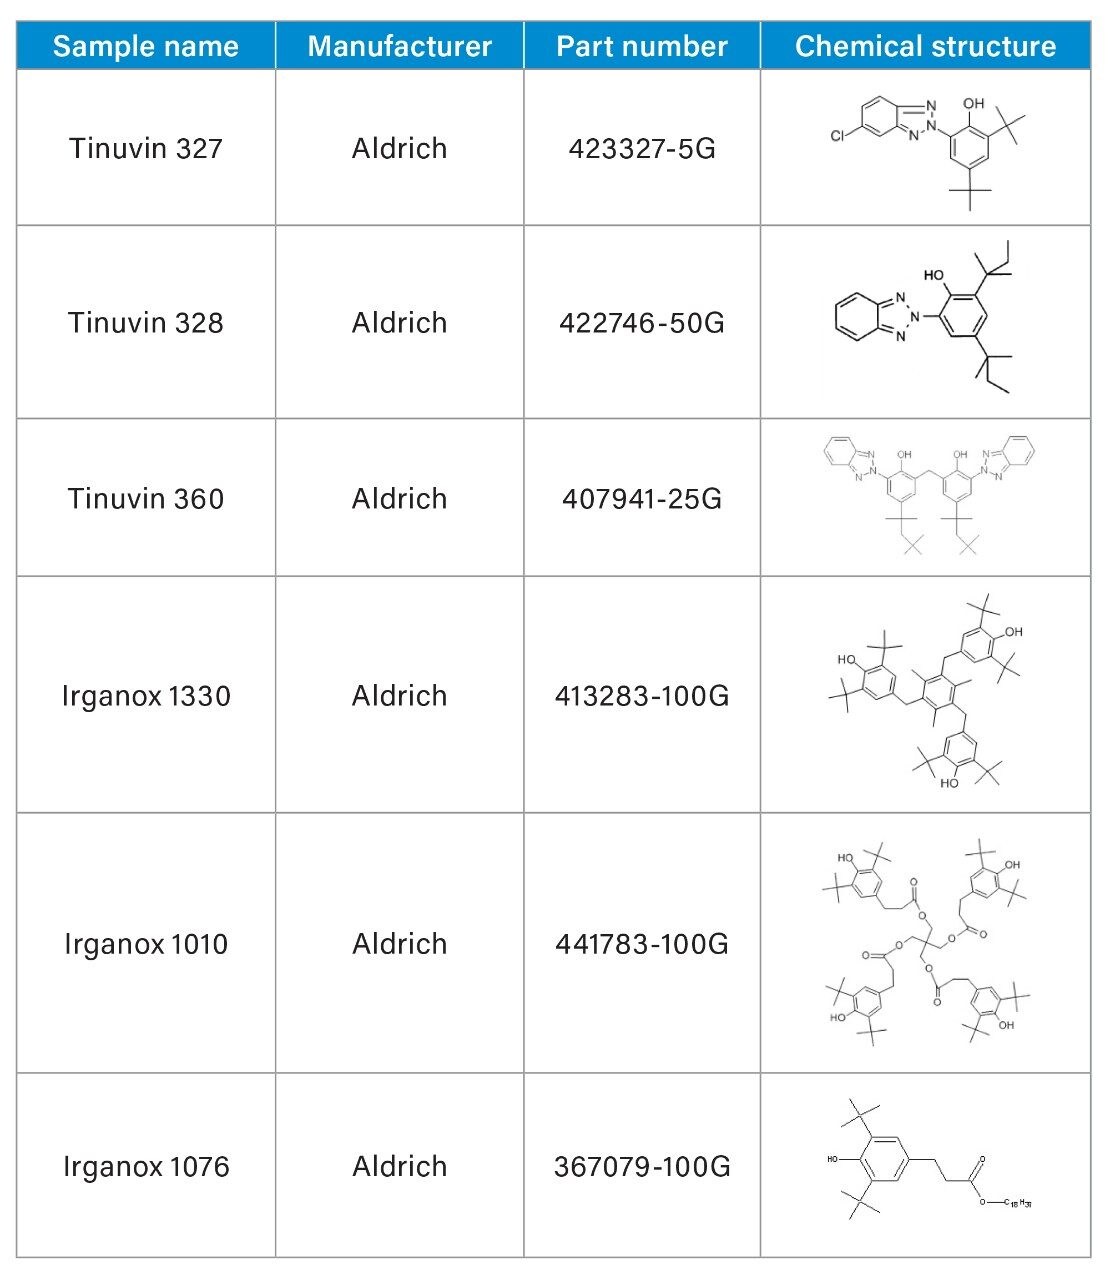 Table 1. Polymer Additive Samples.
Experiment 1: LC Conditions
|
LC system: |
ACQUITY APC System with p-QSM |
|
Detection: |
ACQUITY ELSD with Hexane/THF kit |
|
Column(s): |
XBridge C18 5 µm, 4.6 x 150 mm (p/n: 186003116) |
|
Column temp.: |
25 °C |
|
Sample temp.: |
20 °C |
|
Injection volume: |
14 µL |
|
Flow rate: |
0.68 mL/min |
|
Mobile phase A: |
THF (unstabilized) |
|
Mobile phase B: |
Water (deionized) |
|
Needle wash solvent: |
50/50, v/v, THF/water |
|
Seal wash solvent: |
Isopropanol |
|
ELS nebulizer temp.: |
Cooling |
|
ELS drift tube temp.: |
60 °C |
|
ELS gain: |
500 |
|
ELS gas flow: |
60 psi |
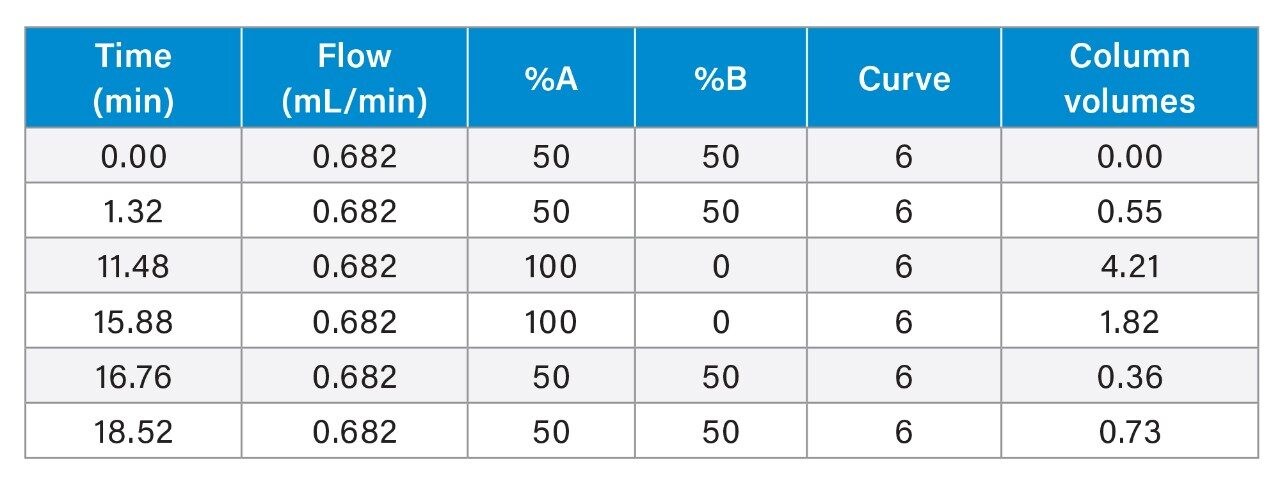
Gradient Table 1
After the first experiment was completed with the 5 µm column, the column calculator tool was used to calculate the parameters for the 2.5 µm column experiment (Figure 1).
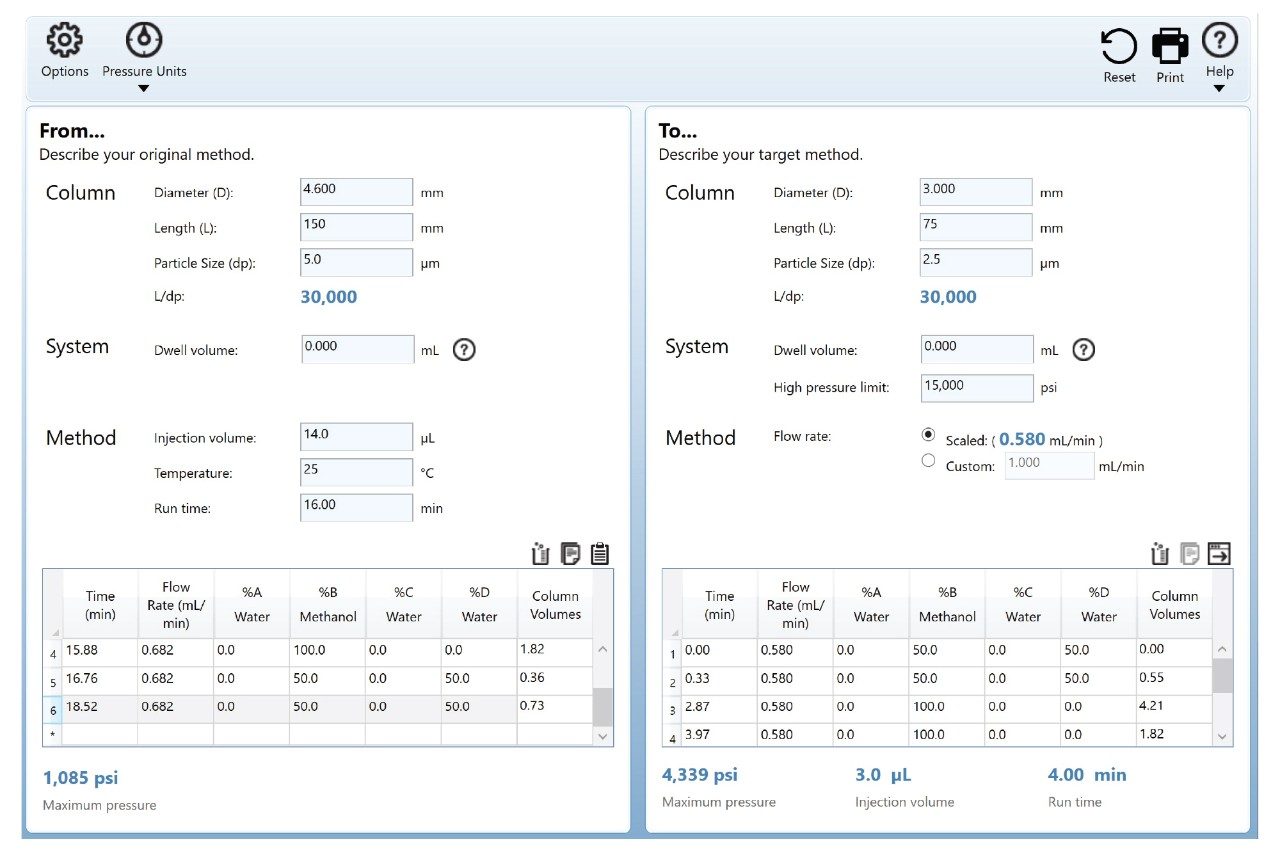 Figure 1. Columns calculator tool for converting the 5 µm column method to the 2.5 µm column method.
Experiment 2: LC Conditions
|
LC system: |
ACQUITY APC System with p-QSM |
|
Detection: |
ACQUITY ELSD with Hexane/THF kit |
|
Column(s): |
XBridge C18 2.5 µm, 3.0 x 75 mm (p/n: 186006034) |
|
Column temp.: |
25 °C |
|
Sample temp.: |
20 °C |
|
Injection volume: |
3 µL |
|
Flow rate: |
0.58 mL/min |
|
Mobile phase A: |
THF (unstabilized) |
|
Mobile phase B: |
Water (deionized) |
|
Needle wash solvent: |
50/50, v/v, THF/water |
|
Seal wash solvent: |
Isopropanol |
|
ELS nebulizer temp.: |
Cooling |
|
ELS drift tube temp.: |
60 °C |
|
ELS gain: |
500 |
|
ELS gas flow: |
60 psi |
Gradient Table 2

After the second experiment was completed with the 2.5 µm column, the column calculator tool was used to calculate the parameters for the 1.7 µm column experiment (Figure 2).
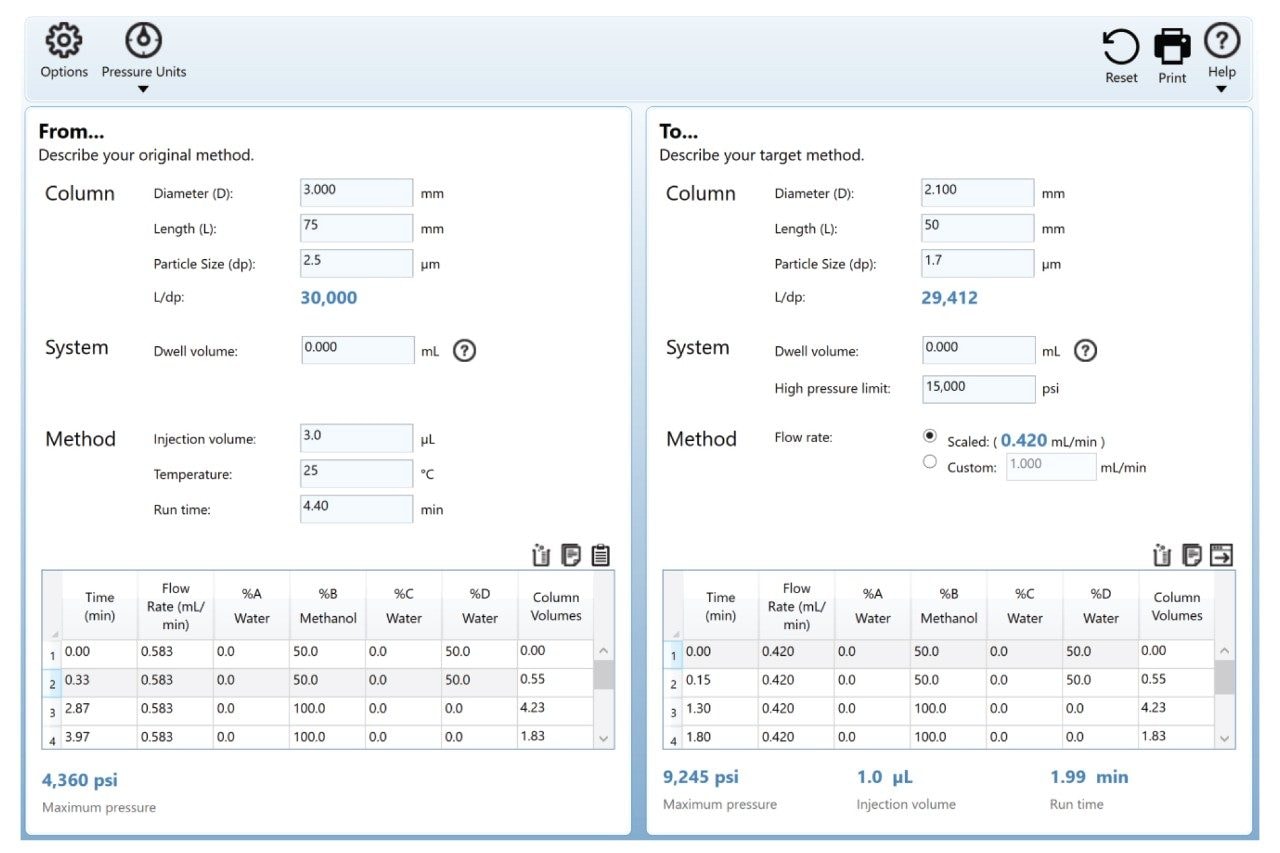 Figure 2. Columns calculator tool for converting the 2.5 µm column method to the 1.7 µm column method.
Experiment 3: LC Conditions
|
LC system: |
ACQUITY APC System with p-QSM |
|
Detection: |
ACQUITY ELSD with Hexane/THF kit |
|
Column(s): |
XBridge C18 1.7 µm, 2.1 x 50 mm (p/n: 186002350) |
|
Column temp.: |
25 °C |
|
Sample temp.: |
20 °C |
|
Injection volume: |
1 µL |
|
Flow rate: |
0.42 mL/min |
|
Mobile phase A: |
THF (unstabilized) |
|
Mobile phase B: |
Water (deionized) |
|
Needle wash solvent: |
50/50, v/v, THF/water |
|
Seal wash solvent: |
Isopropanol |
|
ELS nebulizer temp.: |
Cooling |
|
ELS drift tube temp.: |
60 °C |
|
ELS gain: |
500 |
|
ELS gas flow: |
60 psi |
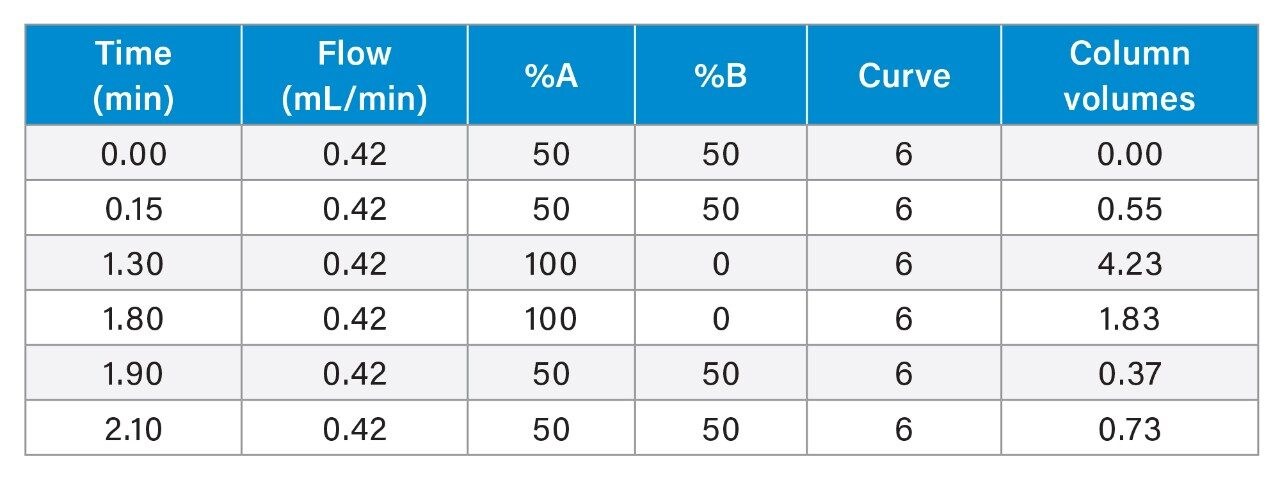
Gradient Table 3
Data Management
The data management system used to control the ACQUITY APC System and to process the data was Empower Chromatography Data System (CDS) 3, FR 5. The chromatograms and peak quality table provided in the results and discussion section of this document were created in Empower CDS without the use of a 3rd party software.
Results and Discussion
The chromatograms from experiments 1, 2, and 3 are below in images 3, 4, and 5. The resolution for acceptable chromatography should be greater than 1, and the Empower CDS generated table under each chromatogram represents the quality of the data.11 The first peak to elute in a reverse phase method is usually the marker peak, and the data from the maker peak is not used for many of the peak quality calculations. A marker peak is not used in this experiment. Therefore, the table spaces under Tinuvin 328 heading are blank.
Figure 3 displays the separation of the mixture of six polymer additives for experiment 1 in under twelve minutes, and the resolution values for six separate injections of the mixture is in Table 2. Note the separation of Tinuvin 328 and Tinuvin 327 are baseline resolved, as well as the separation of Irganox 1010 and Irganox 1076.
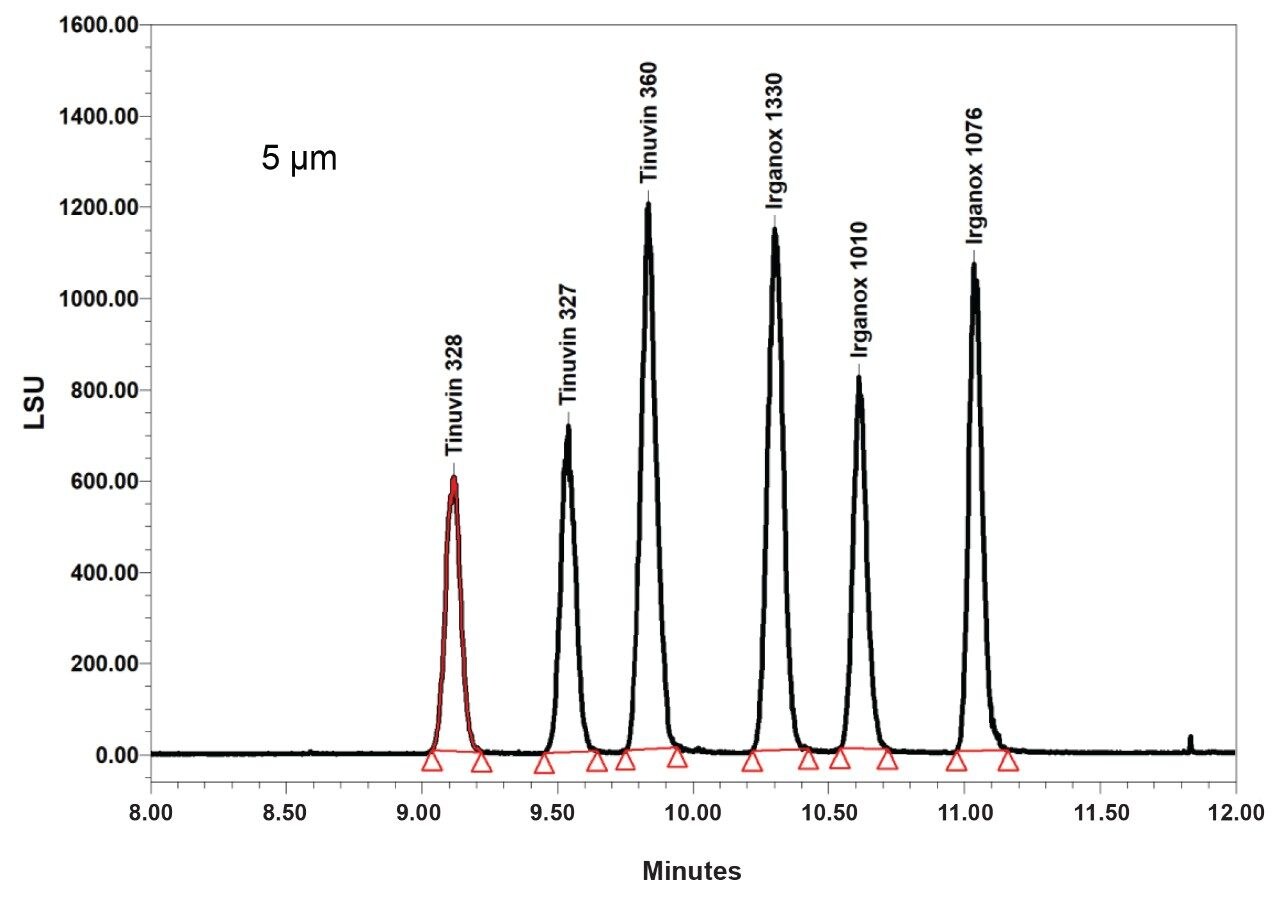 Figure 3. Chromatogram from HPLC experiment 1.
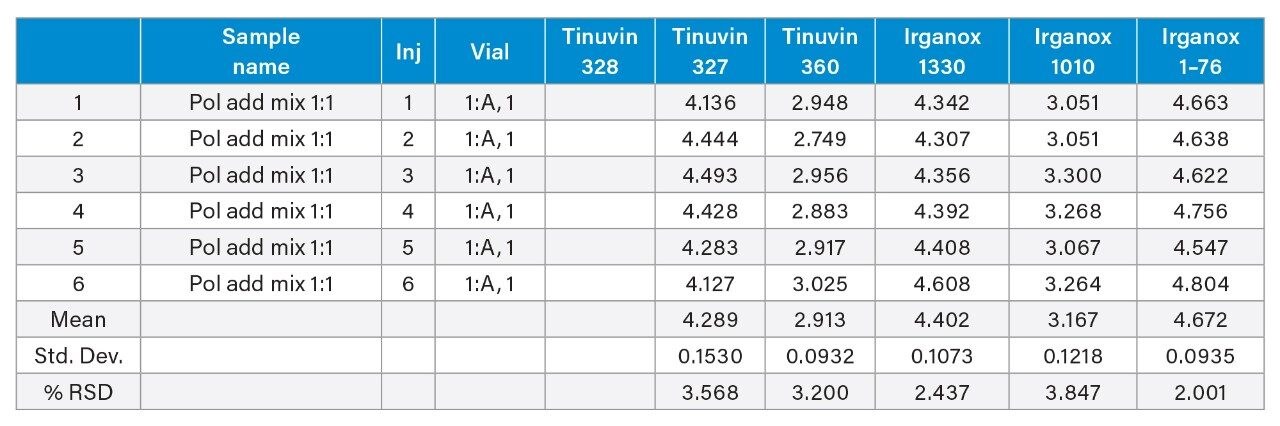 Table 2. Empower Peak resolution table for experiment 1.
Figure 4 displays the separation of the mixture of six polymer additives for experiment 2 in under six minutes, and the resolution values for six separate injections of the mixture is in Table 3. Note the separation of Tinuvin 328 and Tinuvin 327 are baseline resolved, as well as the separation of Irganox 1010 and Irganox 1076.
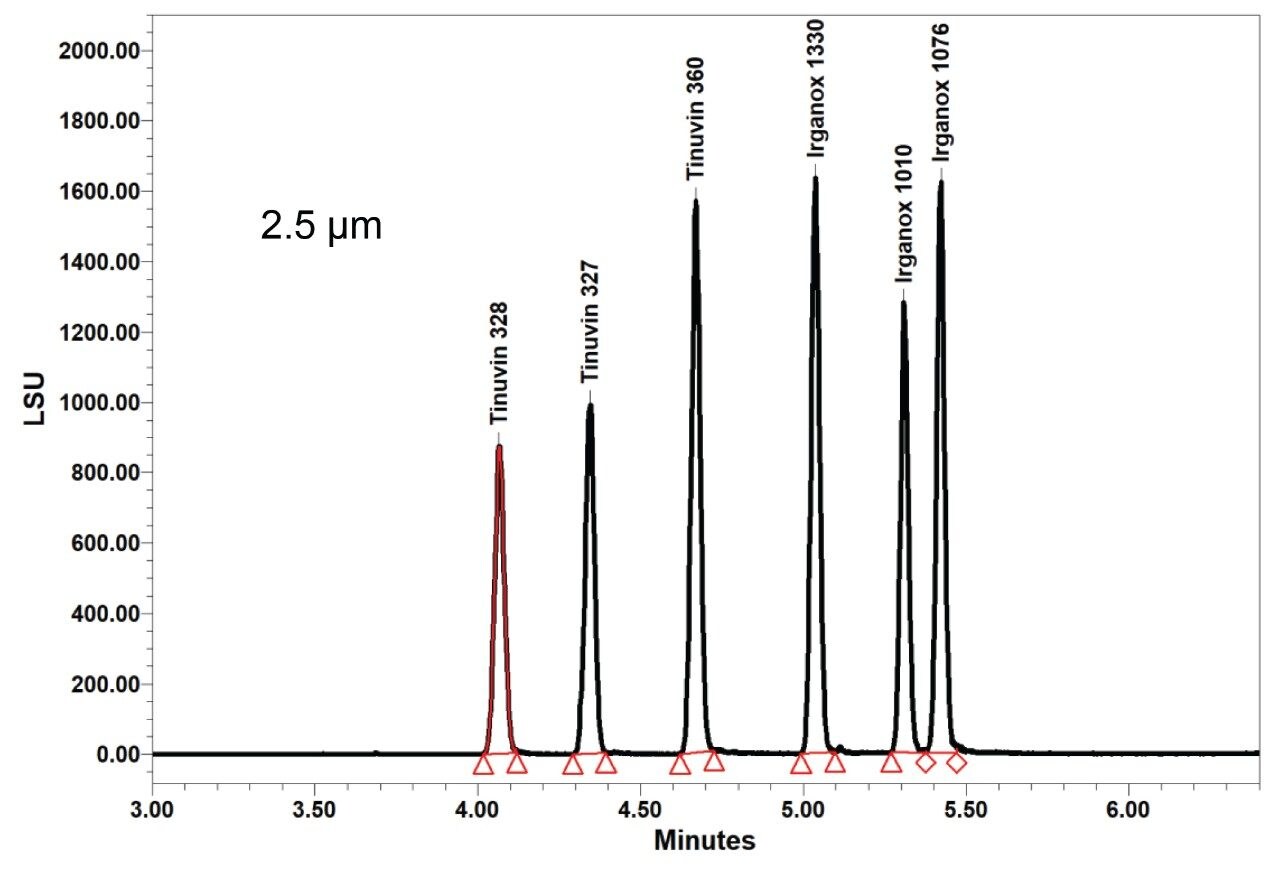 Figure 4. Chromatogram from UHPLC experiment 2.
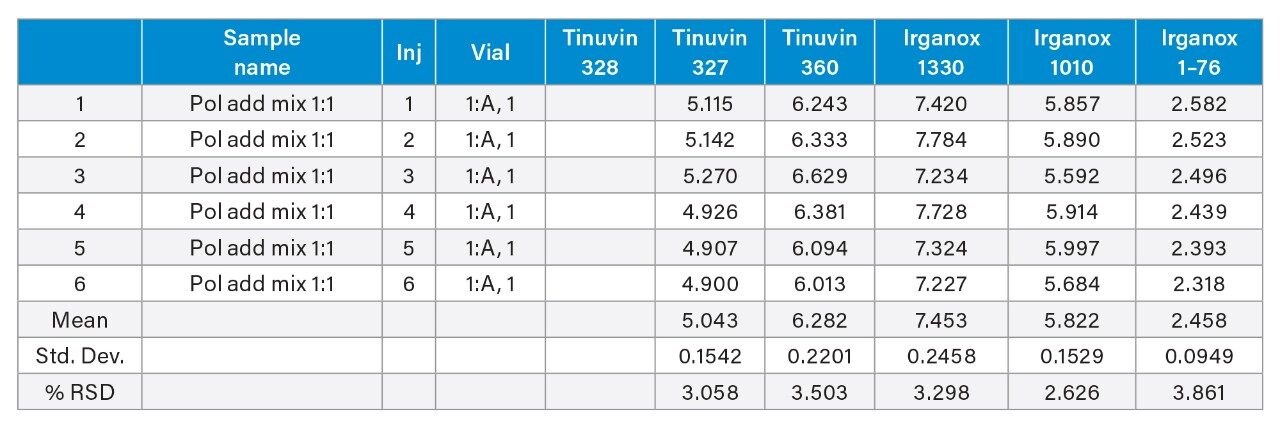 Table 3. Empower peak resolution table for experiment 2.
Figure 5 displays the separation of the mixture of six polymer additives for experiment 3 in under three minutes, and the resolution values for six separate injections of the mixture is in Table 4. Note the separation of Tinuvin 328 and Tinuvin 327 are baseline resolved, and they are integrated with peak resolution values greater than one which is the accepted criteria for quality chromatographic resolution. Although the separation of Irganox 1010 and Irganox 1076 is not baseline resolved, each peak resolution exceeds accepted criteria.
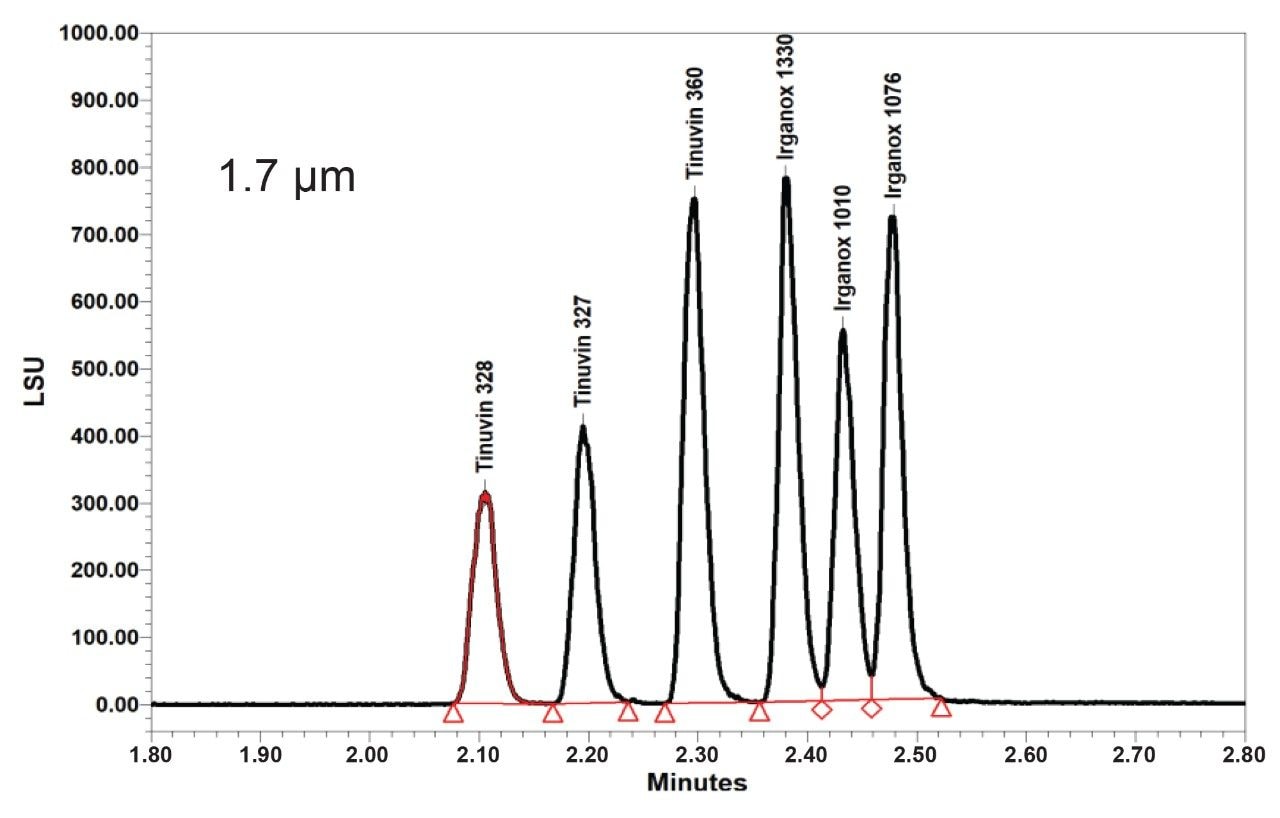 Figure 5. Chromatogram from UPLC experiment 3.
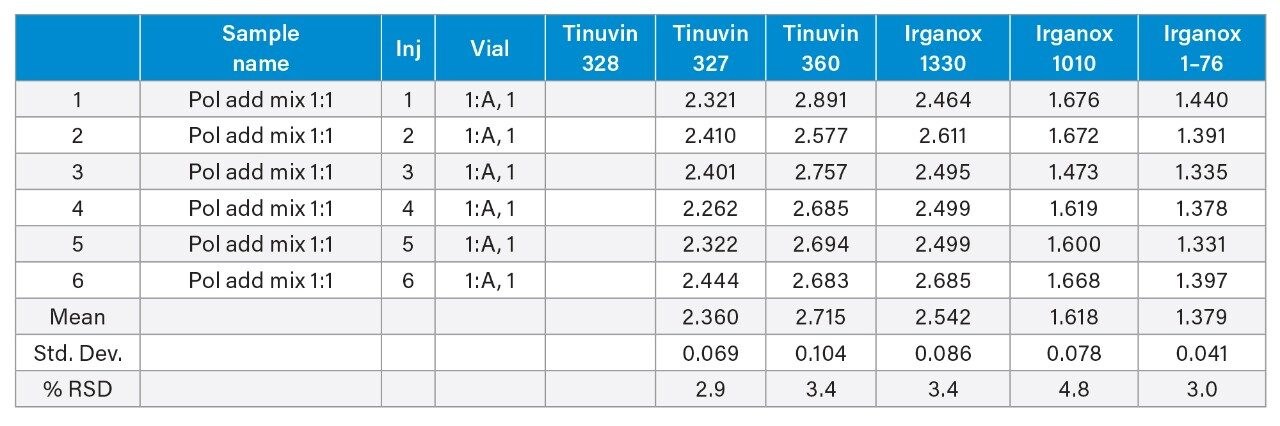 Table 4. Empower peak resolution table for experiment 3.
Conclusion
The separation of a six-polymer additive blend was successfully developed from a 19-minute HPLC run time to a 3-minute UPLC run time increasing the number of injections per hour by a factor of five. The ACQUITY APC System with a p-QSM, ELSD, and ACQUITY BEH C18 Column Technology enabled the gradient use of tetrahydrofuran as a mobile phase due to the robust system, detector, and column particles. The ability to develop the legacy HPLC method using a 5 µm particle column into a 1.7 µm column method was intuitively accomplished by using the column calculator software tool and a family of columns designed for a variety of LC separation methods.
References
- Michael Jones, Jennifer Gough, Marian Twohig. Comparison of HPLC and UHPLC Analysis of Polymer Additives with Elucidation of Mass Detection, Waters Posters, 2017. https://www.waters.com/waters/library.htm?locale=101&lid=134956804&cid=511436.
- Claudia Lohmann, Damian Morrison, Jennifer Gough. Polymer Additive Analysis Study Using Tetrahydrofuran and Advanced Polymer Chromatography and Gradient Elution, Waters Apllication note 720006707EN, 2019.
- Waters ACQUITY UPLC ELS Detector, https://www.waters.com/waters/en_US/ACQUITY-UPLC-ELSD/nav.htm?locale=en_US&cid=514219.
- ACQUITY UPLC Evaporative Light Scattering Detector Getting Started Guide, https://www.waters.com/webassets/cms/support/docs/71500109303rd.pdf.
- Tolinski, M. Additives for Polyolefins: Getting the Most Out of Polypropylene, Polyethylene, and TPO, 2nd ed.; William Andrew: Oxford, 2015.
- Bolgar, Michael; Hubball, Jack; Groeger, Joseph; Meronek, Susan; Handbook for the Chemical Analysis of Plastic and Polymer Additives, CRC Press, Boca Raton, U.S.A., 2016.
- Beginners Guide to UPLC, Waters Corp. U.S.A., https://www.waters.com/waters/en_US/UPLC---Ultra-Performance-Liquid-Chromatography-Beginner%27s-Guide/nav.htm?cid=134803622&locale=en_US#:~:text=Introduction,and%20sensitivity%20in%20liquid%20chromatography.
- ACQUITY APC p-QSM System, Waters Specification Sheet, 720006702EN.
- BEH (Bridged Ethylene Hybrid) Technology, Waters Corp. U.S.A., https://www.waters.com/waters/en_US/BEH-(Ethylene-Bridged-Hybrid)-Technology/nav.htm?cid=134618172&locale=en_US.
- Waters On-Line Tool Box, “Column Calculator Tool”, https://www.waters.com/waters/promotionDetail.htm?id=134694974&locale=101.
- Chromatography Fundamentals, Part VIII: The Meaning and Significance of Chromatographic Resolution, https://www.chromatographyonline.com/view/chromatography-fundamentals-part-viii-meaning-and-significance-chromatographic-resolution.
720007432, November 2021