Determination of Regulated and Emerging Mycotoxins in Cereals, Nuts, Figs, and Animal Feeds Using Pass-Through SPE and UPLC-MS/MS
Abstract
Mycotoxins can occur naturally in a variety of food products via pre- and post-harvest contamination mechanisms and are regulated worldwide. Herein we describe a multi-toxin method for 31 regulated and emerging mycotoxins using a quick and simple pass-through SPE clean-up prior to LC-MS/MS analysis for cereal-based products, ground- and tree-nuts, dried figs, and animal feeds.
The method has been developed to maximize recovery and enhance easy-of-use. The performance of the method has been validated using spiked samples and verified using reference materials, where available.
The method provides very good performance in terms of trueness and repeatability, with method LOQs as low as 0.25 µg/kg for aflatoxins and 1.0 µg/kg for ochratoxin A.
The use of Oasis PRiME HLB SPE clean-up is particularly advantageous as it involves a simple and quick pass-through protocol, thus eliminating the SPE conditioning, equilibration, and washing steps. Recoveries were excellent for all analytes (in the range 60–108%) which proves the wide scope of the clean-up protocol. This is important as it allows to expand the method to a wider range of compounds if needed.
Benefits
- Single multi-mycotoxin method for a wide range of complex matrices
- Removal of major co-extractives using pass-through SPE clean-up
- Good method performance fulfilling regulatory requirements for all tested mycotoxins
- Possibility to scale-up the method to a wider number of analytes and different food and feed matrices
Introduction
Mycotoxins are secondary metabolites of fungi poisonous for humans or animals which can be found on a great variety of food and feed commodities. The most common mycotoxins are regulated in many countries of the world after thorough risk assessment, considering toxicity, occurrence, and consumption data as well as economic and political considerations. Regulations typically include values that are specified in various food and feed commodities, which are either maximum allowed levels or guidance values. The applied regulatory levels and standards of mycotoxins vary in the different regions of the world.1 The maximum levels for mycotoxins in food are very low due to their severe toxicity. Furthermore, the legislation frameworks are expected to evolve in the following years; maximum levels will be updated and more emerging mycotoxins, including deoxynivalenol modified forms, enniatins, and Alternaria toxins, are expected to be included into future legislation.
In the present work, we describe the performance of a simple and quick sample preparation protocol and LC-MS/MS analytical method for 31 regulated and emerging mycotoxins in three different food types (cereals, nuts, figs) and animal feeds. The Oasis PRiME HLB is a pass-through solid-phase extraction (SPE) cartridge, which was applied to remove some major interferences, hence improving method robustness.2 The Hydrophilic-Lipophilic Balance copolymer (HLB) does not require any solvation, equilibration or conditioning step, thus saving time and solvent expenses.
Experimental
Sample Description and Pre-treatment
Wheat flour, peanuts, figs, and animal feeds (mix of pet feeds) were purchased at a local market. About 200 g of each food commodity were ground and homogenized using an analytical mill (IKA) prior to extraction. Reference materials, including maize flour, hazelnuts (water/nuts slurry), dried figs (water/fruit slurry), and animal feeds (cattle) were purchased from Fera Science Ltd (FAPAS).
Sample Extraction and Clean-up
The sample preparation protocol was consistent to all matrices and is illustrated in Figure 1.
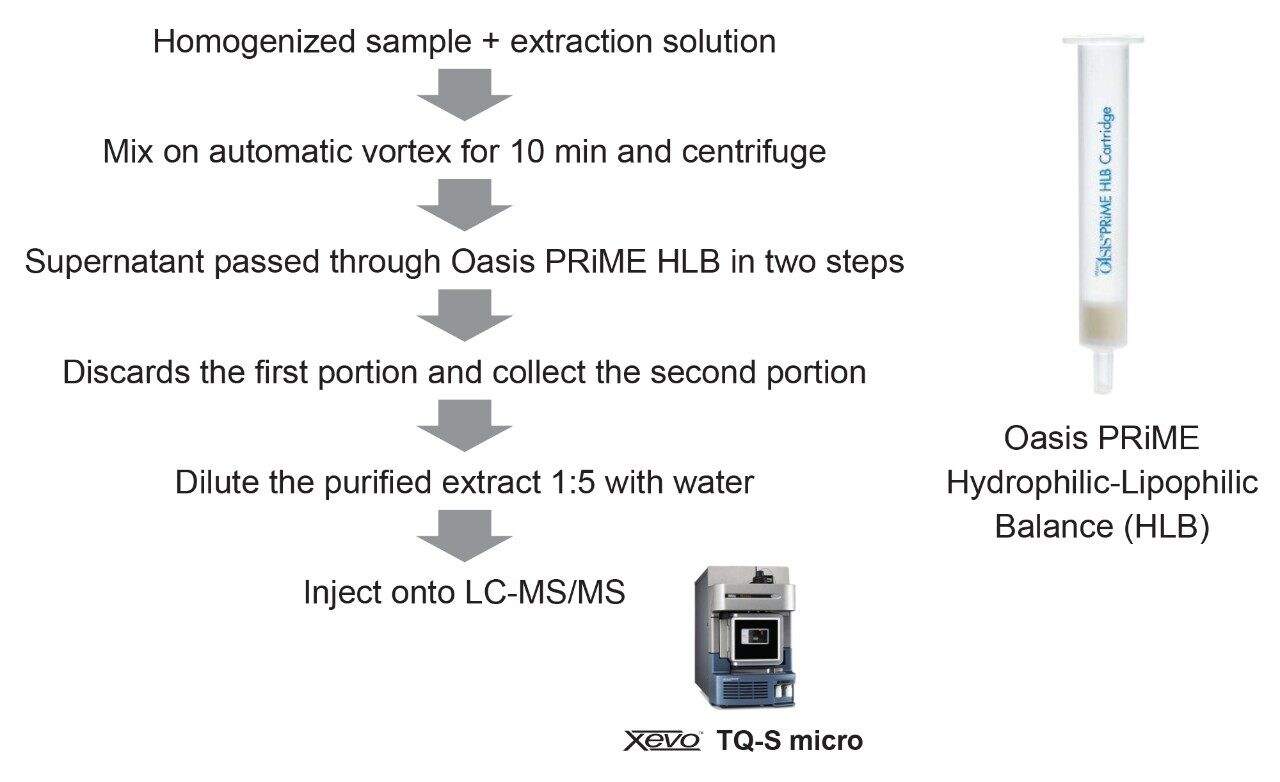
A portion of homogenized representative sample (5 g) was placed in a 50-mL plastic centrifuge tube. The sample was extracted with 20 mL of 80:20 MeCN:H2O containing 0.5% of acetic acid and 0.2% of formic acid (v/v) for 10 min on vortex. After centrifugation at >5000 g, a first portion of the supernatant (0.4 mL) was loaded onto the Oasis PRiME HLB cartridge (3 cc, 150 mg, p/n 186008717) and discarded by drying the cartridge bed (i.e. pumping 3 mL of air through the cartridge). A second portion of the supernatant (1.2 mL) was loaded and collected. The purified extract was then diluted 1:5 with water directly into a LC vial for LC-MS/MS analysis (i.e. 200 µL of purified extract were mixed with 800 µL of H2O), resulting in an overall dilution factor of 20. After dilution, extracts were filtered through 13 mm I.D., 1.2 µm glass fiber syringe filter. Matrix-matched standards were used for quantification.
LC-MS/MS Conditions
|
Chromatographic system: |
ACQUITY UPLC I-Class PLUS System |
|
Autosampler and injector: |
Flow-Through Needle injector (FTN) with 15-µL needle size and 50-µL extension loop (p/n: 430002012) installed between port 4 of injection valve and APH |
|
Column: |
ACQUITY UPLC BEH C18 (2.1 × 100 mm, 1.7 µm particle size, 130 Å pore size, p/n: 186002352) |
|
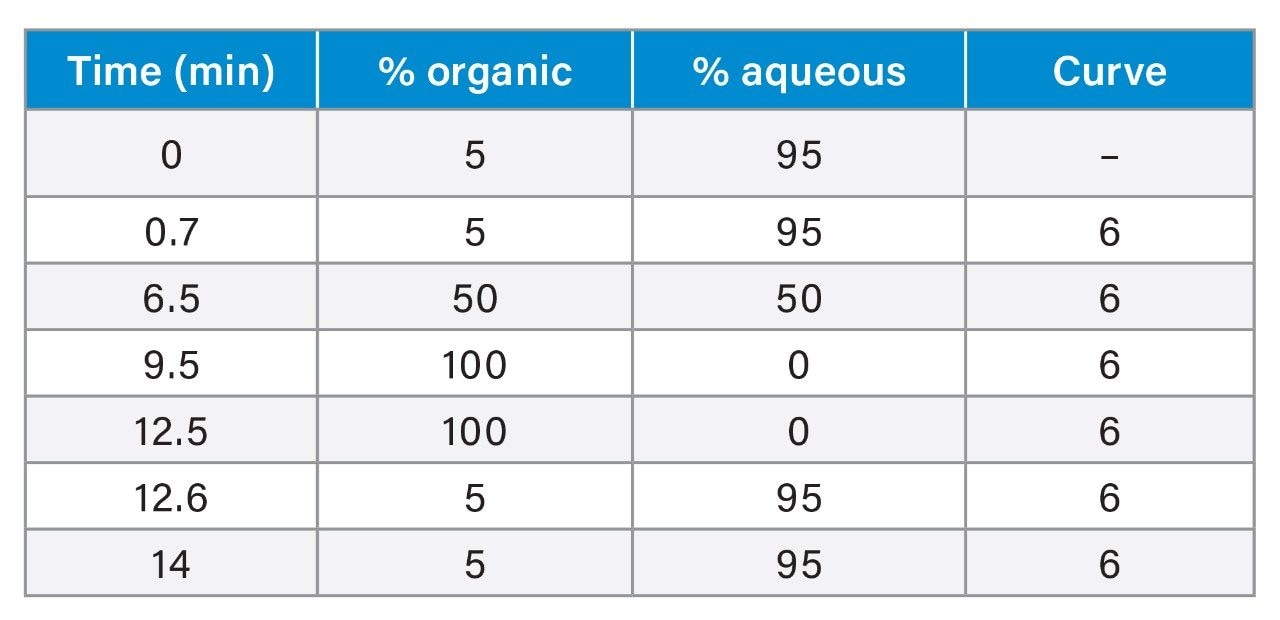
Aqueous mobile phase: |
1 mM ammonium acetate in water +0.5% acetic acid +0.1% formic acid (v/v) |
|
Organic mobile phase: |
methanol + 0.5% acetic acid + 0.1% formic acid |
|
Needle wash solvent: |
Water:methanol:acetonitrile:isopropanol:acetone 20:20:20:20:20 + 1% formic acid (volumetrically) |
|
Seal wash solvent: |
Water:acetonitrile 80:20 (v/v) |
|
Column temperature: |
40 °C |
|
Sample temperature: |
15 °C |
|
Injection volume: |
8 µL |
|
Flow rate: |
0.40 mL/min |
|
Mass spectrometry system: |
Xevo TQ-S micro |
|
Ionization mode: |
ESI+/- (polarity switching) |
|
Acquisition mode: |
Multiple Reaction Monitoring (MRM) |
|
Capillary voltage: |
+0.75/-0.3 kV |
|
Cone gas flow: |
50 L/Hr |
|
Desolvation temperature: |
600 °C |
|
Desolvation gas flow: |
1100 L/Hr |
|
Source temperature: |
150 °C |
|
Resolution: |
MS1 Unit, MS2 Unit |
|
Software: |
MassLynx v4.2 (TargetLynx XS was used for data processing) |
Method Validation
Validation of the trueness (using recovery) and repeatability of the method was performed by spiking wheat flour, peanuts, figs, and animal feeds samples with a mixture of 31 mycotoxins at three concentration levels, in triplicate (concentrations are reported in Tables 4, 5, 6, and 7). Blanks and spiked samples were then extracted and analyzed as described in the previous section. According to Eurachem guidelines,3 the performance of the method was also verified by analysing six replicates of some FAPAS reference materials: maize flour, hazelnut, dried figs, and animal feed.
Results and Discussion
Chromatography
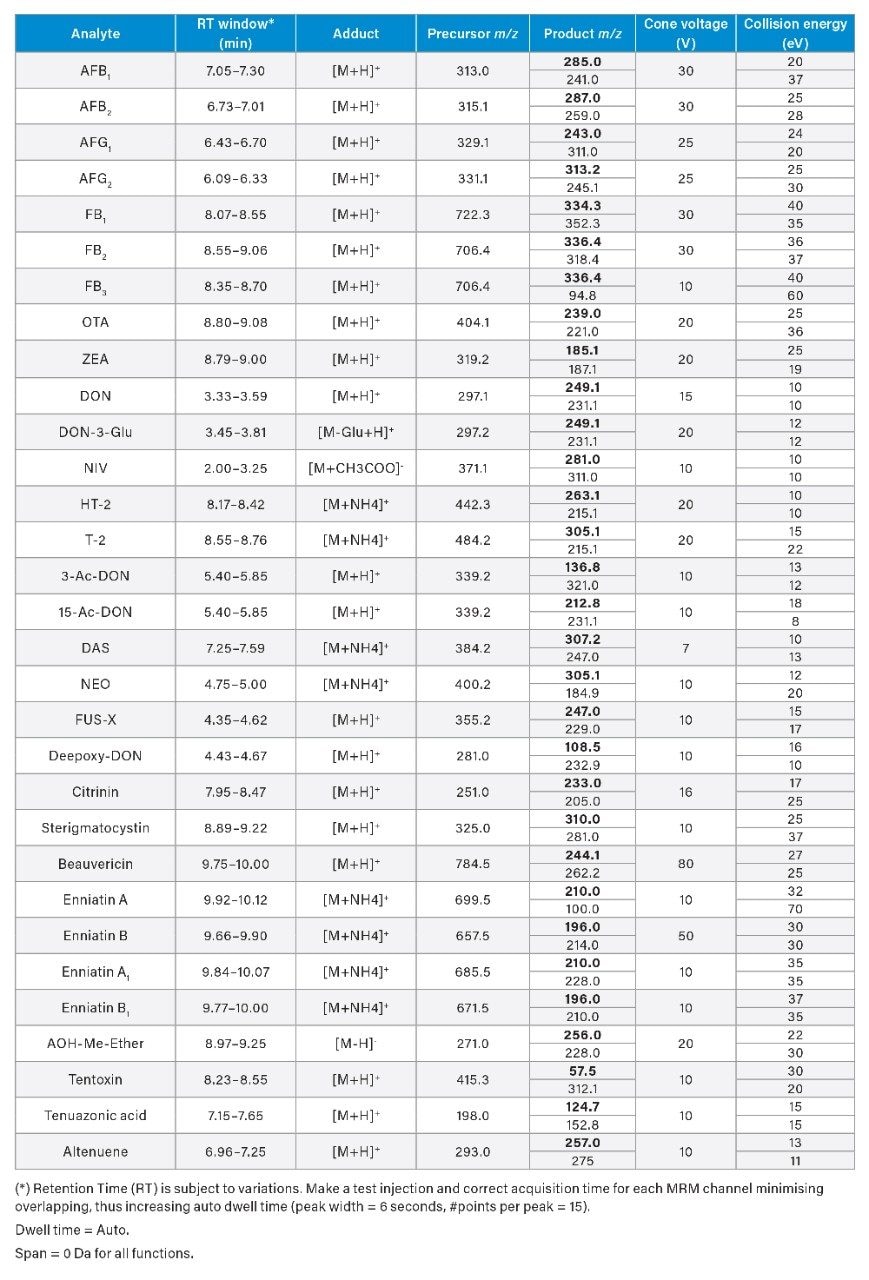
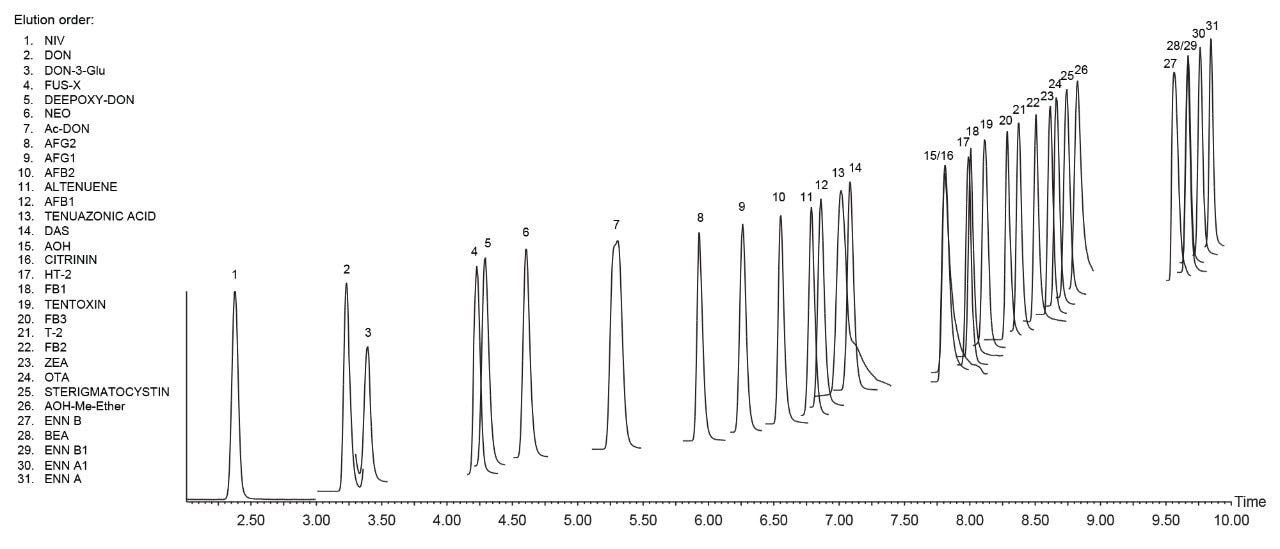
Chromatographic performance was in agreement with SANTE/12089/2016 guidelines.4 The first eluting compound (nivalenol) presented a retention time of 2.38 min, which resulted to be higher than twice the retention time corresponding to the void volume of the column, Vd (Vd ~0.55 min). A representative chromatogram of a wheat extract spiked with 31 mycotoxins is shown in Figure 2. The retention time of the analyte in the sample extract corresponded to that of the average of the calibration standards measured in the same sequence with a tolerance of ±0.05 min, in accordance with SANTE guidelines. The reproducibility of RT was greater than ±0.03 min within each sequence.
Critical pairs of compounds were:
- Deoxynivalenol (DON) and deoxynivalenol-3-Glucoside (DON-3-Glu): these compounds shared the same MRM transitions as DON-3-Glu loses the glycosyl group in the ion source and it is monitored as [DON+H]+. Baseline separation was achieved for these compounds in the present method.
- 3-Acetyl-deoxynivalenol (3-Ac-DON) and 15-acetyl-deoxynivalenol (15-Ac-DON): the isomers are usually monitored and quantified as the sum 3-Ac-DON + 15-Ac-DON as they usually partially coelute in the reverse-phase LC dimension. It is possible to separate these compounds by using a ACQUITY UPLC HSS T3 Column (2.1 x 150 mm, 1.8 µm, p/n 186003540) or by using a ACQUITY UPLC HSS PFP Column, (2.1 x 100 mm, 1.8 µm, p/n 186005967). For more information on the separation of acetyl-DON isomer, contact Waters.
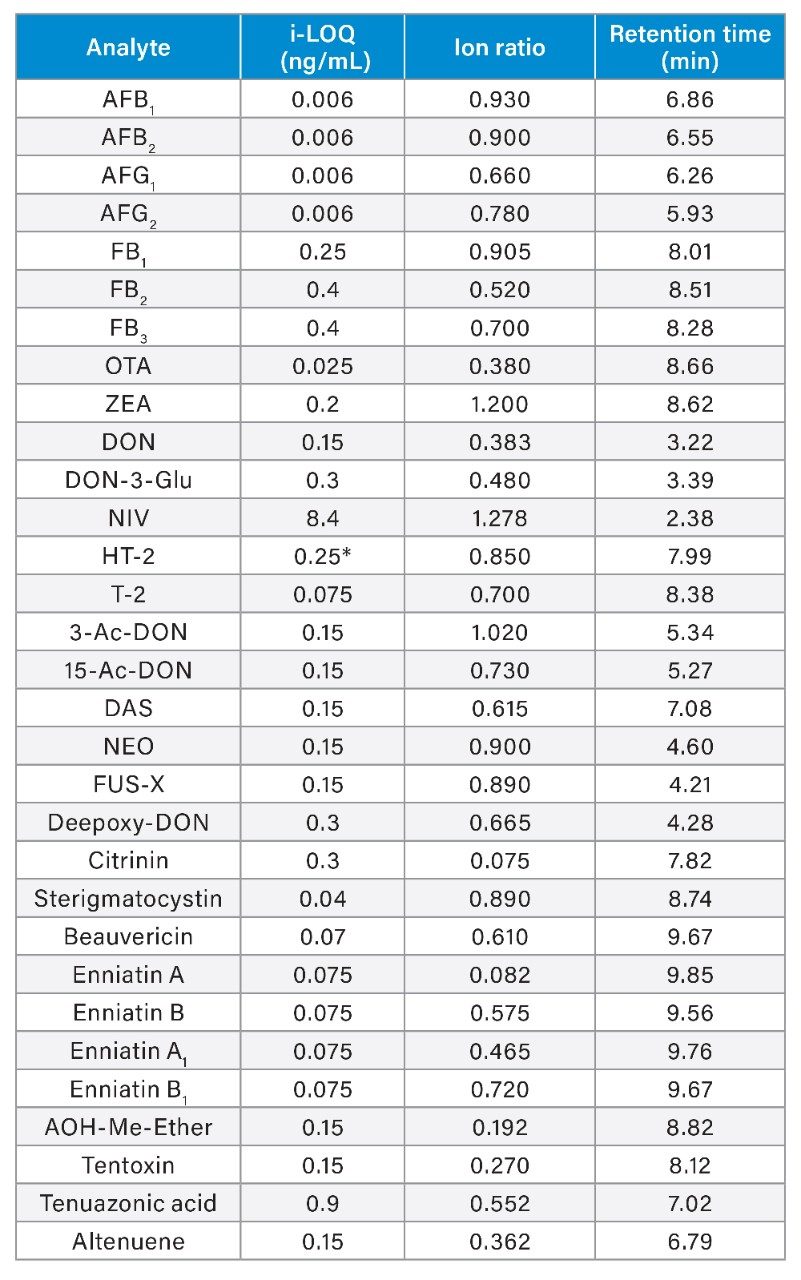
Linearity, Identification and Limits of Quantitation
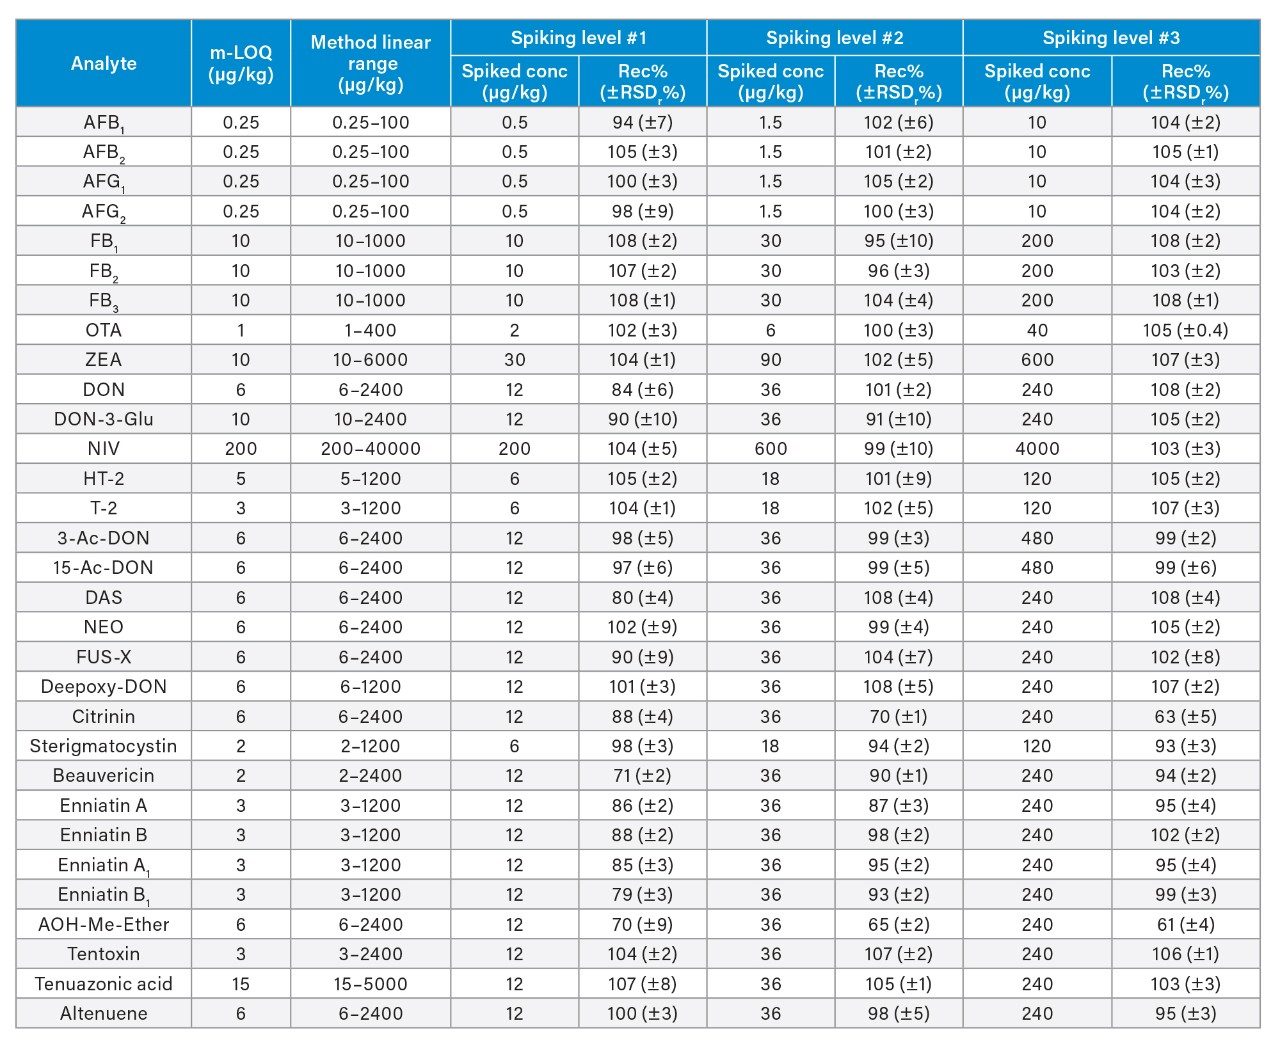
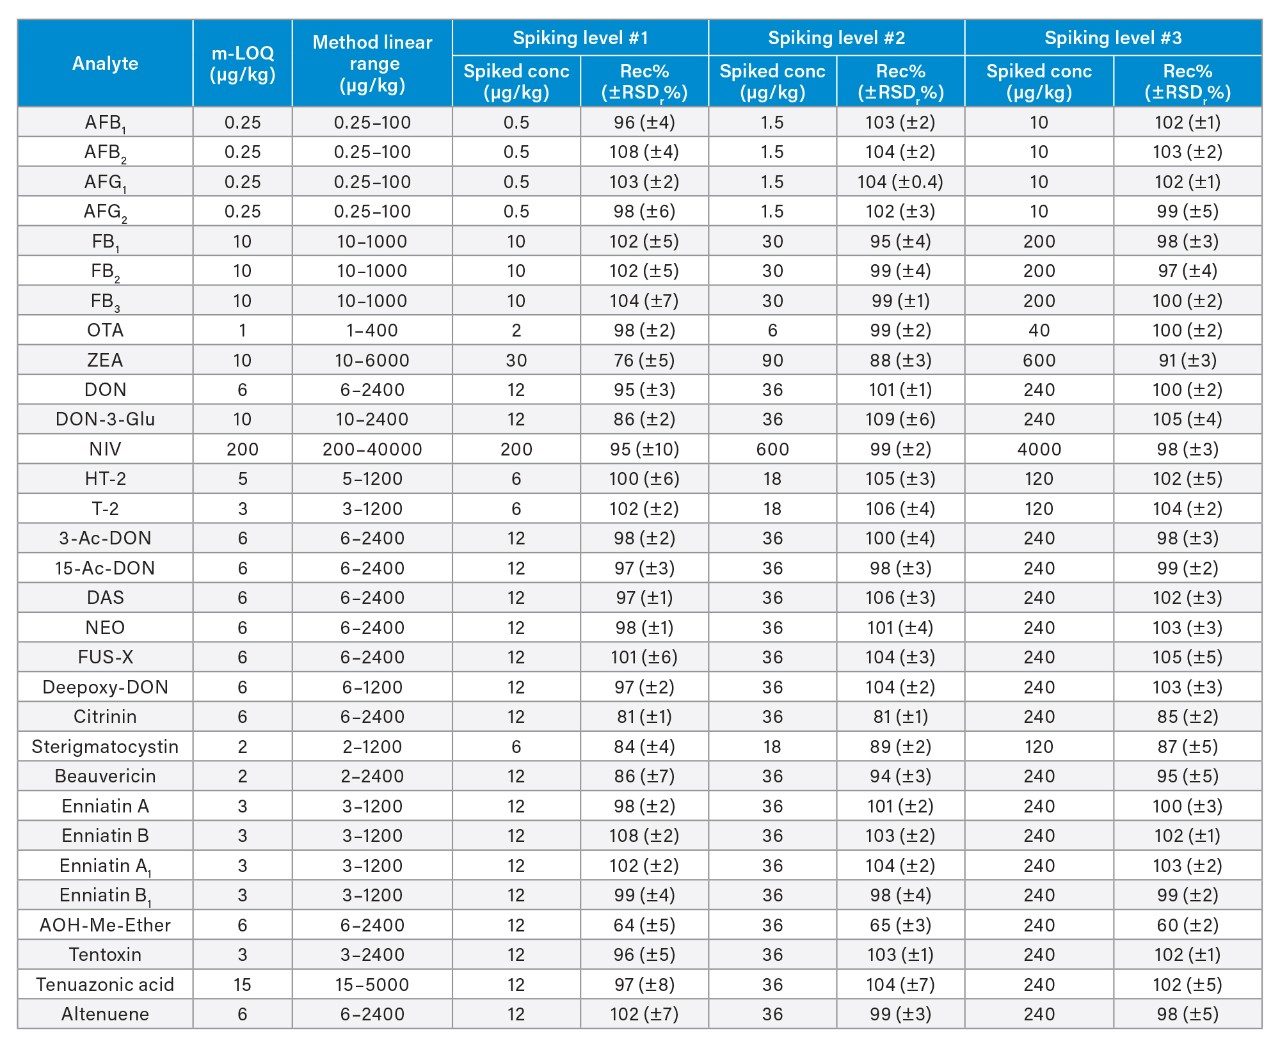
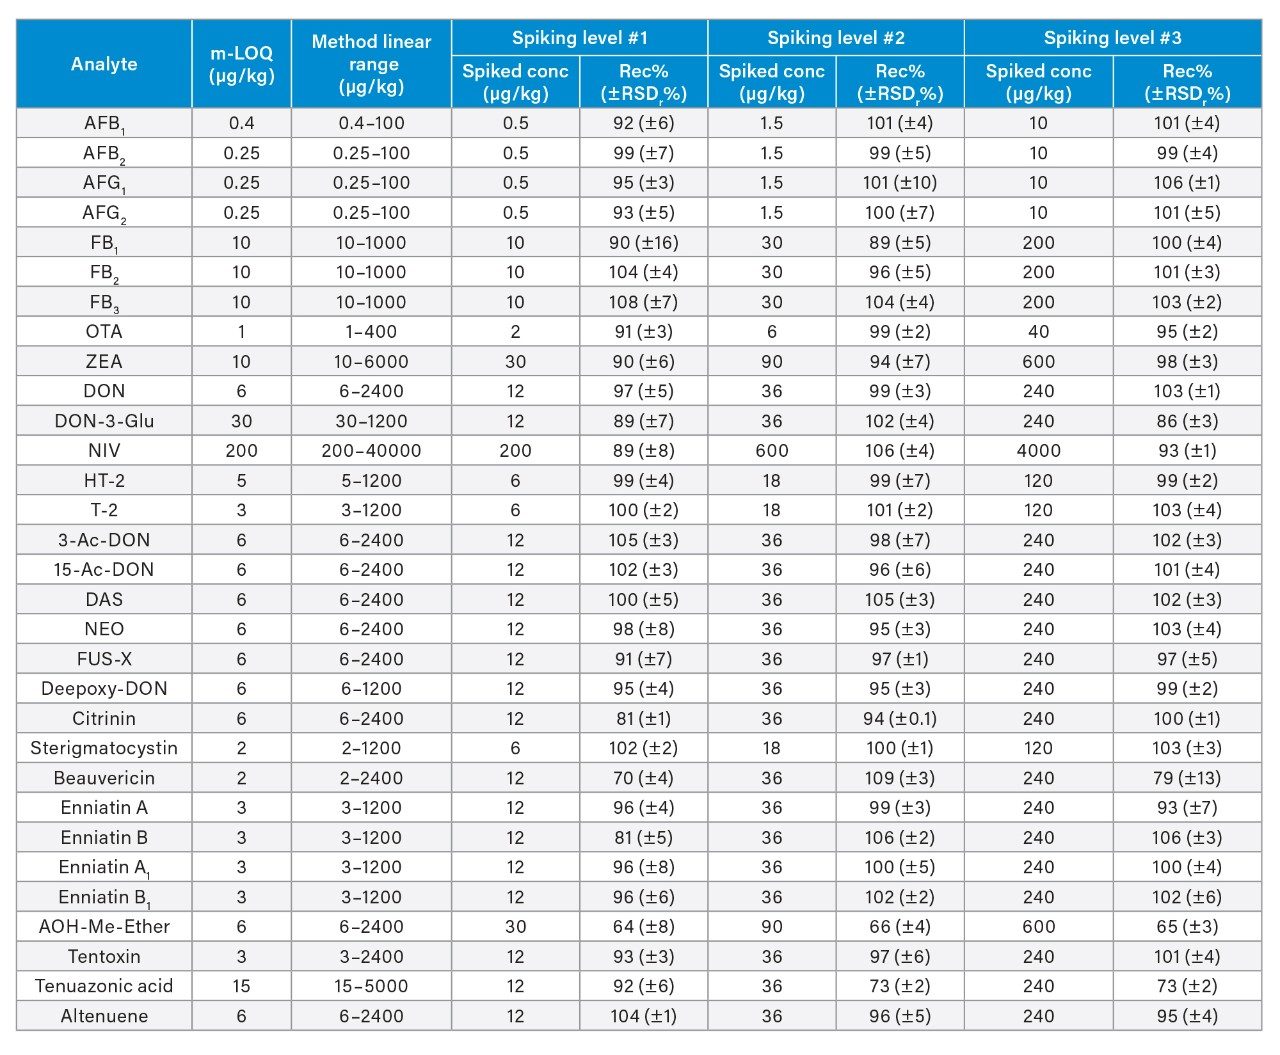
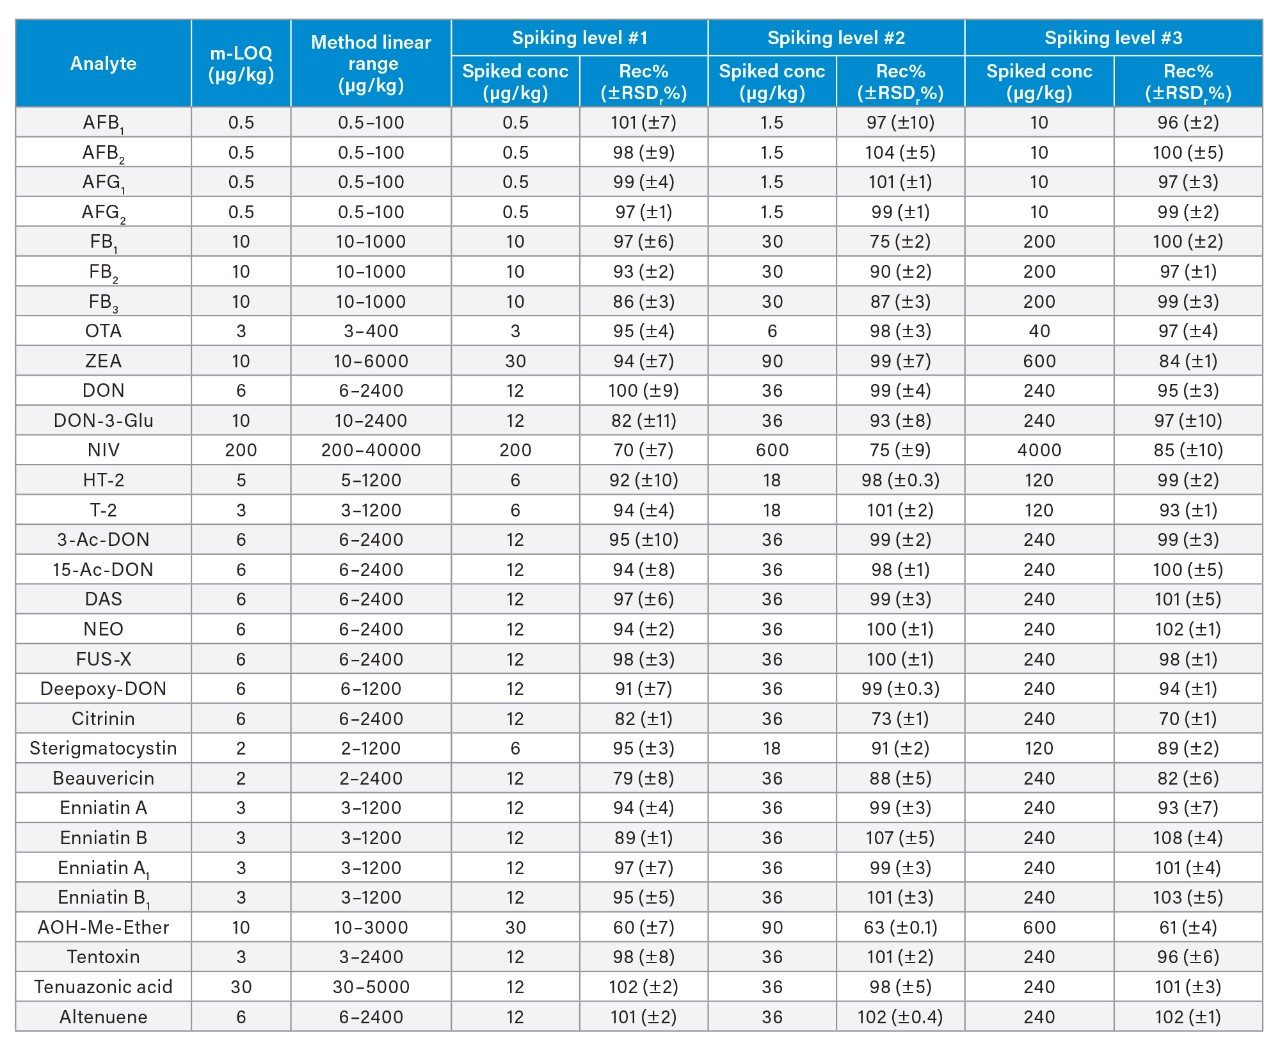
The linearity of the method was verified across the range of concentrations tested. Coefficients of determination of the calibration curves (R2) were >0.9900, and residuals were below ±20%. The ion ratios of all tested samples were within ±30% to the average ion ratios calculated on the calibration standards from the same sequence. Table 3 reports the instrument limit of quantitation (i-LOQ) calculated on solvent standards (signal-to-noise ratio ≥10 at the LOQ level). Table 4, 5, 6, and 7 show the method LOQ (m-LOQ)3 and linear range in wheat flour, peanuts, figs, and animal feeds, respectively. The linear range of the method allowed for the determination of mycotoxins at typical regulatory levels for the food commodities tested.
Trueness and Repeatability
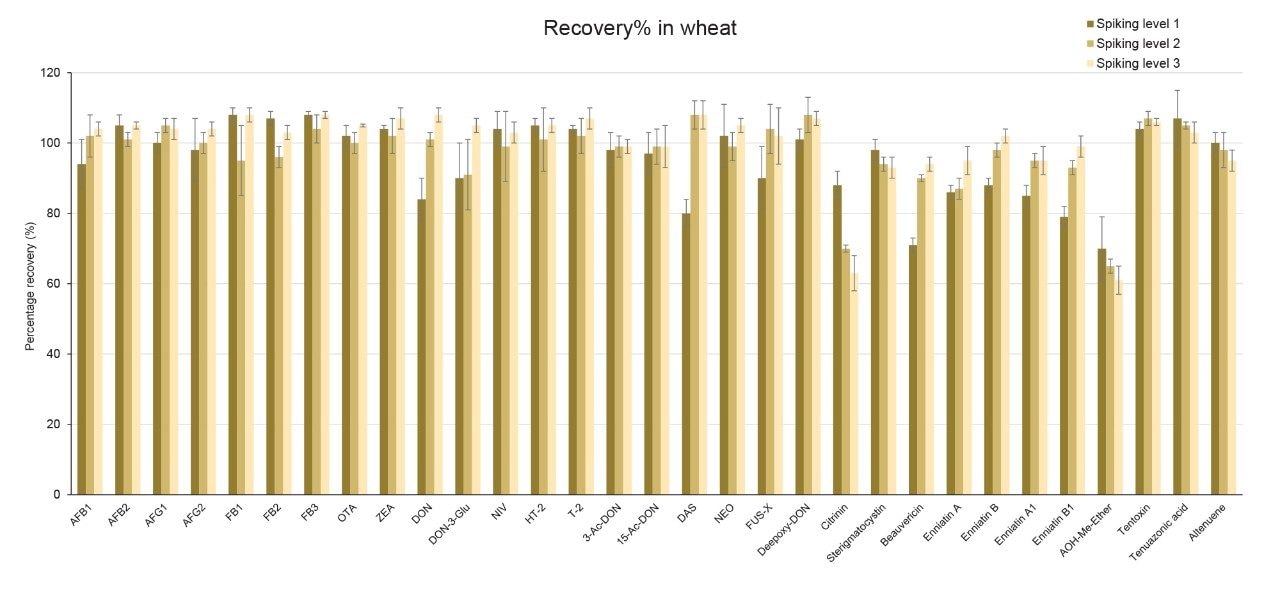
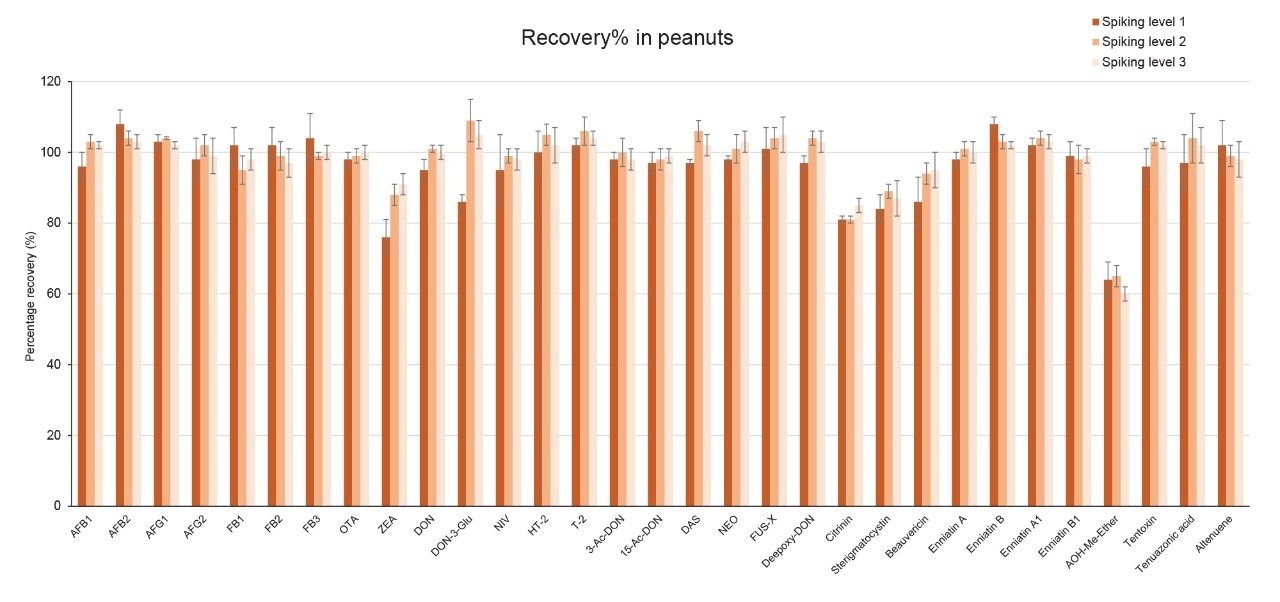
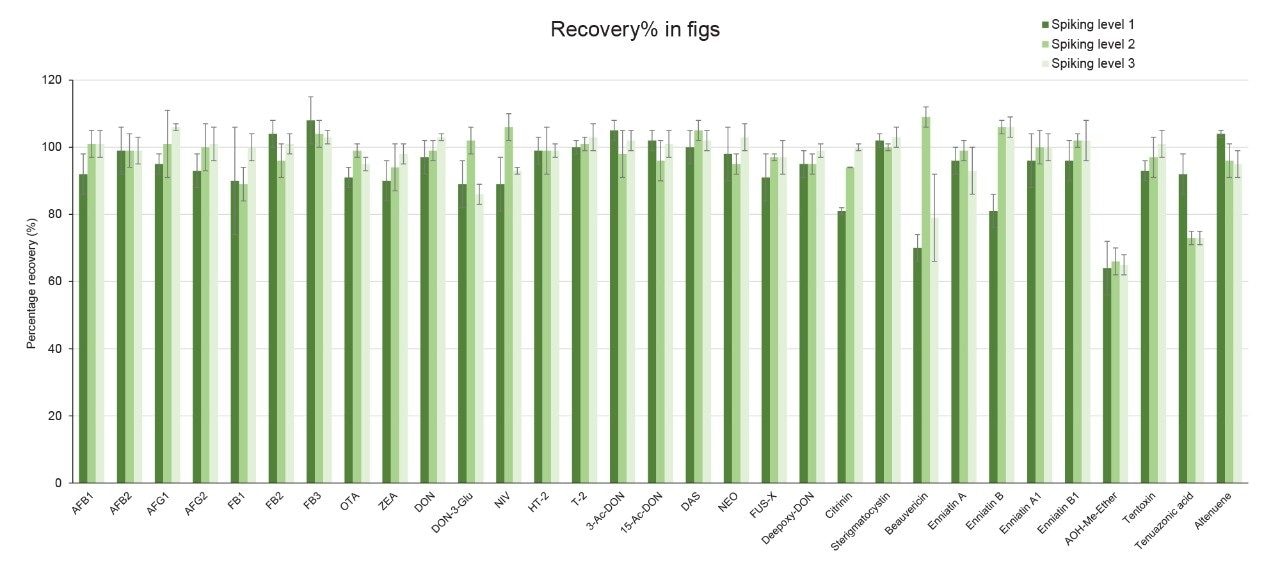
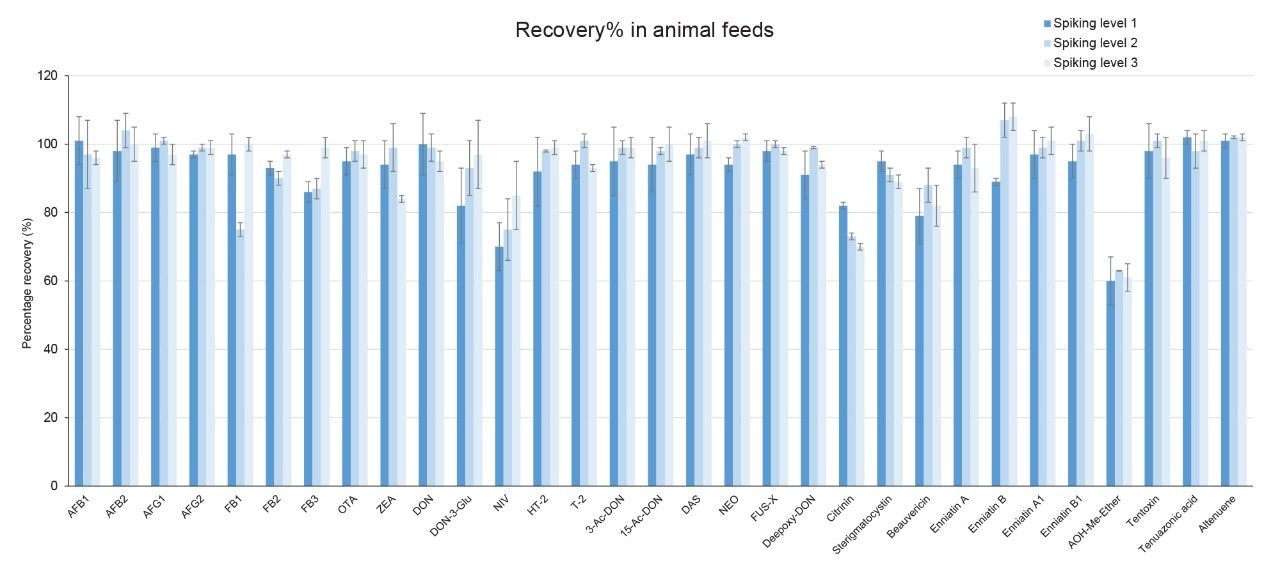
Recoveries were between 60% and 108% and the relative standard deviations under repeatability conditions (%RSDr) were below 11% in all the commodity types tested, and comply with recommended values in regulations5 (see Table 4, 5, 6, and 7). Mean recoveries are also illustrated in Figures 3, 4, 5, and 6.
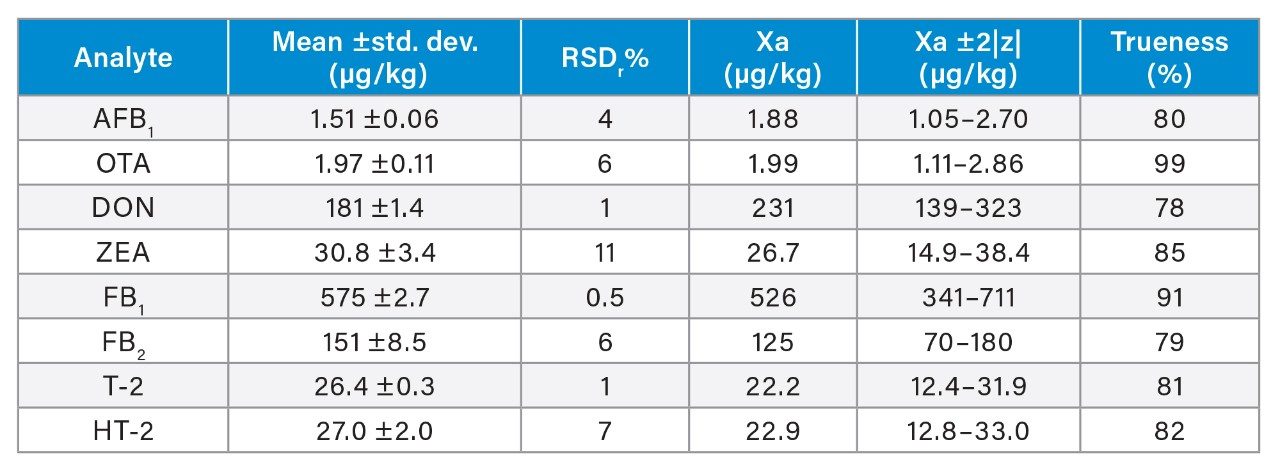
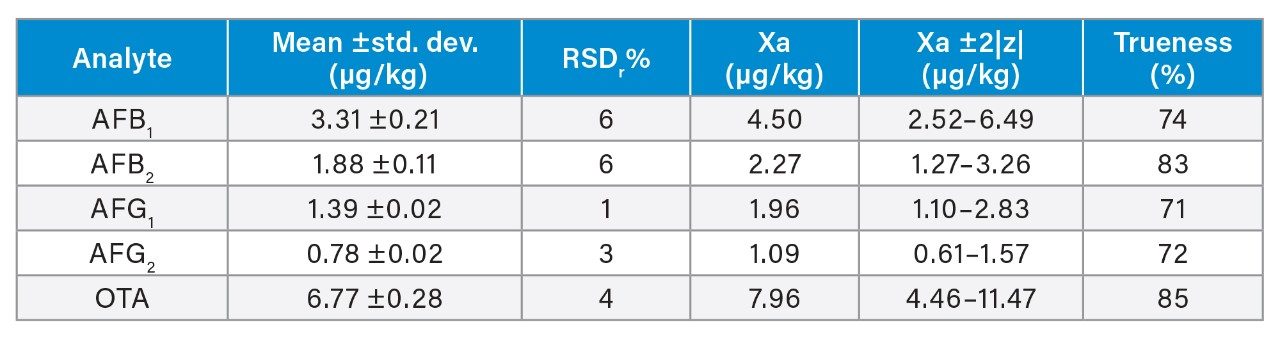
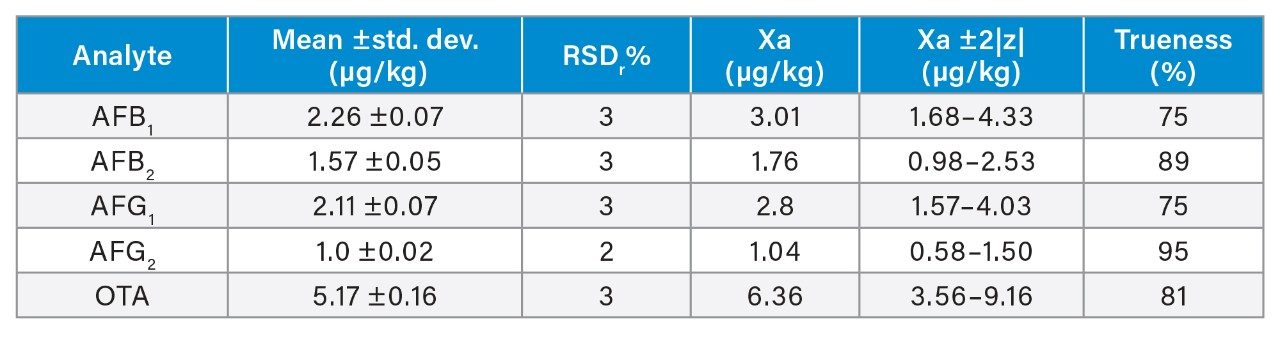
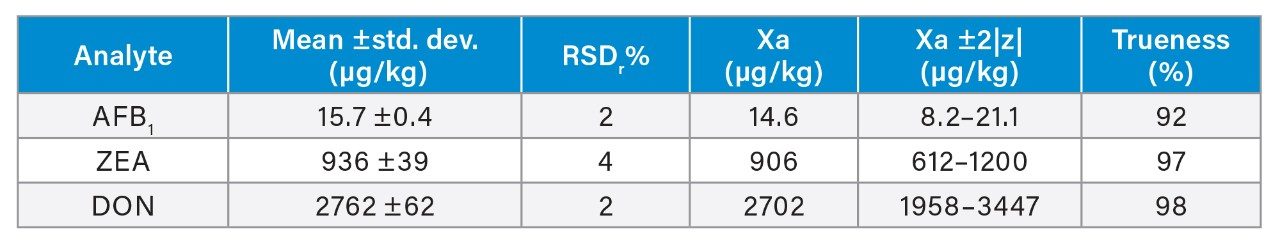
Trueness and repeatability were both also assessed using independent reference materials. Calculated concentrations in maize flour, hazelnuts/water slurry, dried figs/water slurry, and animal feeds reference material were well between ±2|z|-score. Trueness was in the range 71 and 99%, while repeatability (%RSDr , n = 6) ranged between 0.5 and 7% (as shown in Tables 8, 9, 10, and 11).
Conclusion
A multi-mycotoxin method has been successfully developed and validated for the 11 regulated mycotoxins and 20 emerging mycotoxins, including aflatoxins, ochratoxin A, fumonisins, zearalenone, type A and B trichothecenes, enniatins, beauvericin, sterigmatocystin, citrinin, and Alternaria toxins. The performance of the method fulfils the criteria set by the European Regulation No 401/2006 and SANTE guidelines. A simple and quick pass-through SPE clean-up was incorporated and allows the effective removal of some major interferences thus improving method robustness.
The method presented excellent trueness and repeatability, which was verified by using independent reference materials with known concentrations of mycotoxins. The method is applicable to a wide range of food commodities: wheat and maize representing cereals and high-starch-content dried foods; peanuts and hazelnuts representing ground and tree-nuts and high-lipid-content foods; figs representing fruits and high-polar-content foods; and animal feeds.
Finally, the analytical scope of the method can be extended in the future due to the remarkably wide applicability and versatility of the Oasis PRiME HLB clean-up.
References
- Agriopoulou S., Stamatelopoulou E., Varzakas T. (2020). Advances in Occurrence, Importance, and Mycotoxin Control Strategies: Prevention and Detoxification in Foods. Foods 9(2):137. https://doi.org/10.3390/foods9020137.
- Oasis Cartridges and 96-Well Plates – Care and use Manual. Waters Corp. (p/n: 715001391).
- Magnusson B. and Örnemark U. (eds.) Eurachem Guide: The Fitness for Purpose of Analytical Methods – A Laboratory Guide to Method Validation and Related Topics, (2nd ed. 2014). ISBN 978-91-87461-59-0.
- SANTE/12089/2016. Guidance Document on Identification of Mycotoxins in Food and Feed. Implemented by 01/01/2017.
- Commission Regulation No 401/2006 of 23 February 2006 Laying Down the Methods of Sampling and Analysis for the Official Control of the Levels of Mycotoxins in Foodstuffs.
List of Abbreviations
AFB1 = Aflatoxin B1
AFB2 = Aflatoxin B2
AFG1 = Aflatoxin G1
AFG2 = Aflatoxin G2
FB1 = Fumonisin B1
FB2 = Fumonisin B2
FB3 = Fumonisin B3
OTA = Ochratoxin A
ZEA = Zearalenone
DON = Deoxynivalenol
DON-3-Glu = Deoxynivalenol-3-Glucoside
NIV = Nivalenol
HT-2 = HT-2 toxin
T-2 = T-2 toxin
3-Ac-DON = 3-Acetyl-deoxynivalenol
15-Ac-DON = 15-Acetyl-deoxynivalenol
DAS = Diacetoxyscirpentol
NEO = Neosolaniol
Deepoxy-DON = Deepoxy-deoxynivalenol
FUS-X = Fusarenon X
AOH-Me-Ether = Alternariol-Methyl-Ether
720007377, September 2021