Determination of Hydrodynamic Radius With MaxPeak Premier Protein SEC Columns
Abstract
Size Exclusion Chromatography (SEC) has been widely used for size-based analysis. We show here that separating proteins with known hydrodynamic radius (Rh) values on either Waters ACQUITY™ Premier Protein SEC 250 Å, 1.7 µm or XBridge™ Premier Protein SEC 250 Å, 2.5 µm Column and generating respective calibration curves, provide an easy and effective way to determine Rh of biomolecules. Since Rh is a useful parameter when investigating conformation and interaction properties of proteins in solution, it can be informative in formulation development or used to monitor protein conformation changes.
Good linear relationship between Log (Rh) and retention time indicates minimal secondary interaction between the proteins and the ACQUITY or XBridge Premier Protein SEC Column which uses a synergistic coupling of Waters MaxPeak™ Premier High Performance Surfaces (HPS) and BEH™ SEC polyethylene particle technologies.
Benefits
- Rh determination by Waters XBridge Premier Protein SEC 250 Å, 2.5 µm and Waters ACQUITY Premier Protein SEC 250 Å, 1.7 µm columns
- Minimal undesired ionic or hydrophobic secondary interactions between the proteins and MaxPeak Premier Protein SEC particles and column hardware
Introduction
SEC separates analytes based on their size in solution, or hydrodynamic volume. Rh, which is defined as the radius of an equivalent hard sphere diffusing at the same rate as the molecule under examination, can be determined by SEC. Rh factors in not only the size of the molecule, but also solvent effects. For proteins, since they do not exist as hard spheres, the determined Rh more closely reflects the apparent size of the solvated biomolecules. Rh has been shown to be different for native and denatured proteins measured by NMR, likely due to the difference in conformation.1 SEC has been used to detect and monitor protein-small molecule interaction that causes conformational changes of a protein by Rh measurements.2 In addition, if the conformation of a target protein is influenced by its interaction with other molecules contained in the same solution, then comparative Rh data could be used in the development of final formulation for a stable protein biotherapeutic. Therefore, Rh can be a biologically relevant parameter since it considers the size of the proteins in its surrounding environment.
In this application note, we show separation of several proteins with known Rh on a Waters XBridge Premier Protein SEC 250 Å, 2.5 µm, 7.8 x 300 mm Column and on an ACQUITY Premier Protein SEC 250 Å, 1.7 µm, 4.6 x 300 mm Column. Calibration curves were generated to determine Rh of trastuzumab, a monoclonal antibody (mAb). In addition, calibration curves generated under different mobile phase conditions with varied ionic strength were compared. The good linear relationship between Log (Rh) and retention time indicates that any undesired ionic or hydrophobic secondary interactions between the proteins and MaxPeak Premier Protein SEC particles and column hardware is minimal.
Experimental
Sample Description
Gel filtration markers kit (MWGF1000) and ovalbumin (A5503) were purchased from Sigma. For each protein, a stock solution of 10–20 mg/mL was made. All the proteins were combined to achieve 1 mg/mL of each protein. Trastuzumab (21 mg/mL) was injected neat onto the liquid chromatography (LC) system.
Method Conditions
|
LC Conditions |
|
|
LC system: |
ACQUITY UPLC H-Class PLUS Bio System (Ave. system dispersion: 4 sigma < 22 mL) |
|
Detection: |
ACQUITY UPLC™ TUV Detector with 5 mm titanium flow cell, wavelength: 280 nm |
|
Vials: |
Polypropylene 12 x 32 mm Screw Neck Vial, with Cap and Pre-slit PTFE/Silicone Septum, 300 µL Volume, 100/pk (p/n: 186002639) |
|
Column(s): |
XBridge Premier Protein SEC 250 Å, 2.5 µm, 7.8 x 300 mm with mAb Size Variant Standard (p/n: 176005070) ACQUITY Premier Protein SEC 250 Å, 1.7 µm, 4.6 x 300 mm (p/n: 186009964) |
|
Column temp.: |
Ambient |
|
Sample temp.: |
10 °C |
|
Injection volume: |
10 µL (protein mix), 1 µL (trastuzumab) for 7.8 mm i.d. column 3.5 µL (protein mix), 0.4 µL (trastuzumab) for 4.6 mm i.d. column |
|
Flow rate: |
0.75 mL/min for 7.8 mm i.d. column 0.38 mL/min for 4.6 mm i.d. column |
|
Mobile phase: |
Phosphate-buffered saline, Dulbecco's formula (DPBS) 10X (Alfa Aesar, J61917), 0.1 µm sterile filtered, diluted to 1X, 1.5X, and 2X |
|
Data Management |
|
|
Chromatography software: |
Empower 3 (FR 4) |
Results and Discussion
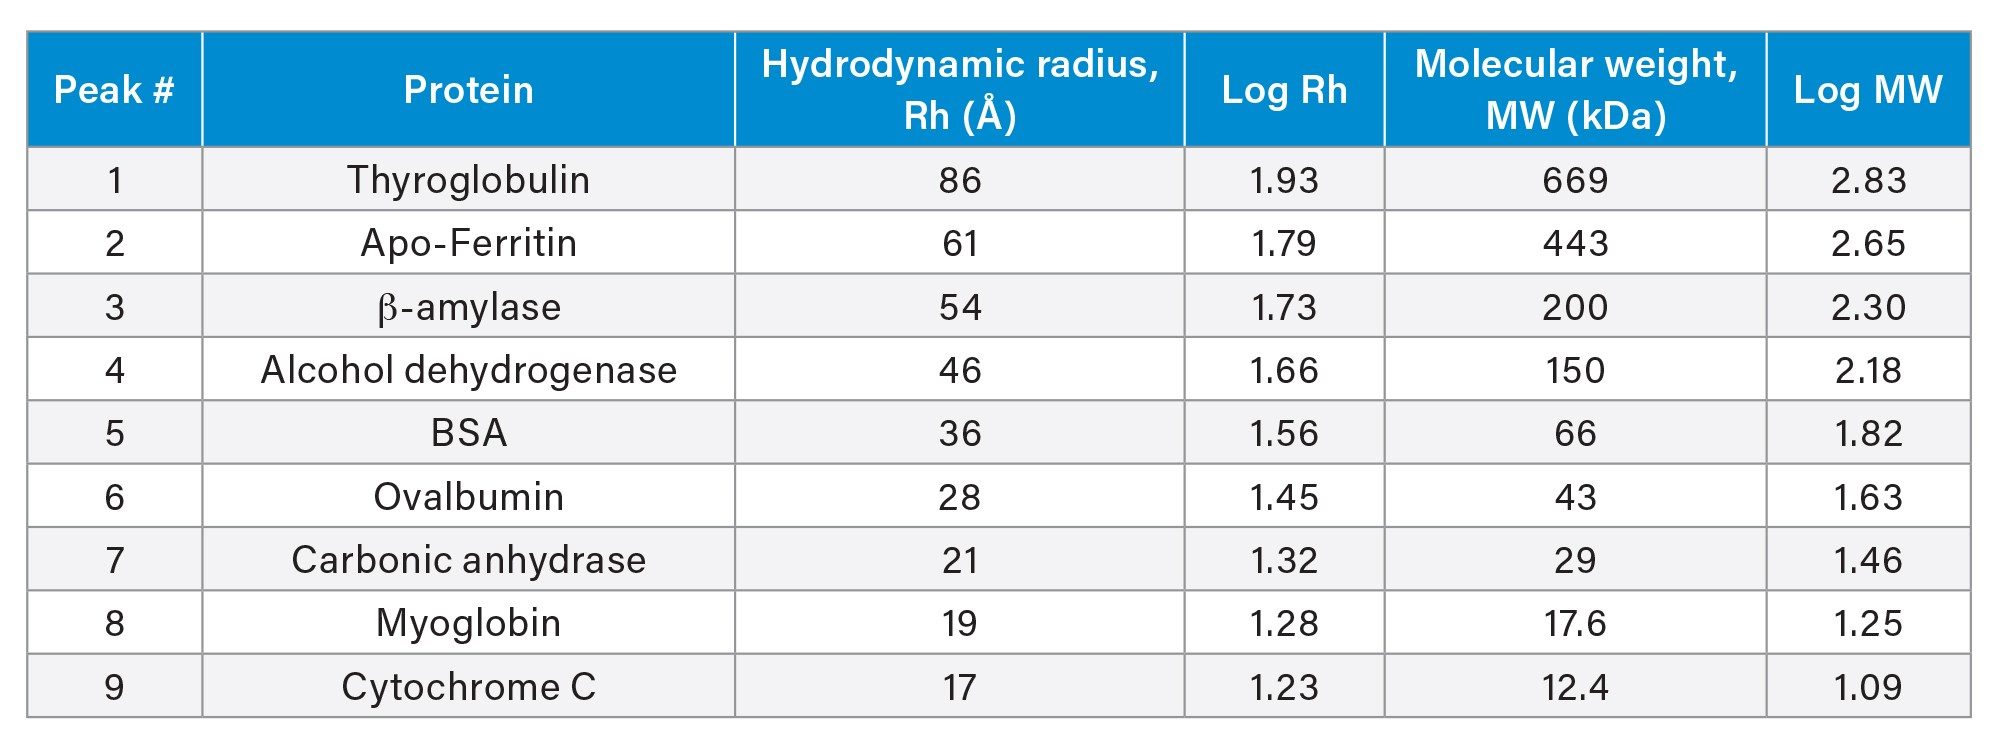
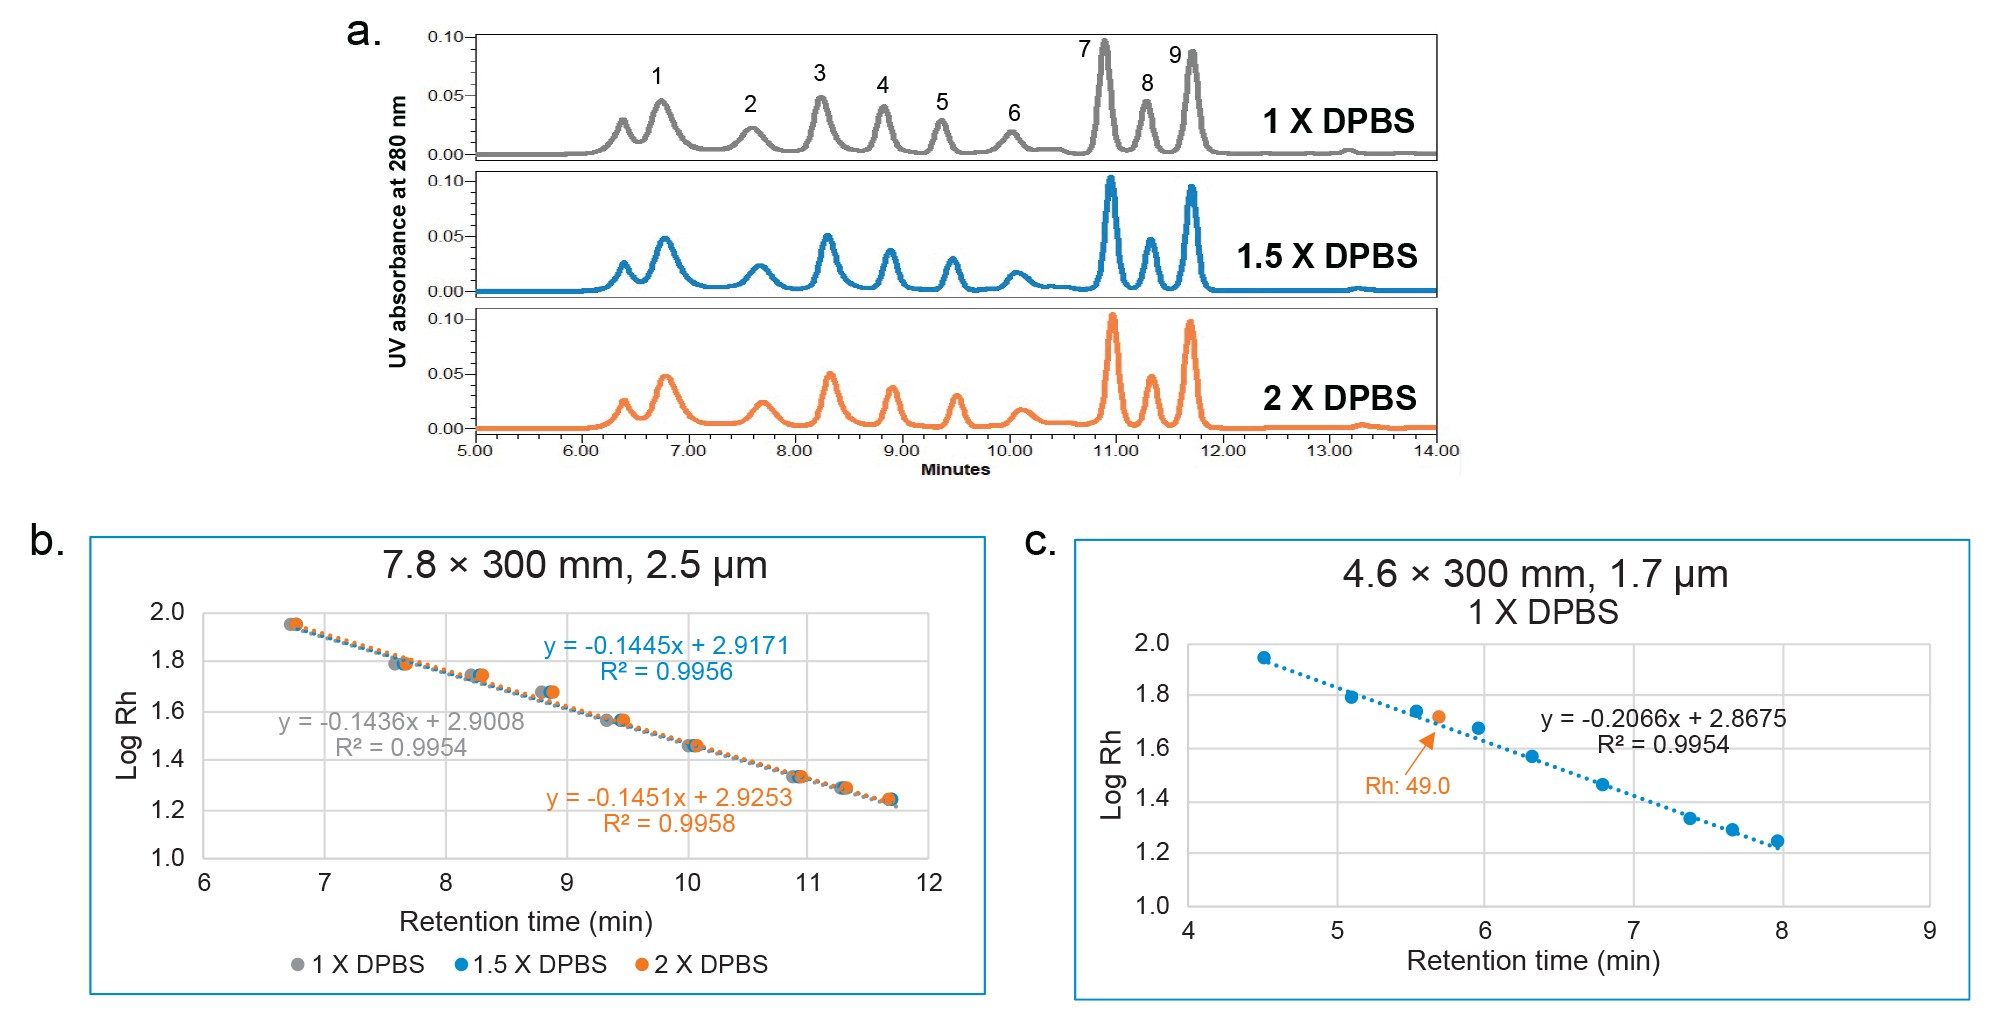
A mixture of proteins with various Rh were separated on a XBridge Premier Protein SEC 250 Å 2.5 µm, 7.8 x 300 mm Column. Table 1 shows the Rh of the proteins used to generate the calibration curves. The separation was carried out under three mobile phase conditions with varied ionic strength: 1X DPBS (phosphate-buffered saline, Dulbecco's formula), 1.5X DPBS and 2X DPBS (Figure 1a). 1X DPBS contains 8 mM disodium hydrogen phosphate, 2.7 mM potassium chloride and 0.137 M sodium chloride. Calibration curves were constructed by plotting the base ten logarithm of Rh against the retention time of each protein. As can be seen in Figure 1b, an effective linear correlation is obtained from the calibration curves, as evidenced by R2 of the trendlines (R2>0.995). In addition, changing the ionic strength did not have a significant impact on the calibration curve as the slope, the y-intercept and the R2 of the trendlines are similar under these conditions. With 1X DPBS mobile phase condition, similar results were obtained using an ACQUITY Premier Protein SEC 250 Å 1.7 µm, 4.6 x 300 mm Column (R2=0.9954) (Figure 1c). These results indicate that the secondary interaction between the proteins and the SEC particles or column hardware is minimal for both used MaxPeak Premier High Performance Surfaces (HPS) technologies.
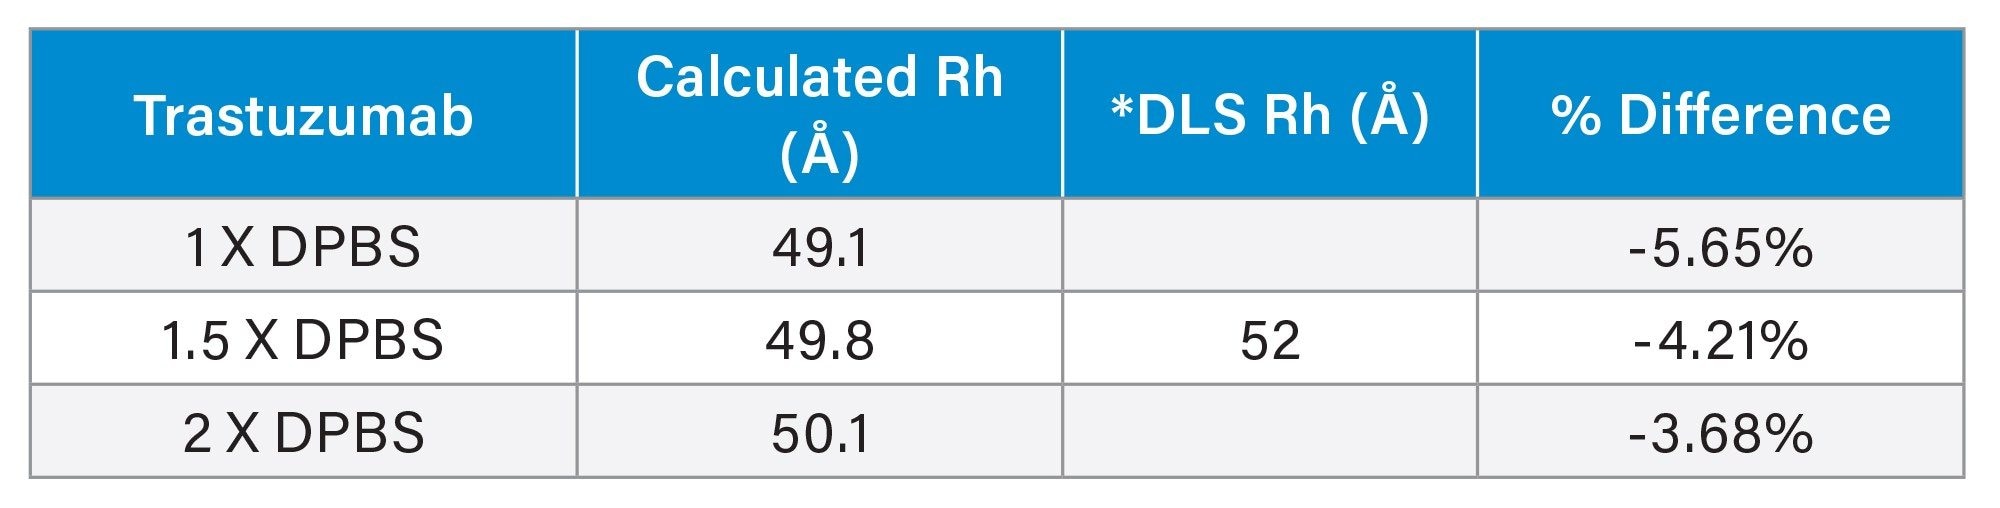
Using the calibration curve, the Rh of trastuzumab was determined from its retention time (Table 2). For all mobile phase conditions, there is a difference of less than 6% versus the DLS (Dynamic Light Scattering) value obtained from literature of 5.2 nm.3 For an ACQUITY Premier Protein SEC 250 Å 1.7 µm, 4.6 x 300 mm Column, the percent difference is 5.84% under 1X DPBS mobile phase condition. The discrepancy between the measured Rh values by SEC reported here and the values reported in literature could be related to the approach taken for measuring Rh.
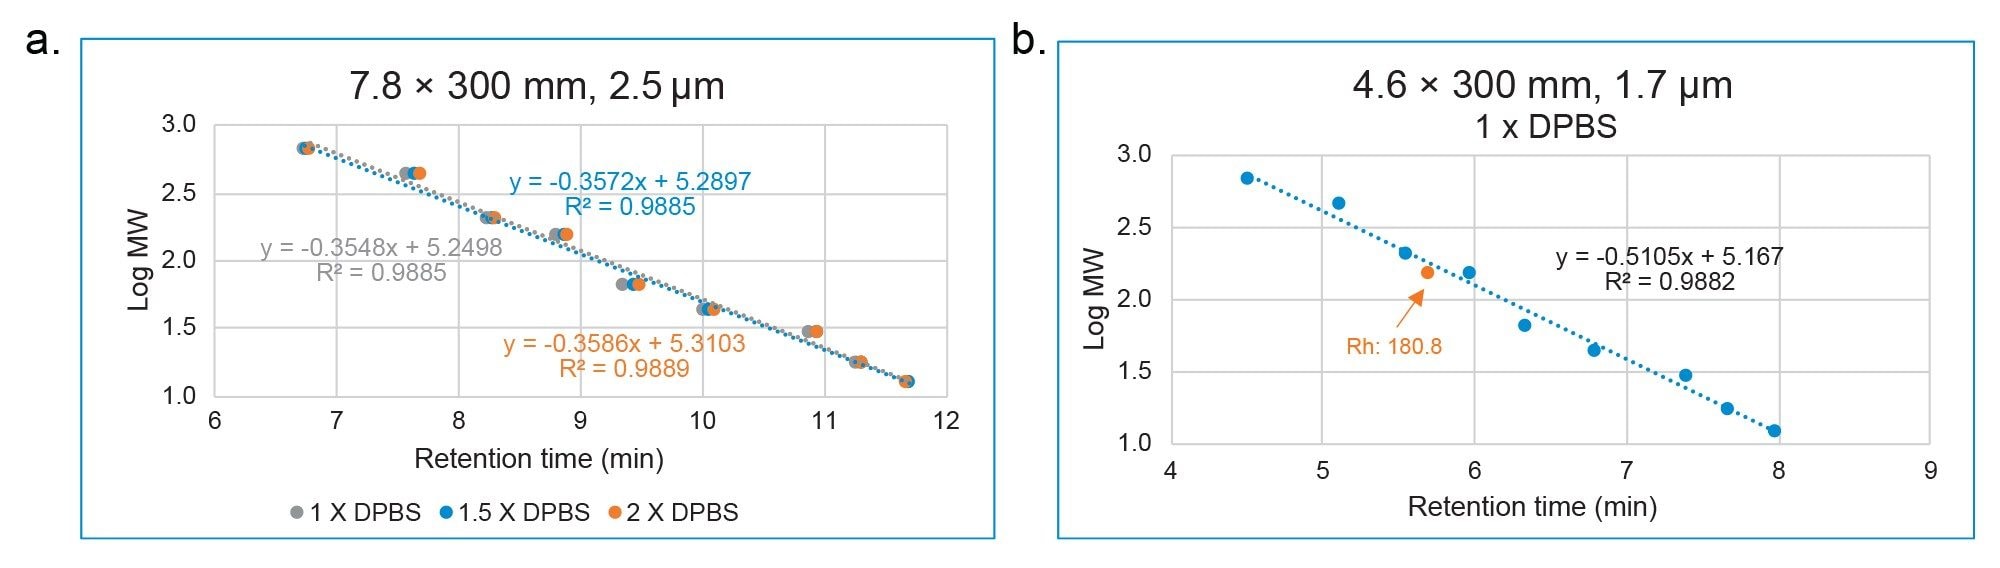
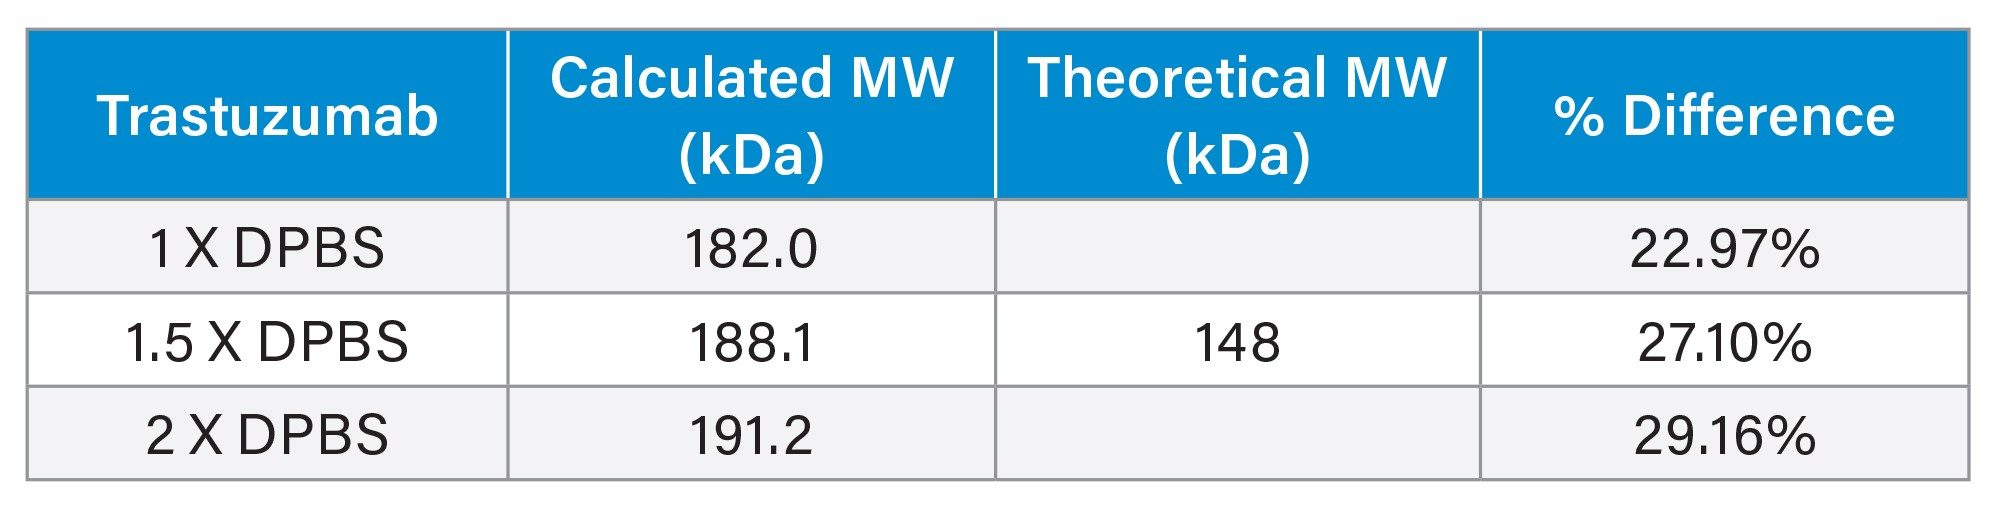
The MW of trastuzumab was determined using the calibration curve generated by the same proteins listed in Table 1. As shown in Figure 2, the calibration curves were also highly similar under different ionic strength conditions for the XBridge Premier Protein SEC 250 Å 2.5 µm, 7.8 x 300 mm Column. However, the linear correlation (R2>0.988) is not as high as when the Rh is used. The percent difference (>22%) is also larger than when Rh is used (Table 3), compared to the theoretical MW. For the ACQUITY Premier Protein SEC 250 Å 1.7 µm, 4.6 x 300 mm Column, R2 is 0.9882 and percent difference is 22.15% under 1X DPBS mobile phase condition. These results are not surprising, because SEC separates the analytes based on their size not their MW. MW does not take the shape and the conformation of the molecule in the solvent into consideration. On the other hand, the hydrodynamic radius measures the size of a molecule in the solvent, which presumably better reflects the behavior of a molecule in the mobile phase of SEC. As a result, better estimates are obtained for Rh than MW when using an SEC column exhibiting minimal interactions between the protein and the stationary phase or column hardware.
Conclusion
Rh is considered a biologically important parameter since it takes into consideration of the solvent effect of a biological molecule and can provide useful information during formulation development of a drug since a change in Rh could also indicate a change in protein conformation.
In this application note, we show an easy and effective way to determine Rh of proteins by SEC. Proteins with known Rh were separated on MaxPeak Premier Protein columns and calibration curves were generated by plotting Log (Rh) vs. Retention time. The high linear correlation indicates minimal secondary interaction between the proteins and the Premier column stationary phase and column hardware, and the Rh of the monoclonal antibody trastuzumab determined from the SEC calibration curves is within 6% of the DLS Rh value reported from literature. It was also demonstrated that mAbs such as trastuzumab do not exhibit a typical correlation between Rh and MW when evaluated by SEC, which is expected since SEC separates molecules based on their size in solution not their MW.
It should also be noted that these SEC results for the proteins and mAb were generated using a mobile phase (DPBS) at a physiologically relevant pH (7.4) and ionic strength (about 150 mM), thereby providing a potentially more relevant measure of protein conformation in comparison to SEC measurements made using a more extreme pH or ionic strength.
References
- Wilkins D. K. Grimshaw S. B. Receveur V. Dobson C. M. Jones J. A. Smith L. J. Hydrodynamic Radii of Native and Denatured Proteins Measured by Pulse Field Gradient NMR Techniques. Biochemistry 1999; 38 (50):16424–16431.
- Verde V. L. Dominici P. Astegno A. Determination of Hydrodynamic Radius of Proteins by Size Exclusion Chromatography. Bio-protocol. 2017; Vol 7, Issue 08.
- Ramos J. Vega J. F. Cruz V. Sanchez-Sanchez E. Cortes J. Martinez-Salazar J. Hydrodynamic and Electrophoretic Properties of Trastuzumab/HER2 Extracellular Domain Complexes as Revealed by Experimental Techniques and Computational Simulations. Int. J. Mol. Sci. 2019; 20: 1076.
720007625, May 2022