Multidimensional Characterization of Polyhydroxy Alkanoate Based Bioplastic Raw Material with Advanced Polymer Chromatography
This is an Application Brief and does not contain a detailed Experimental section.
Abstract
Polyhydroxy alkanoates (PHA) are a class of biodegradable polymers produced by fermentation that offer the potential to displace single-use fossil fuel derived plastics. PHAs are typically copolymers whose composition of different PHA can vary greatly in composition based on the biochemical feedstocks, the microorganisms used, and the bioreaction conditions. However, the two most common components the copolymers comprise are poly-3-hydroxy butyrate (PHB) and poly-3-hydroxy valerate (PHV) with PHB being the major component. The ratio of these components governs the properties of the material such as thermal, mechanical, and crystallinity.
In this feasibility study, two-dimensional analysis with Advanced Polymer Chromatography™ and evaporative light scattering detection (ELSD) was utilized to gain more insight into the chemical composition distribution, as one-dimensional SEC-analysis is often insufficient to elucidate differing behavior with varying PHB to PHV ratios.
Benefits
- Solvent compatibility of APC enables normal phase chromatography and typical non-polar solvents in the first and second dimension
- Straight-forward data acquisition and data processing for contour plots and molecular weights with WinGPC Software
- Copolymer separation by composition and size separation in a single experiment
Introduction
Plastics have become an indispensable commodity in everyday life due to their wide range of applications, particularly in packaging. Plastics can be separated into two main classes: fossil fuel-derived and bio-sourced plastics. Currently, most plastics are fossil fuel derived, but with a steadily increasing eco-conscientious mindset, there is a production shift towards bio-sourced plastics. Bioplastics are appealing as they derived from renewable feedstocks, making them more sustainable. Additionally, while not true for all bioplastics, they are much more commonly biodegradable than their fossil fuel counterpart. One example of a bio-sourced/bio-degradable plastic is polyhydroxy alkanoates (PHAs) which are on the horizon to replace the commonly used polyolefins PE and PP as well PET and PS. These are biodegradable, linear (co)polyesters synthesized by a wide variety of bacteria via fermentation of a large selection of carbon feedstocks. PHAs have high biodegradability and biocompatibility lending these compounds an eco-friendly character. PHAs are currently used in a broad range of applications including food packaging and coatings for beverage bottles to name a few.
Poly-3-hydroxy butyrate (PHB) and its copolymers remain the most used PHAs. PHB is a crystalline polymer that exhibits strong and brittle physical characteristics. Incorporation of poly-3-hydroxyvalerate (PHV) into the PHB backbone increases both the tensile and impact toughness of the polymer and alters other characteristics, such as decreasing the melting point of the resulting copolymers compared to pure PHB, thus improving processability. Poly(3-PHBV) copolyesters have been shown to be mixtures of random (co)polyesters with a wide distribution in comonomer composition and molecular weight. As similar variation in chemical composition might exist in commercial PHA, their characterization in general is therefore of great importance, since the variance in their chemical composition is especially problematic for commercial applications. Traditional characterization utilizes GC-MS following a partial degradation.1,2 However, this neither provides information about the molecular weight spread nor the variation or distribution in copolymer composition that may be present in the original polymer sample. Sized-based separation by itself will not likely separate components of differing chemical composition having the same hydrodynamic volume. On the other hand, a purely chemical separation provides more detailed information on the composition distribution but cannot discern how co-units are distributed amongst the molecular weight distribution. Two-dimensional (2D) analysis is the option to resolve this dependency.
In this feasibility study, a two-dimensional APC analysis approach with chloroform as main solvent component in both dimensions was used to analyze selected Poly(3-PHBV) polyesters with differing PHV to PHB ratio, but similar glass transition temperature (Tg, data not shown) to gain insight into the distributional differences.
Experimental
The poly(3-PHBV) samples were dissolved in ethanol stabilized chloroform to make a 10 mg/mL solution and left tumbling at low speed overnight. Prior to filtration with a 0.22 um PTFE filter, the sample solutions were centrifuged 70 min at 3900 rpm to remove insoluble material especially from the straw. The filtrate was diluted 1:4 to make a 2 mg/mL sample solution and placed into 2 mL sample vials for injection.
Results and Discussion
Prior to conducting the 2D analysis, the size-based separation was performed in chloroform using a BEH XT 450 Å Column. The chromatogram in Figure 1 only exhibits one peak for each sample. Assuming that the samples comprise at least two components, it can be reckoned that co-elution is occurring. Size-based separation does not differentiate between the three poly(3-PHBV) samples.
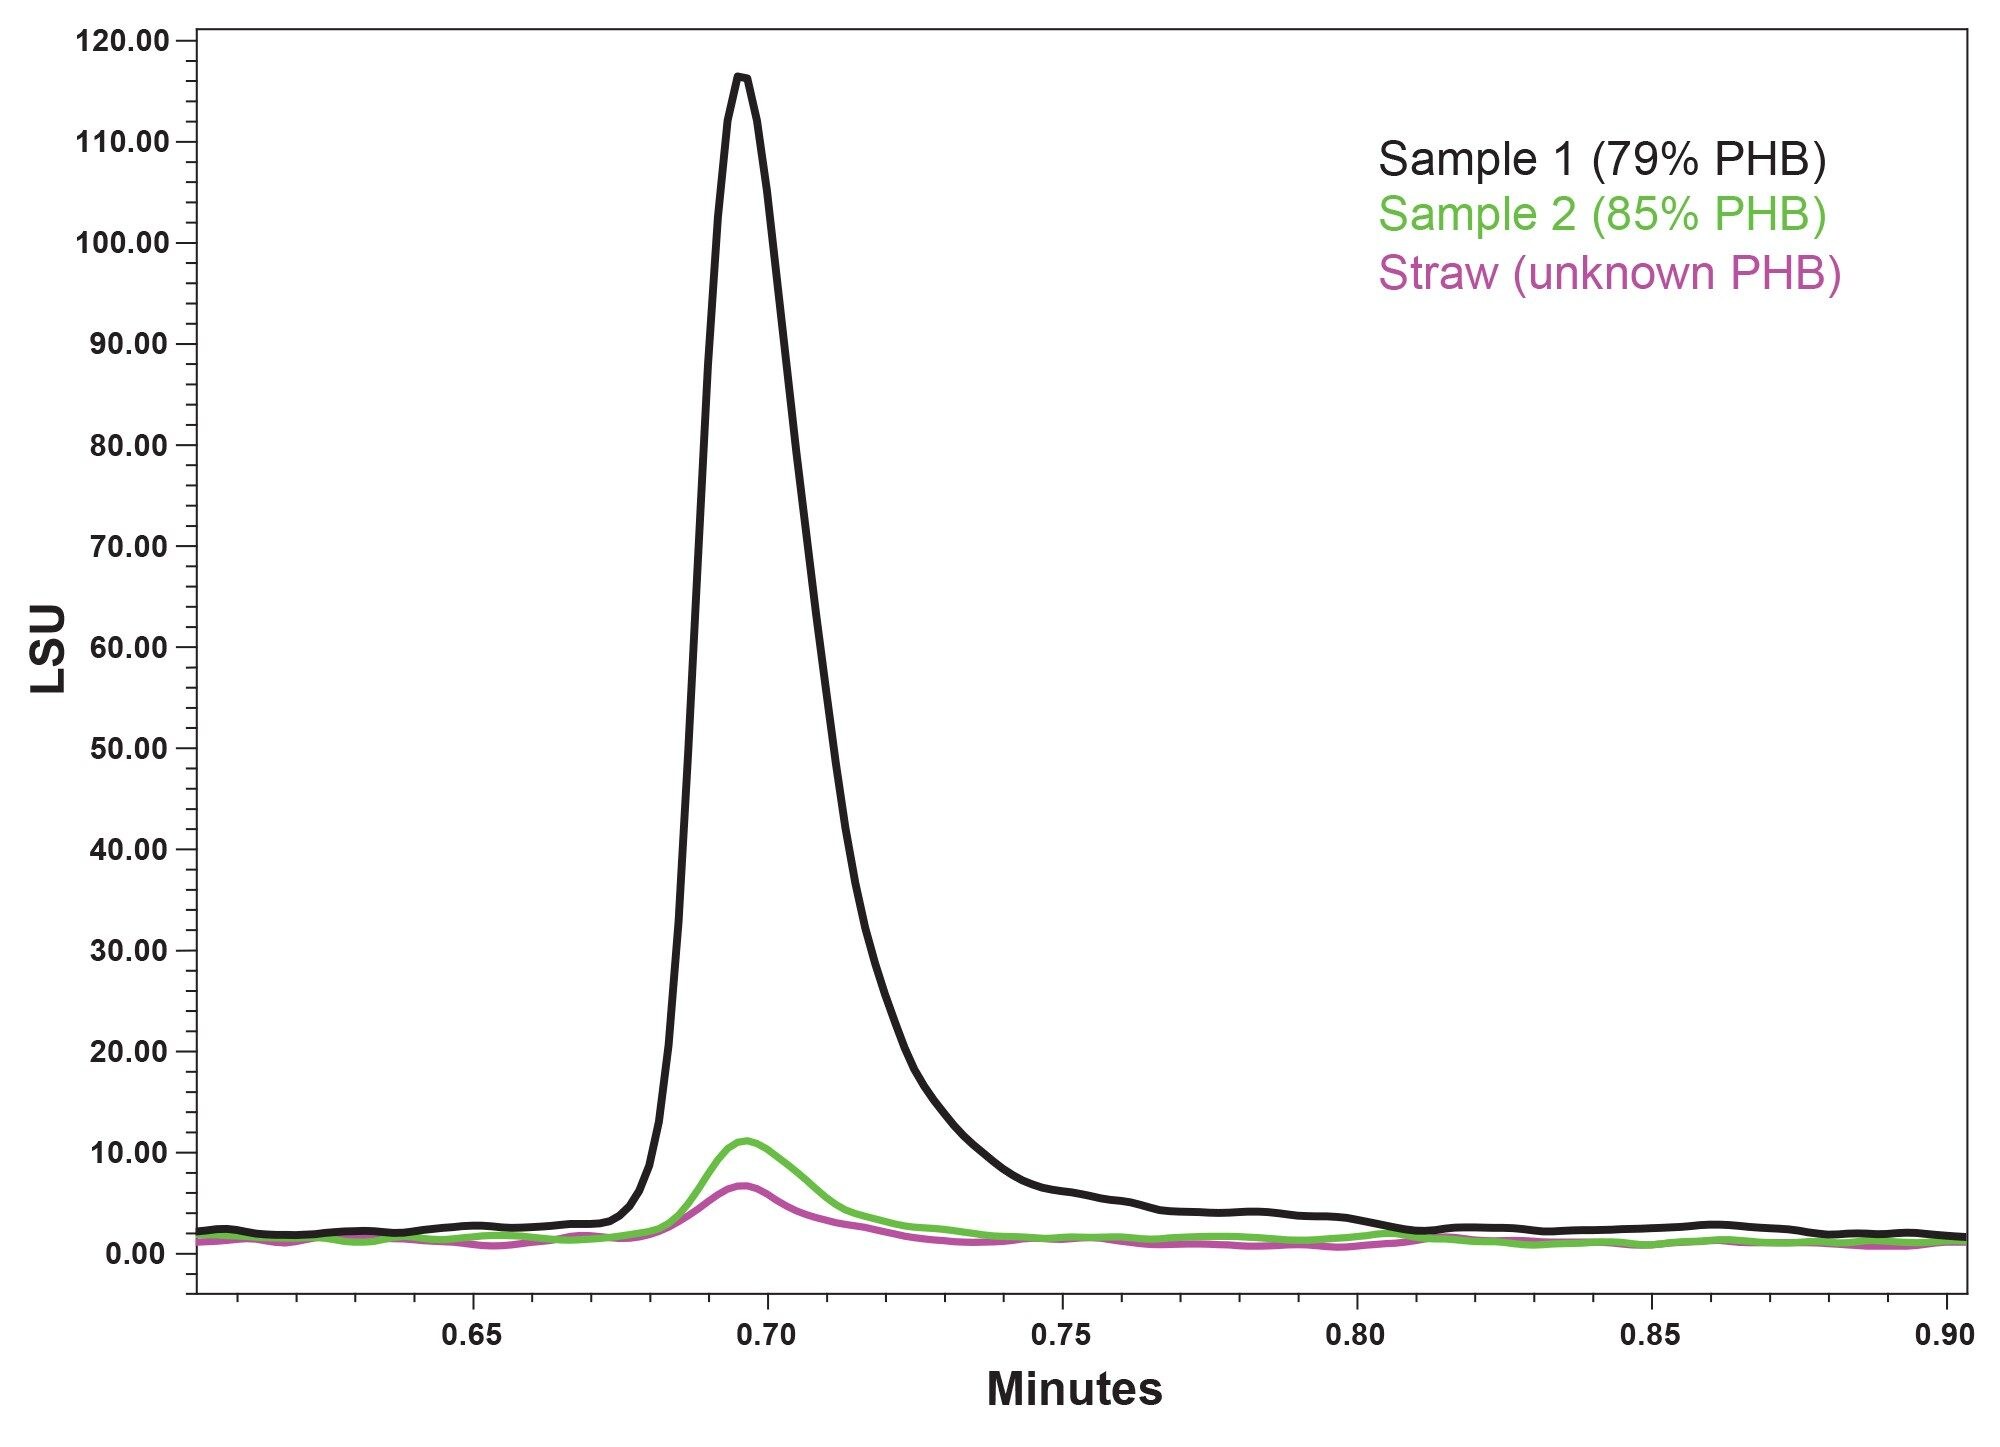 Figure 1. One-dimensional size-based separation of all three samples with retention time on the X-axis and light scattering units (LSU) on the Y-axis.
As the subsequent step, a separation by chemical composition with a gradient from chloroform to a chloroform/tetrahydrofuran mixture was applied using a SunFire™ Silica Column. As can be seen in Figure 2 following separation with a steep gradient for trial purposes, all samples yield two peaks except for sample 1. The single peak of sample 1 elutes earlier than the first peak of samples 2 and 3. The second peak at ~8 min is only present for sample 2 and 3. There seems to be a difference between sample 1 and samples 2 and 3, but no information is gained about what the difference is between samples 2 and 3 is. Either of the individual techniques by itself yielded insufficient information in this trial. The different ELSD signal intensities stem from different injection volumes and sample concentrations.
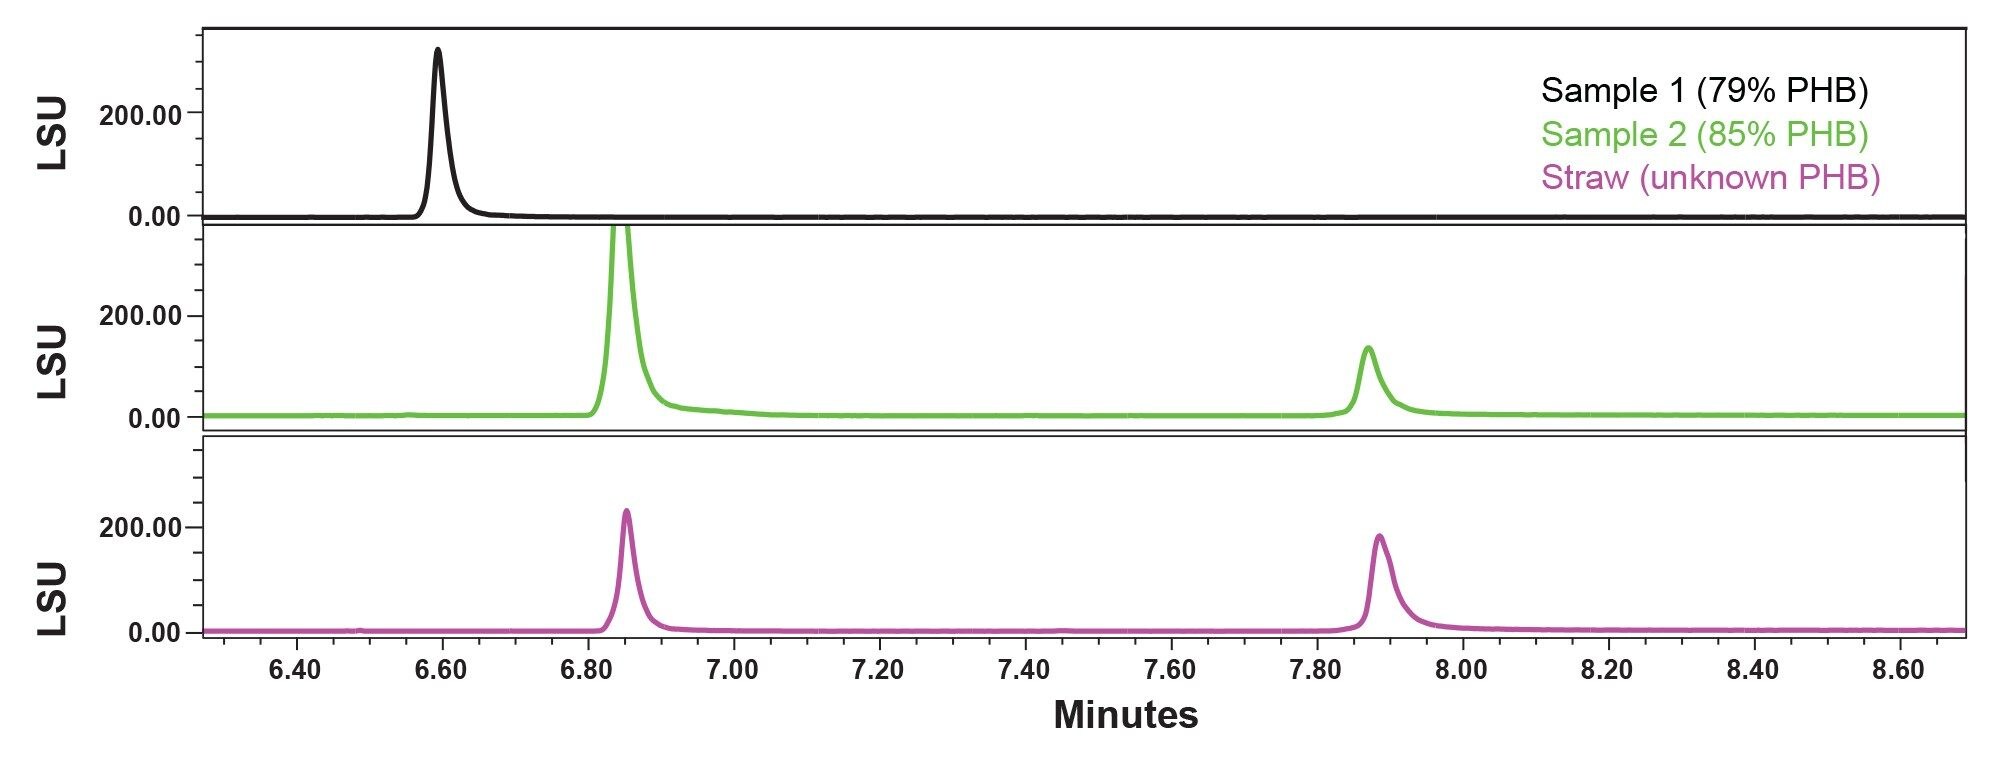 Figure 2. One-dimensional gradient-based separation of three poly(3-PHBV) samples with retention time on the X-axis and light scattering units (LSU) on the Y-axis.
Key parameters from the individual chemistry-based separation and size-based separation aided manual calculation for the run conditions needed for the 2D set-up in WinGPC Software.
- the flow rate of the first-dimension for a full 2D measurement from the runtime of the second dimension and the loop volume.
- the amount of transfer fractions separated in the second-dimension is determined from the volume of the individual first-dimension injection until the last peak elutes and the loop volume
- The volume from above divided by the first-dimension flow rate yields the total runtime for a full 2D run with both techniques in tandem.
These values are needed for the simple guided 2D valve setup in WinGPC. First, the methods for the instruments are loaded (Figure 3).
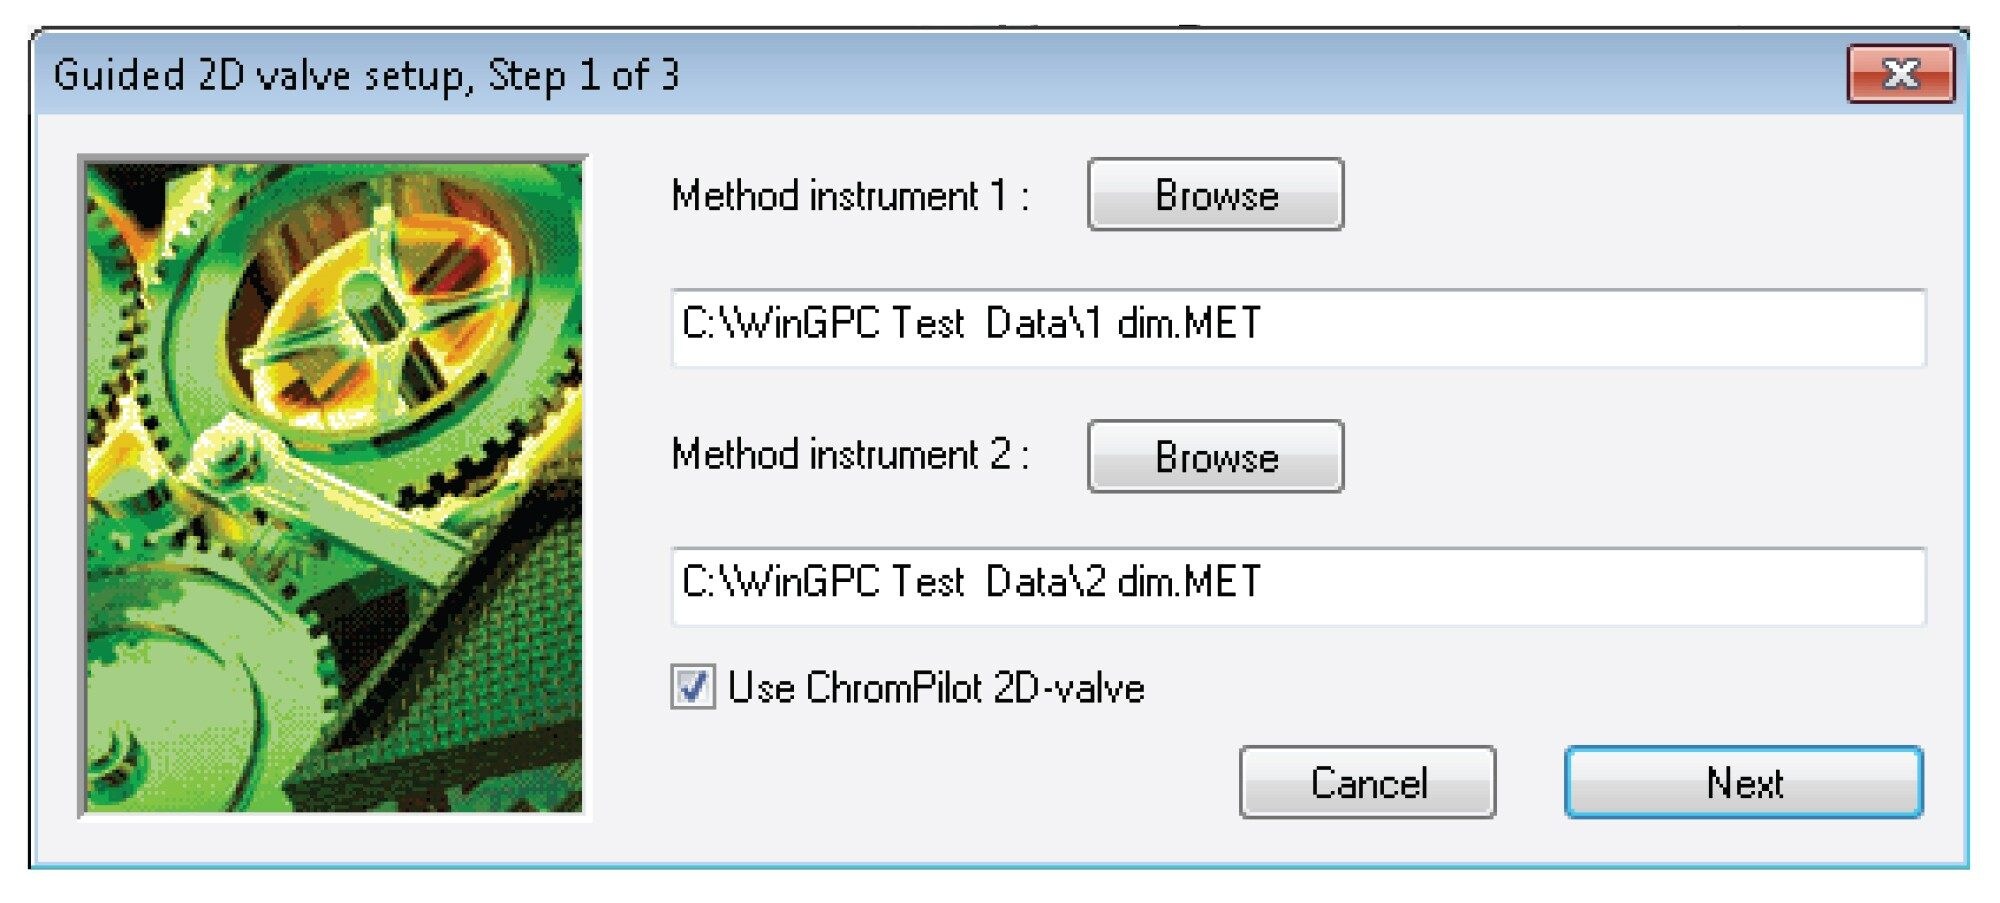 Figure 3. Loading of methods for both instruments in the guided 2D valve setup.
Entering the calculated parameters outlined above and ‘applying the settings to the valve’ as prompted and loading a saved sequence will start the 2D run (Figure 4). Setting up a sample sequence can also be done through a sample wizard.
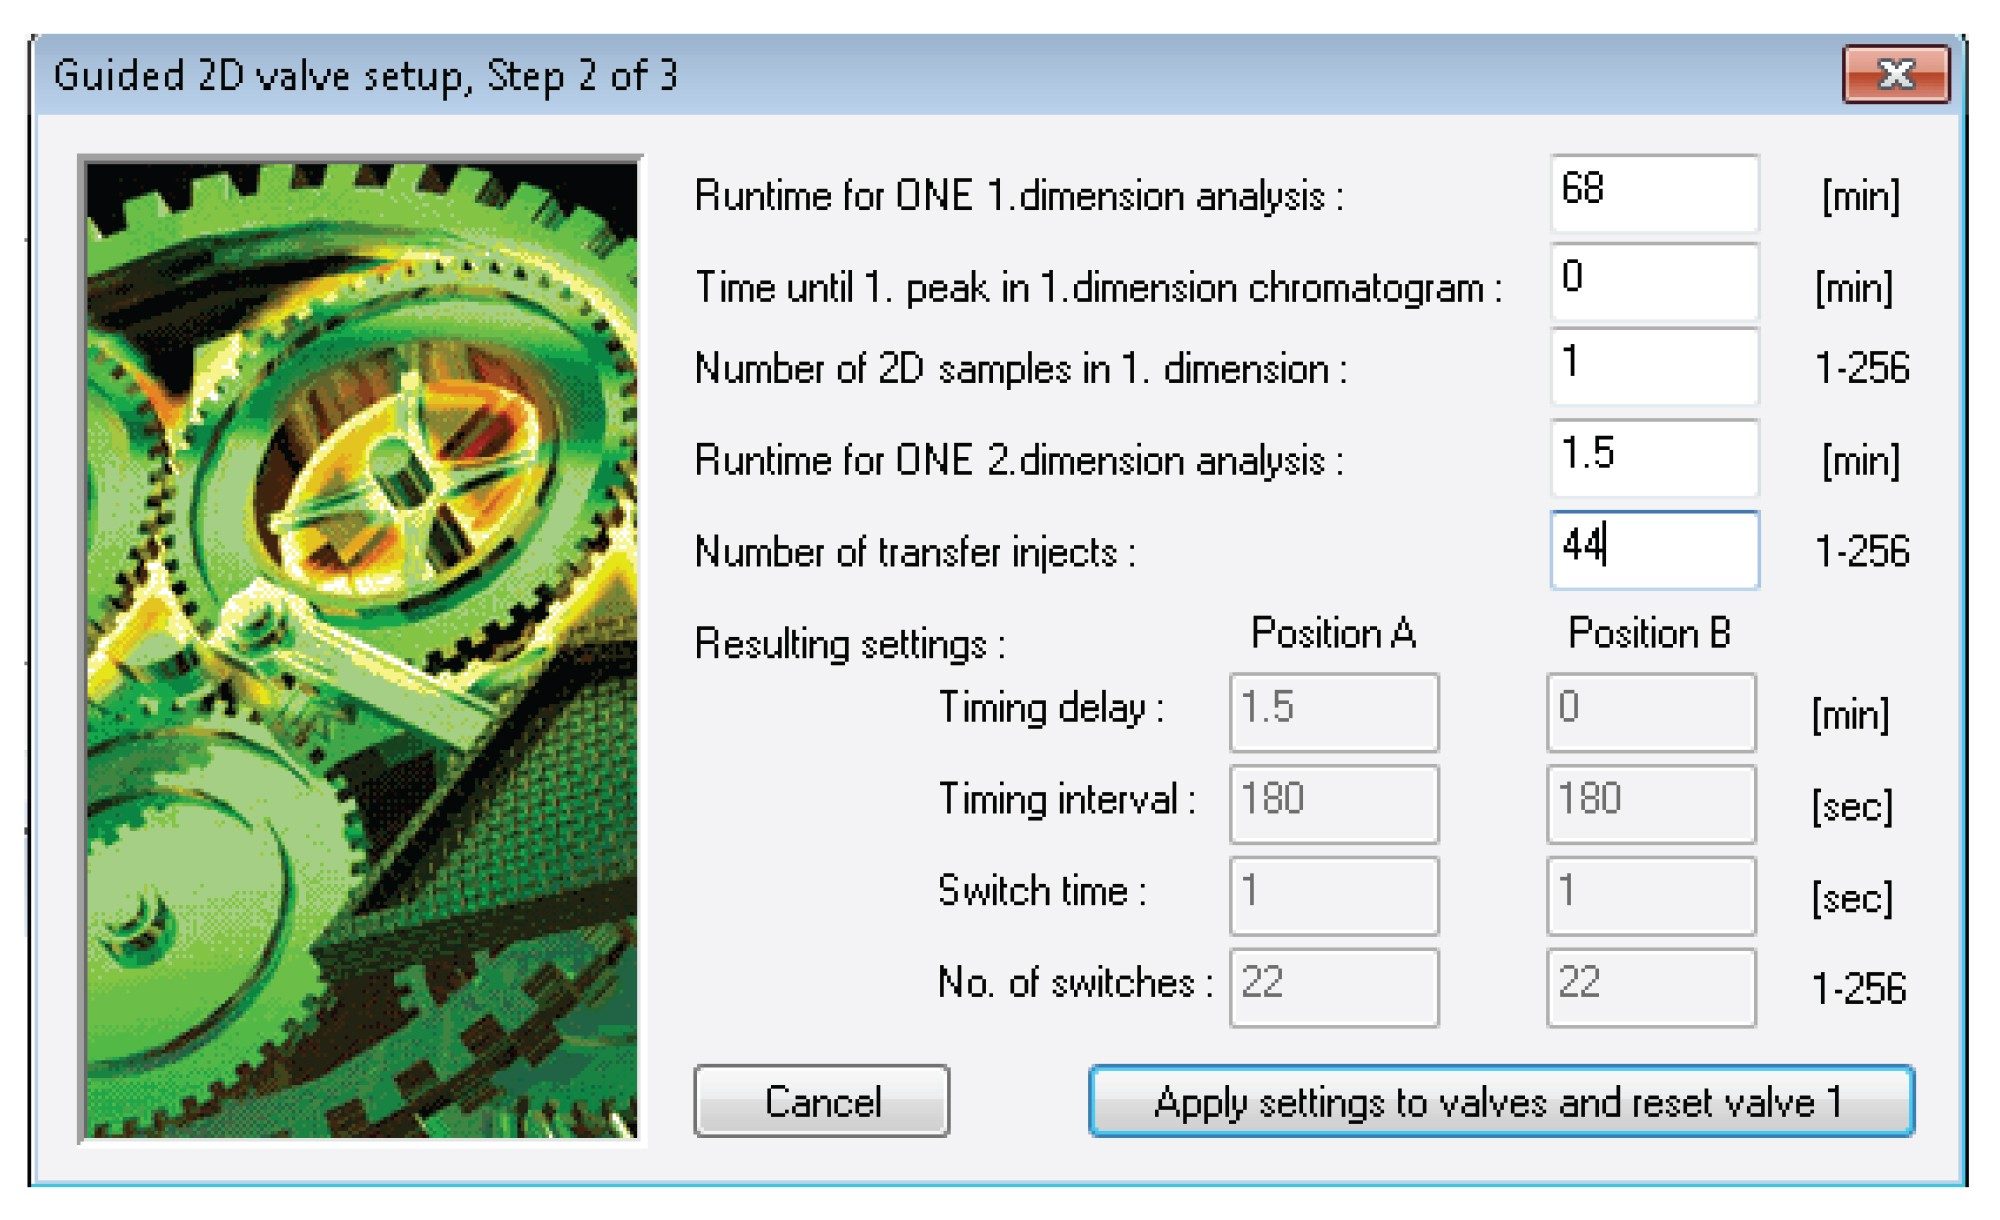 Figure 4. Window in the guided 2D valve setup window where calculated parameters are entered for one of the trial runs.
The resulting contour plots obtained for all three Poly(3-PHBV) samples are displayed in Figures 5 through 7. The elution volume of the second-dimension run (size-based separation) on the X-axis is plotted against the elution time of the first-dimension run (gradient separation) on the Y-axis. All the contour plots looked different, despite the apparent similarity indicated by the individual chromatograms. The contour plot of sample 1 in Figure 5 is displaying three populations instead of the single peak in Figures 1 and 2 (black trace). The two populations between 1.1- and 1.2- mL elution volume on the X-axis (Figure 5) that initially co-eluted in the sized-based separation run was separated in the first-dimension gradient run. The third population around 1.5 mL elution volume in Figure 5 got masked in the tail of the individual sized-based injection between 0.7 and 0.8 min elution time. (Figure 1).
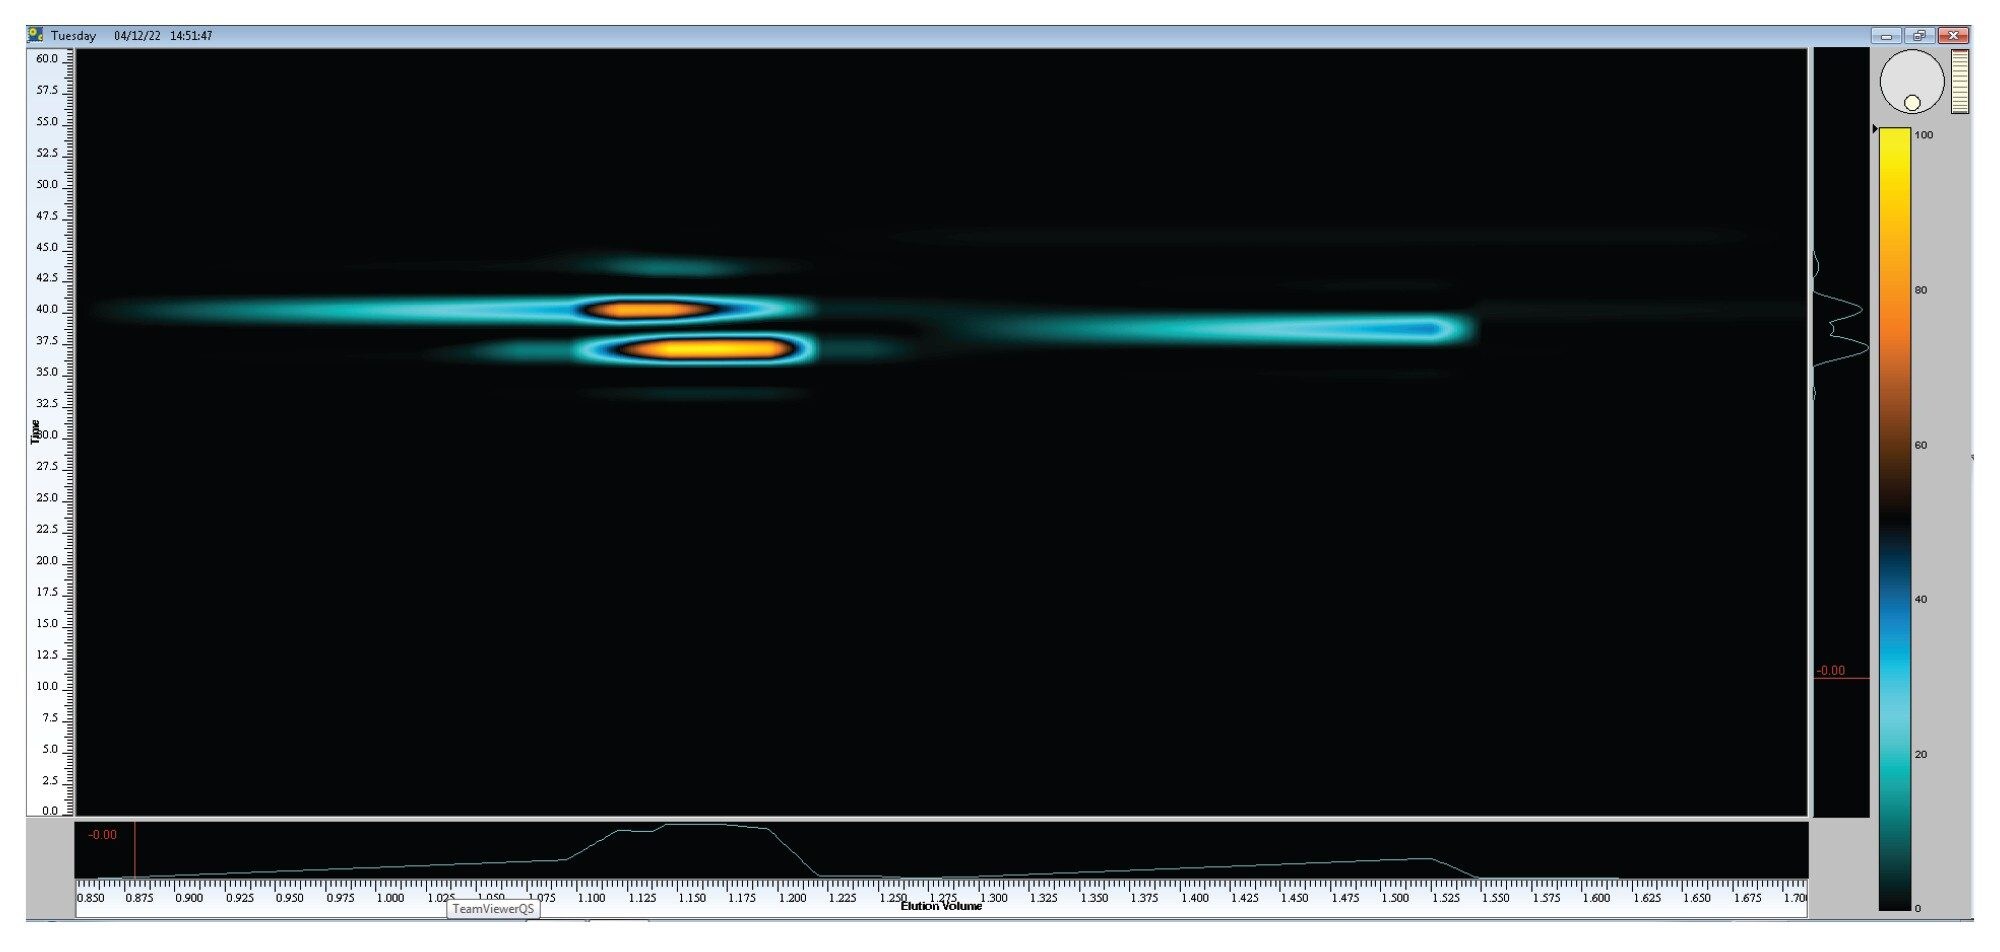 Figure 5. Contour plot of sample 1 displaying three separated populations that differ by chemistry and/or molecular weight. Plotted on the X-axis is the elution volume of the second-dimension against the elution time of the first-dimension run.
Figure 6 shows the contour plot of sample 2. Although co-elution occurred in the initial the sized-based separation (Figure 1) run which was resolved in the first-dimension gradient run (Figure 2), the late eluting population around 40 min elution time in gradient chromatography differs in SEC elution volume from the early eluting population in Figure 6. Thus, two populations differ in composition (first-dimension elution time) and in molecular weight (second-dimension elution time). This is additional information that cannot be obtained from either SEC or gradient alone.
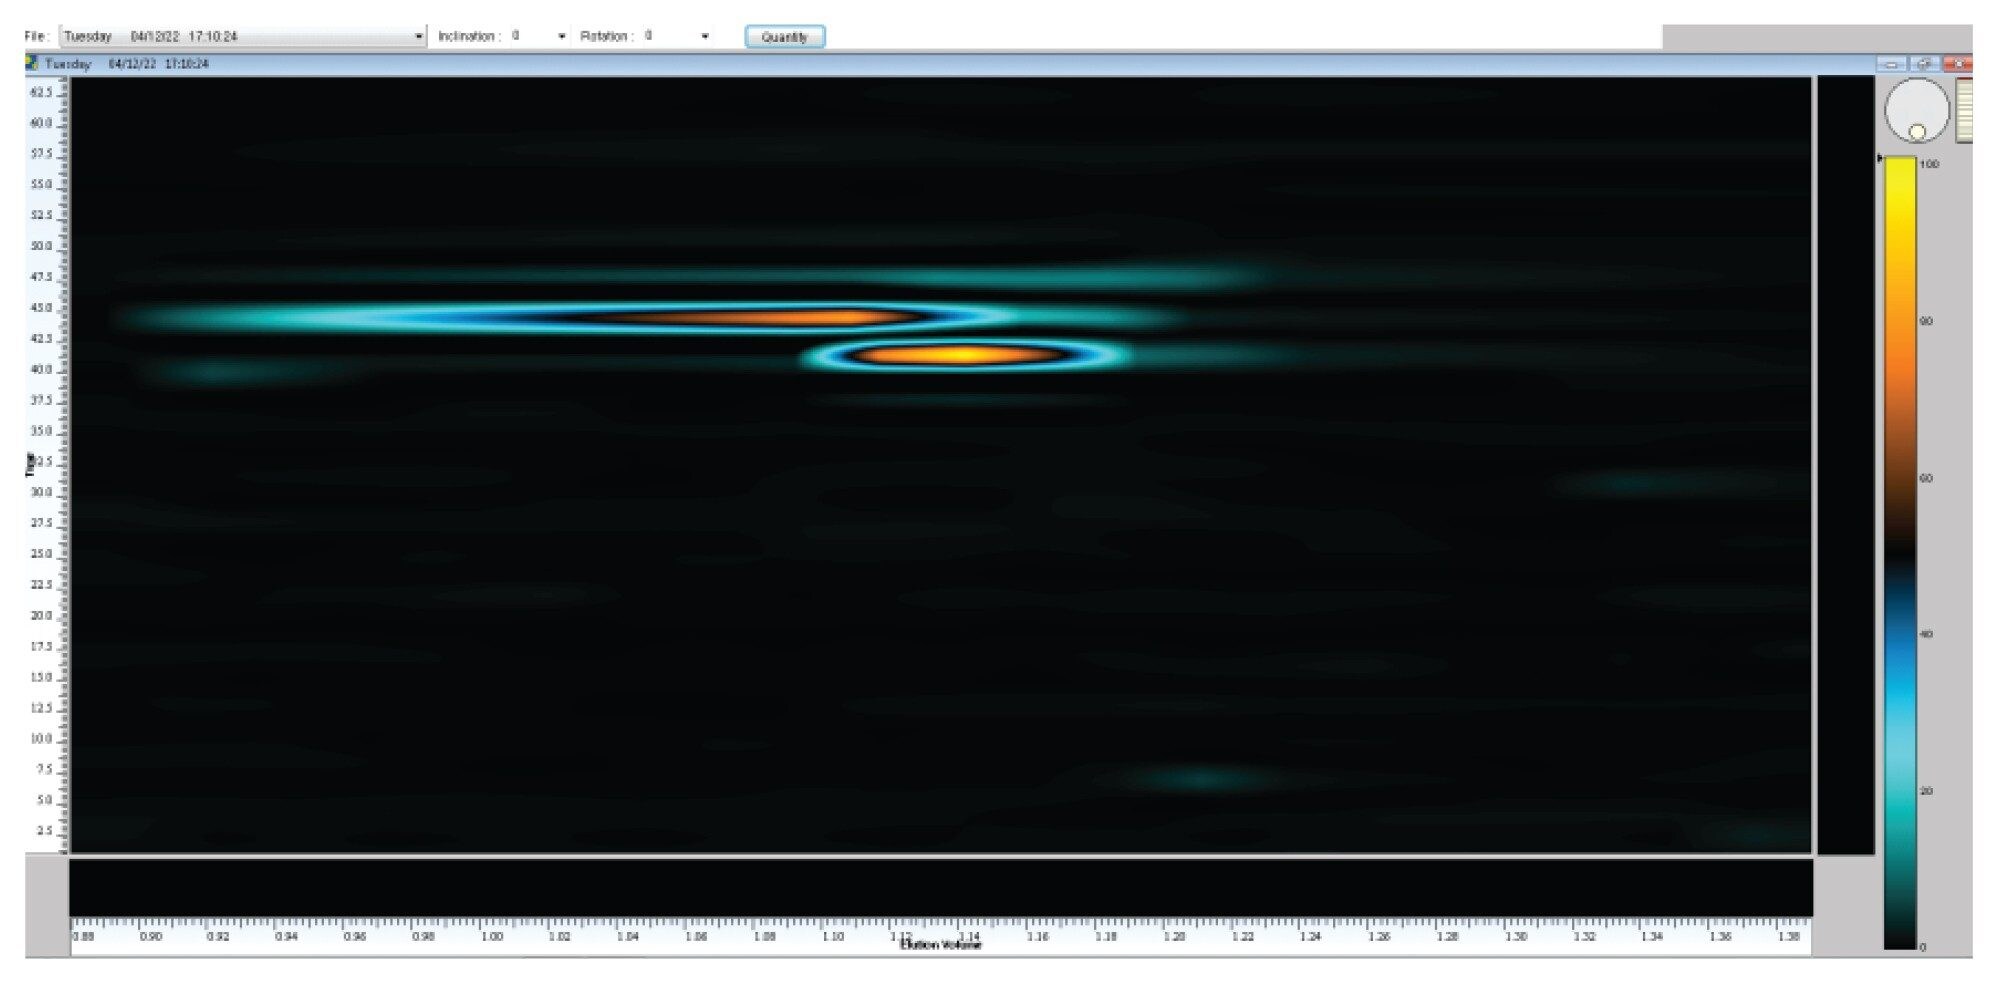 Figure 6. Contour plot of sample 2 displaying two separated populations that differ by chemistry and/or molecular weight. Plotted on the X-axis is the elution volume of the second-dimension against the elution time of the first-dimension run.
Figure 7 exhibits the contour plot of the straw sample. Although the pattern of the 2D separation of the straw appears to be similar to sample 2, the information gained from the contour plot in Figure 7 is not. Both populations have identical SEC elution volumes, hence their molecular weight are nearly identical, whereas sample 2 also exhibited two chemically different populations with differing SEC elution volumes and respective molecular weights. Such information would not be obtained from running SEC and gradient alone.
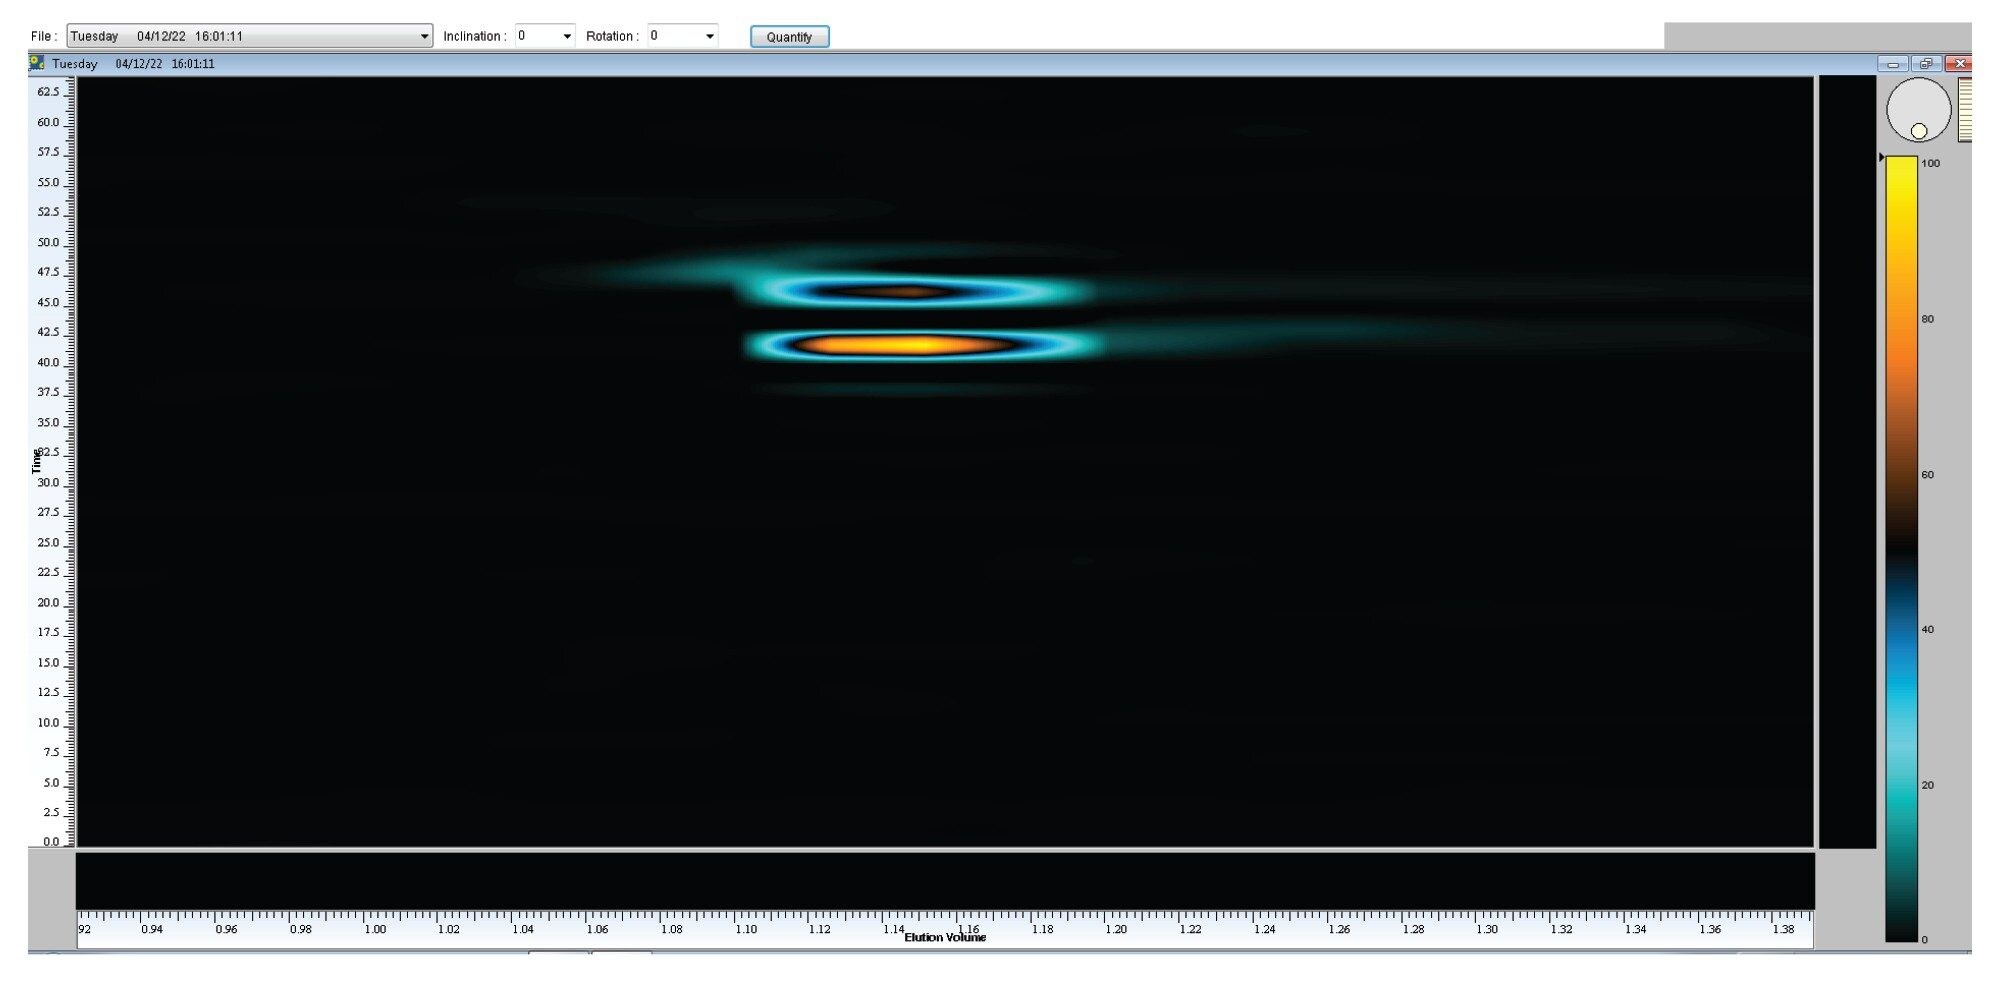 Figure 7. Contour plot of the straw displaying two separated populations that differ by chemistry. Plotted on the X-axis is the elution volume of the second-dimension against the elution time of the first-dimension run.
Conclusion
Analysis of several of the poly(3-PHBV) samples using a 2D-APC-ELSD method revealed significant differences between the samples that were not possible to determine with one-dimensional separations.
The co-elution that occurred in the individual size-based separation was successfully resolved by adding a chemistry-based separation in the first-dimension for sample 1. The subtle difference between sample 2 and the straw where the chemically different components of sample 2 had different molecular weights, whereas in the straw sample the molecular weights of chemically different components were nearly identical.
The features of WinGPC Software help to streamline the system setup for a full 2D analysis, saving time for the analyst on an time-bound instrument.
The APC solvent compatibility with halogenated solvents as well as typical non-polar solvents allowed for continuous operation without the needs to change to less aggressive solvents in between runs or idle time.
References
- Adamus G. Aliphatic Polyesters for Advanced Technologies – Structural Characterization of Biopolyesters with the Aid of Mass Spectrometry. Macromol. Symp. 2006 Jun;239:77–83.
- de Rijk T, van de Meer P, Eggink G. Biopolymers - Polyesters II Properties and Chemical Synthesis. Ed: Steinbuechel A. Wiley-VCH. 2001.
Featured Products
720007702, August 2022