Determination of Glyphosate, Aminomethylphosphonic Acid (AMPA), and Glufosinate in Drinking Water Using Direct Analysis by LC-MS/MS
Abstract
Reliable analytical methods are needed for detection, quantification, and identification of glyphosate, aminomethylphosphonic acid (AMPA), and glufosinate in drinking water. This application note describes a simple direct analysis method, based on liquid chromatography coupled to tandem mass spectrometry (LC–MS/MS), which avoids the need for lengthy and laborious derivatization and solid-phase extraction (SPE). Samples of water were injected directly into the LC-MS/MS system (ACQUITY™ Premier UPLC™ System with Xevo™ TQ Absolute Tandem Mass Spectrometer) using the Anionic Polar Pesticide Column. The performance of the method was successfully evaluated in three different types of drinking water. The extremely high sensitivity of the Xevo TQ Absolute System was demonstrated with reliable detection for all three analytes at concentrations as low as 10 ng/L (0.01 µg/L). The performance of the method was evaluated in-house and by an inter-laboratory study using spiked water samples. Results from both studies showed that the trueness of the method was between 82 and 110%. Close agreement was observed with the repeatability, within laboratory reproducibility, and between laboratory reproducibility, all being <16% RSD. The method is considered sensitive, specific, accurate, and suitable for the determination of these challenging analytes in a range of different types of drinking water, for checking compliance with regulatory limits, and to support studies focusing on human exposure.
Benefits
- The use of direct injection, without the need for derivatization, greatly simplifies the analytical workflow resulting in quicker analysis time, and the potential for greater sample throughput
- The single and interlaboratory studies demonstrate the performance of the method and provide users with confidence in the ease of implementation
- The method is suitable for testing these highly polar anionic pesticides in drinking water to check compliance against regulatory limits
Introduction
Glyphosate and glufosinate are active substances, widely used in pesticide formulations for agricultural and non-agricultural weed control and as pre-harvest desiccating treatments.1,2 Widespread glyphosate use has prompted multiple studies to determine if glyphosate is potentially harmful to ecological or human health. Although glyphosate is generally considered unlikely to cause acute toxicity in animals and humans, it is considered toxic to the aquatic environment. Literature about the carcinogenicity of glyphosate is divided. In 2015, the International Agency for Research on Cancer classified glyphosate as a probable human carcinogen, but the European Food Safety Authority, the European Chemicals Agency, and the US Environment Protection Agency have both concluded this classification is not supported.3–6
The widespread use of pesticides for agricultural and non-agricultural purposes has resulted in the presence of their residues in surface and groundwater resources. Pesticides can get in to surface waters by direct spraying close to a river or stream, run-off, and erosion from land into a waters course and via spray drift. Pesticides can also seep through soil into groundwater. Glyphosate and its principal metabolite aminomethylphosphonic acid (AMPA) have been frequently detected at low levels in surface and groundwater.7,8 Residues of these pesticides are not limited to intensive agricultural areas. It seems that glufosinate is highly mobile in soil and has the potential to contaminate groundwater. In many countries, public drinking water supplies are abstracted from surface water (e.g., rivers, lakes, and streams), and/or groundwater, which can become contaminated with these pesticides, contributing to chronic dietary exposure.
The presence of pesticides in surface, ground and drinking water is regulated in most parts of the world but the maximum limits vary hugely. For drinking water, the EU set a parametric value of 500 ng/L (0.5 µg/L) for total pesticides, and any relevant metabolites, and 100 ng/L (0.1 μg/L) for each individual pesticide and metabolite(s).9 Elsewhere drinking water standards for glyphosate are much higher. For example, Canada, USA, and Australia have maximumhave maximum acceptable concentrations of 280, 700, and 1000 µg/L, respectively.10
Accurate and reliable methods are required to monitor water samples for compliance with regulatory limits and to gain a more complete understanding of the presence of these compounds in the environment and in drinking water. The determination of residues of glyphosate, AMPA, and glufosinate is considered challenging because of their physicochemical properties: highly polar and ionic in nature. Typically, methods of analysis involve derivatization using 9-fluorenylmethylchloroformate (FMOC–Cl) before solid-phase extraction (SPE) and liquid chromatography (LC) determination, often coupled with MS/MS.11 FMOC derivatization decreases the polarity of the compounds allowing their effective extraction and concentration using reversed-phase sorbents and their determination by LC under the same separation mode. However, the derivatization step is slow and laborious, and the excess of derivatization reagent, borate buffer and/or the reaction by-products need to be removed before LC analysis. Direct analysis, without any derivatization, involves fewer steps, and is much quicker to perform. The success of the direct injection approach is very much dependent on the chromatographic performance (retention, peak shape, and stability) and the impact of any matrix effects from components in the water on the response of the analytes. The use of stable isotope analogues as internal standards helps to mitigate matrix effects.
Validation plays an important role in analytical chemistry to assess the performance characteristics of an analytical method. Within-laboratory method validation should be performed to provide evidence that a method is fit for purpose. For interlaboratory studies, a group of experienced laboratories receive identical portions from a homogeneous and stable test sample and conduct measurements following a strictly defined protocol to verify the consistent performance of the method.
This application note describes the extensive evaluation of method performance for the determination of glyphosate, AMPA, and glufosinate in a variety of different water samples. The method uses direct injection by LC-MS/MS, including the Anionic Polar Pesticide Column, on an ACQUITY Premier UPLC System coupled to the Xevo TQ Absolute Tandem Mass Spectrometer, using waters_connect™ for quantitation software.
Experimental
Sample Preparation
Samples of three different drinking waters (hard and soft drinking waters and mineral water) were collected from sites in the UK. Samples were stored and refrigerated prior to analysis. Test portions for analysis (15 mL) were transferred to 50 mL plastic centrifuge tubes. Analytical standards of glyphosate, aminomethylphosphonic acid (AMPA), and glufosinate-ammonium were used to prepare a working solution to create calibration standards and for spiking the different water samples. The calibration standards were prepared over the range 10 to 200 ng/L (0.01–0.2 µg/L). Glyphosate-13C2,15N, AMPA-13C,15N, D2, and glufosinate-D3 were used as internal standards. EDTA (200 µL of 2 g/L) was added, and the contents of the samples mixed before an aliquot was transferred to a polypropylene vial ready for LC-MS/MS. For mobile phases all additives and solvents were LCMS grade or equivalent.
LC Conditions
|
LC system: |
ACQUITY Premier UPLC System with BSM and FTN SM |
|
Vials: |
Polypropylene 12 x 32 mm Snap Neck Vial, with Cap and Preslit PTFE/Silicone Septum, 700 µL (p/n: 186005222) |
|
Column: |
Anionic Polar Pesticide Column (5 µm, 2.1 x 100 mm) (p/n: 186009287) |
|
Column temperature: |
50 °C |
|
Sample temperature: |
10 °C |
|
Injection volume: |
50 µL |
|
Mobile phase A: |
0.9% formic acid in water |
|
Mobile phase B: |
0.9% formic acid in acetonitrile |
|
Divert valve: |
0–1.5 min to waste |
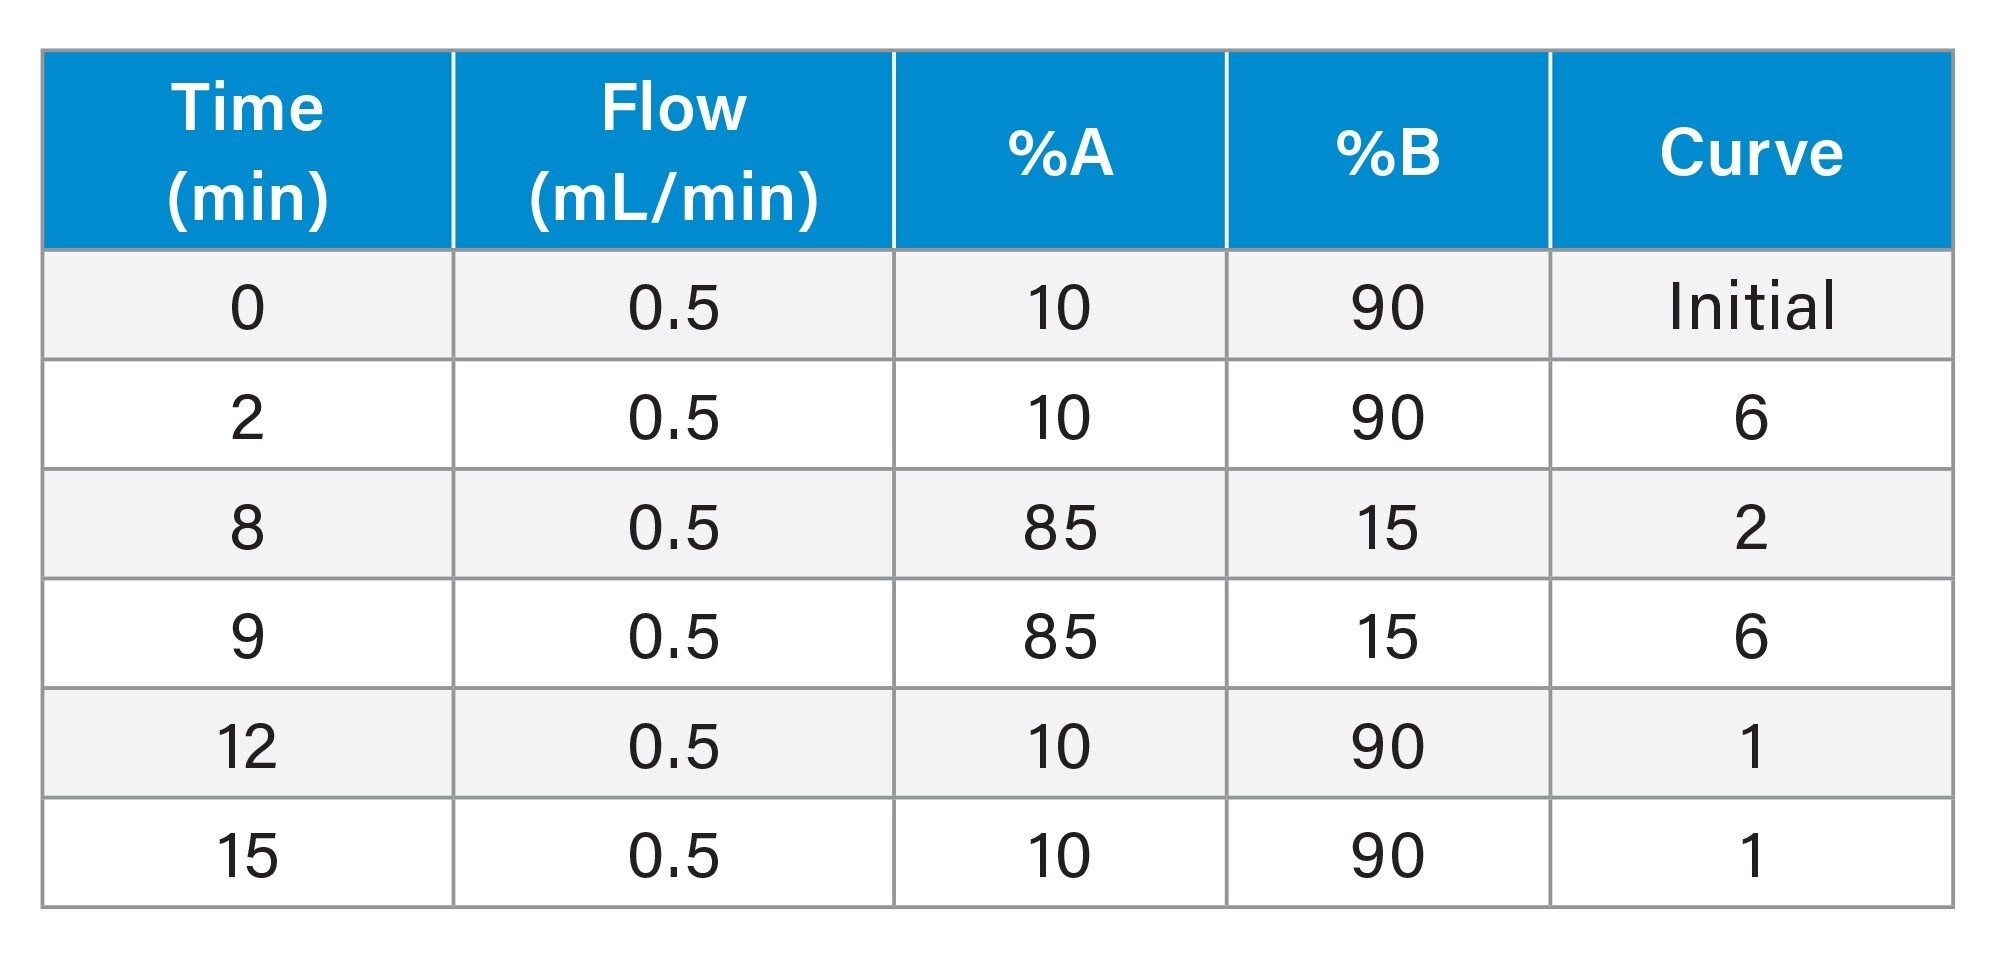
Gradient Table
MS Conditions
|
MS system: |
Xevo TQ Absolute |
|
Ionization mode: |
Electrospray (negative ion mode) |
|
Capillary voltage: |
2.3 kV |
|
Source temperature: |
150 °C |
|
Desolvation temperature: |
600 °C |
|
Desolvation gas flow: |
800 L/hr |
|
Cone gas flow: |
150 L/hr |
|
Cone voltage: |
15 V |
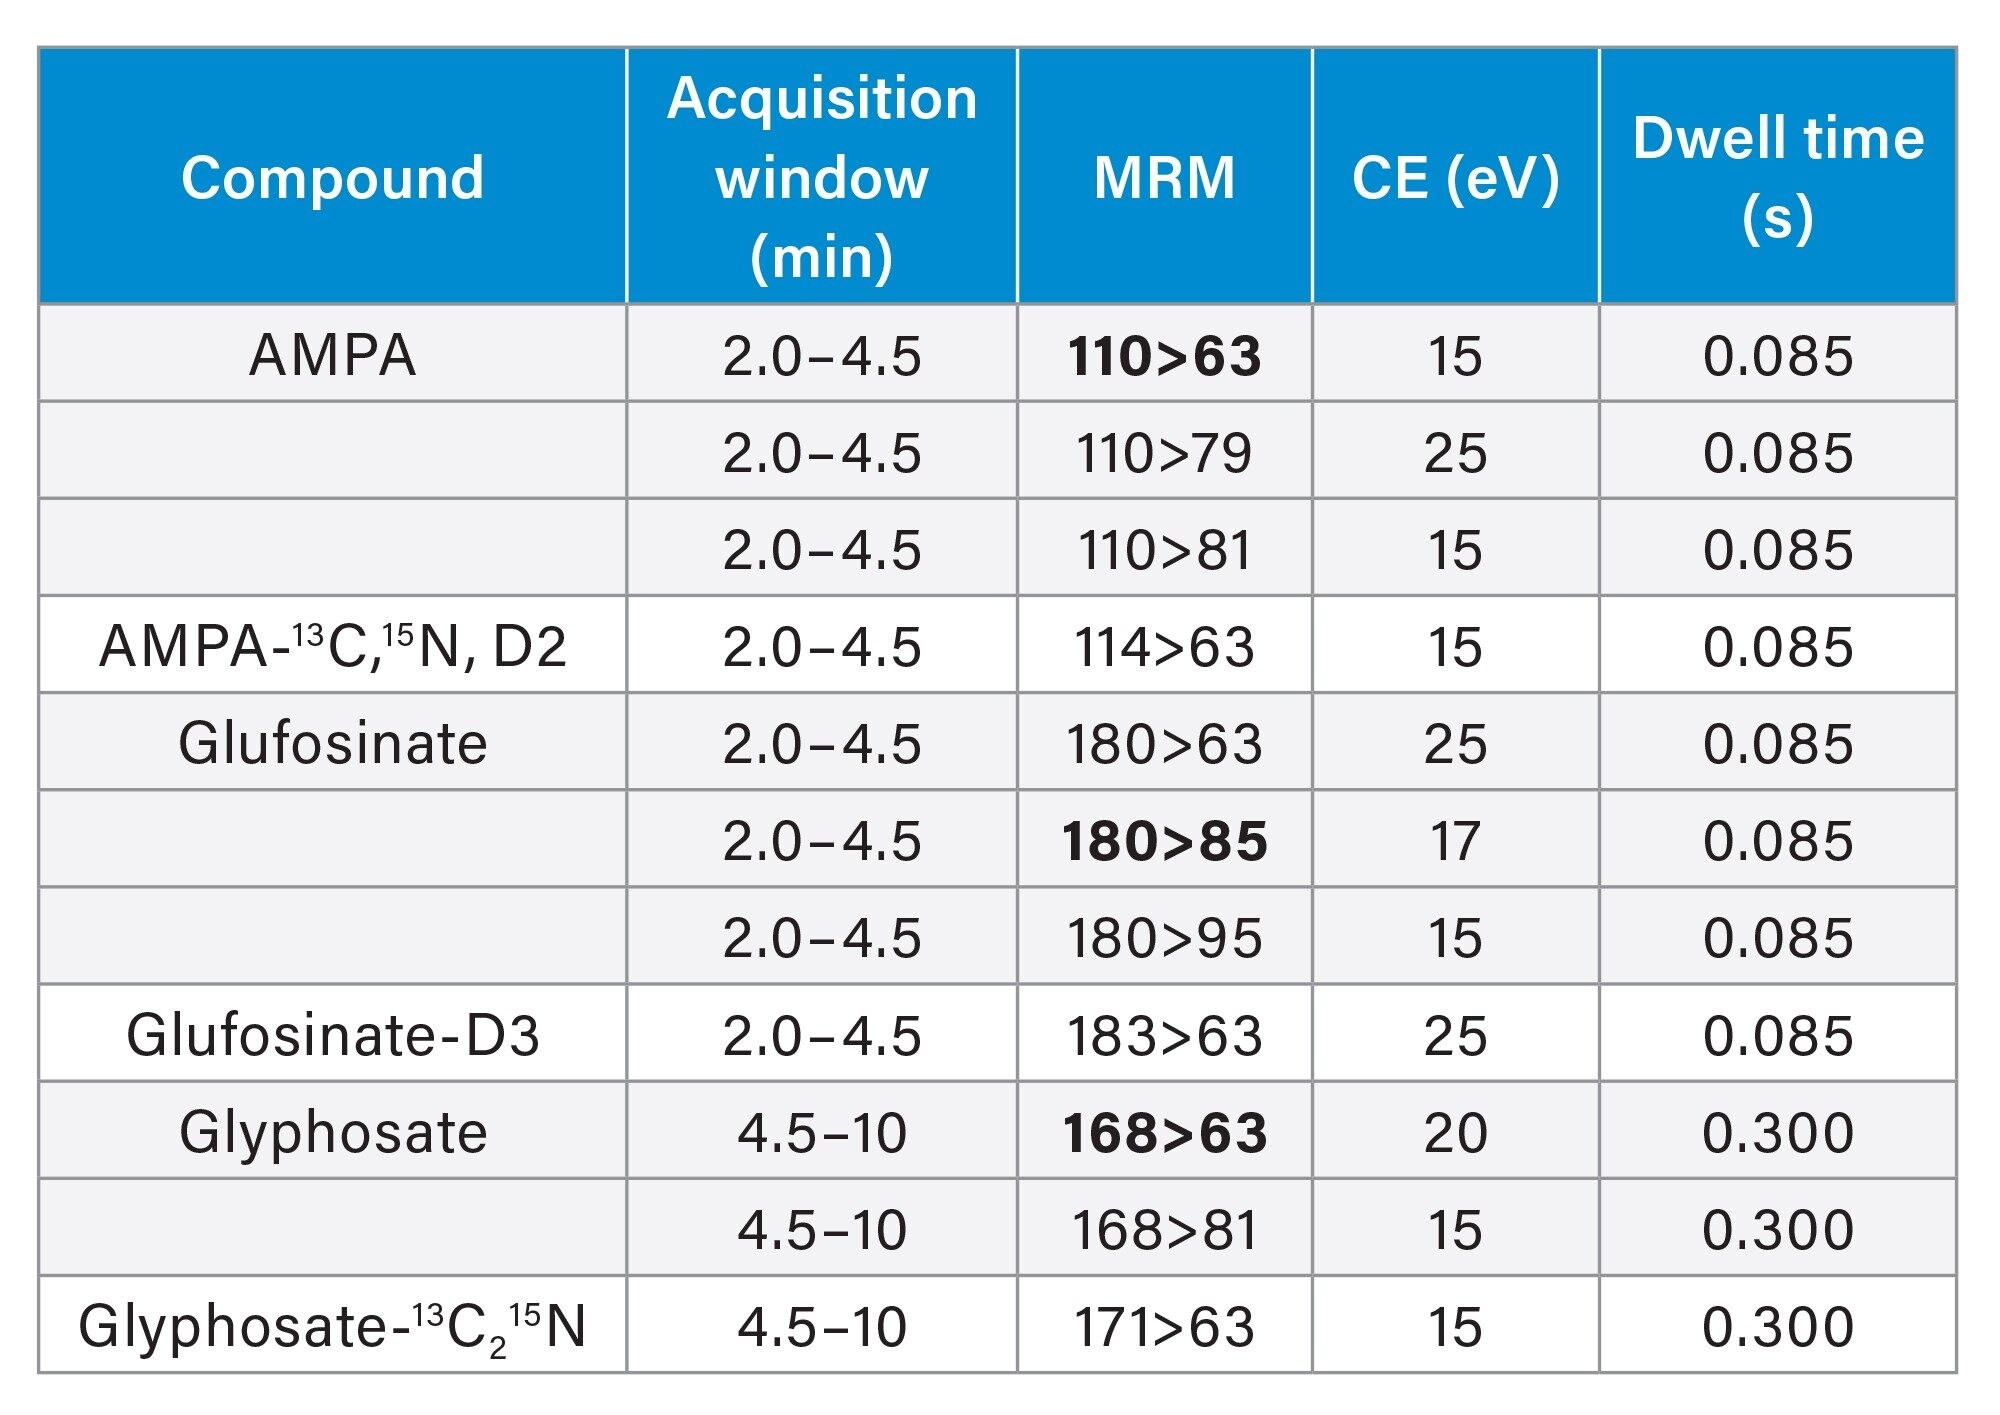
MRM Method (quantitative transitions given in bold)
Data Management
|
MS acquisition software: |
waters_connect for quantitation |
|
Quantitation software: |
waters_connect for quantitation |
Method Validation
Single laboratory validation was performed by replicate analysis of spiked drinking water samples. The following factors were assessed: selectivity, sensitivity, calibration graph characteristics, trueness, within-laboratory repeatability (pooled RSDr), and within-laboratory reproducibility (RSDR), also called intermediate precision. For the single laboratory validation, trueness, pooled RSDr, and RSDWLR were determined from the replicated analysis (n=11) of spikes prepared at 20, 60, and 100 ng/L in three types of water (hard and soft drinking waters and mineral water), and analyzed on three separate days. The multi-laboratory validation was carried out by 9 laboratories’ analysis of spiked mineral water samples. Trueness, pooled RSDr, and between laboratory reproducibility (RSDWLR) were determined from the replicate analysis (n=7) of spikes prepared at 20 and 60 ng/L.
Results and Discussion
Chromatography
The method provided excellent chromatographic retention and peak shape for these highly polar, anionic compounds. The method demonstrated retention complying with the requirements in the ISO 21253-2:2019 standard, water quality as applied to multi-compound class methods, exhibited Gaussian chromatographic peak shapes and good retention time stability throughout the study (9 days, 500 injections), independent of the type of drinking water analyzed.12
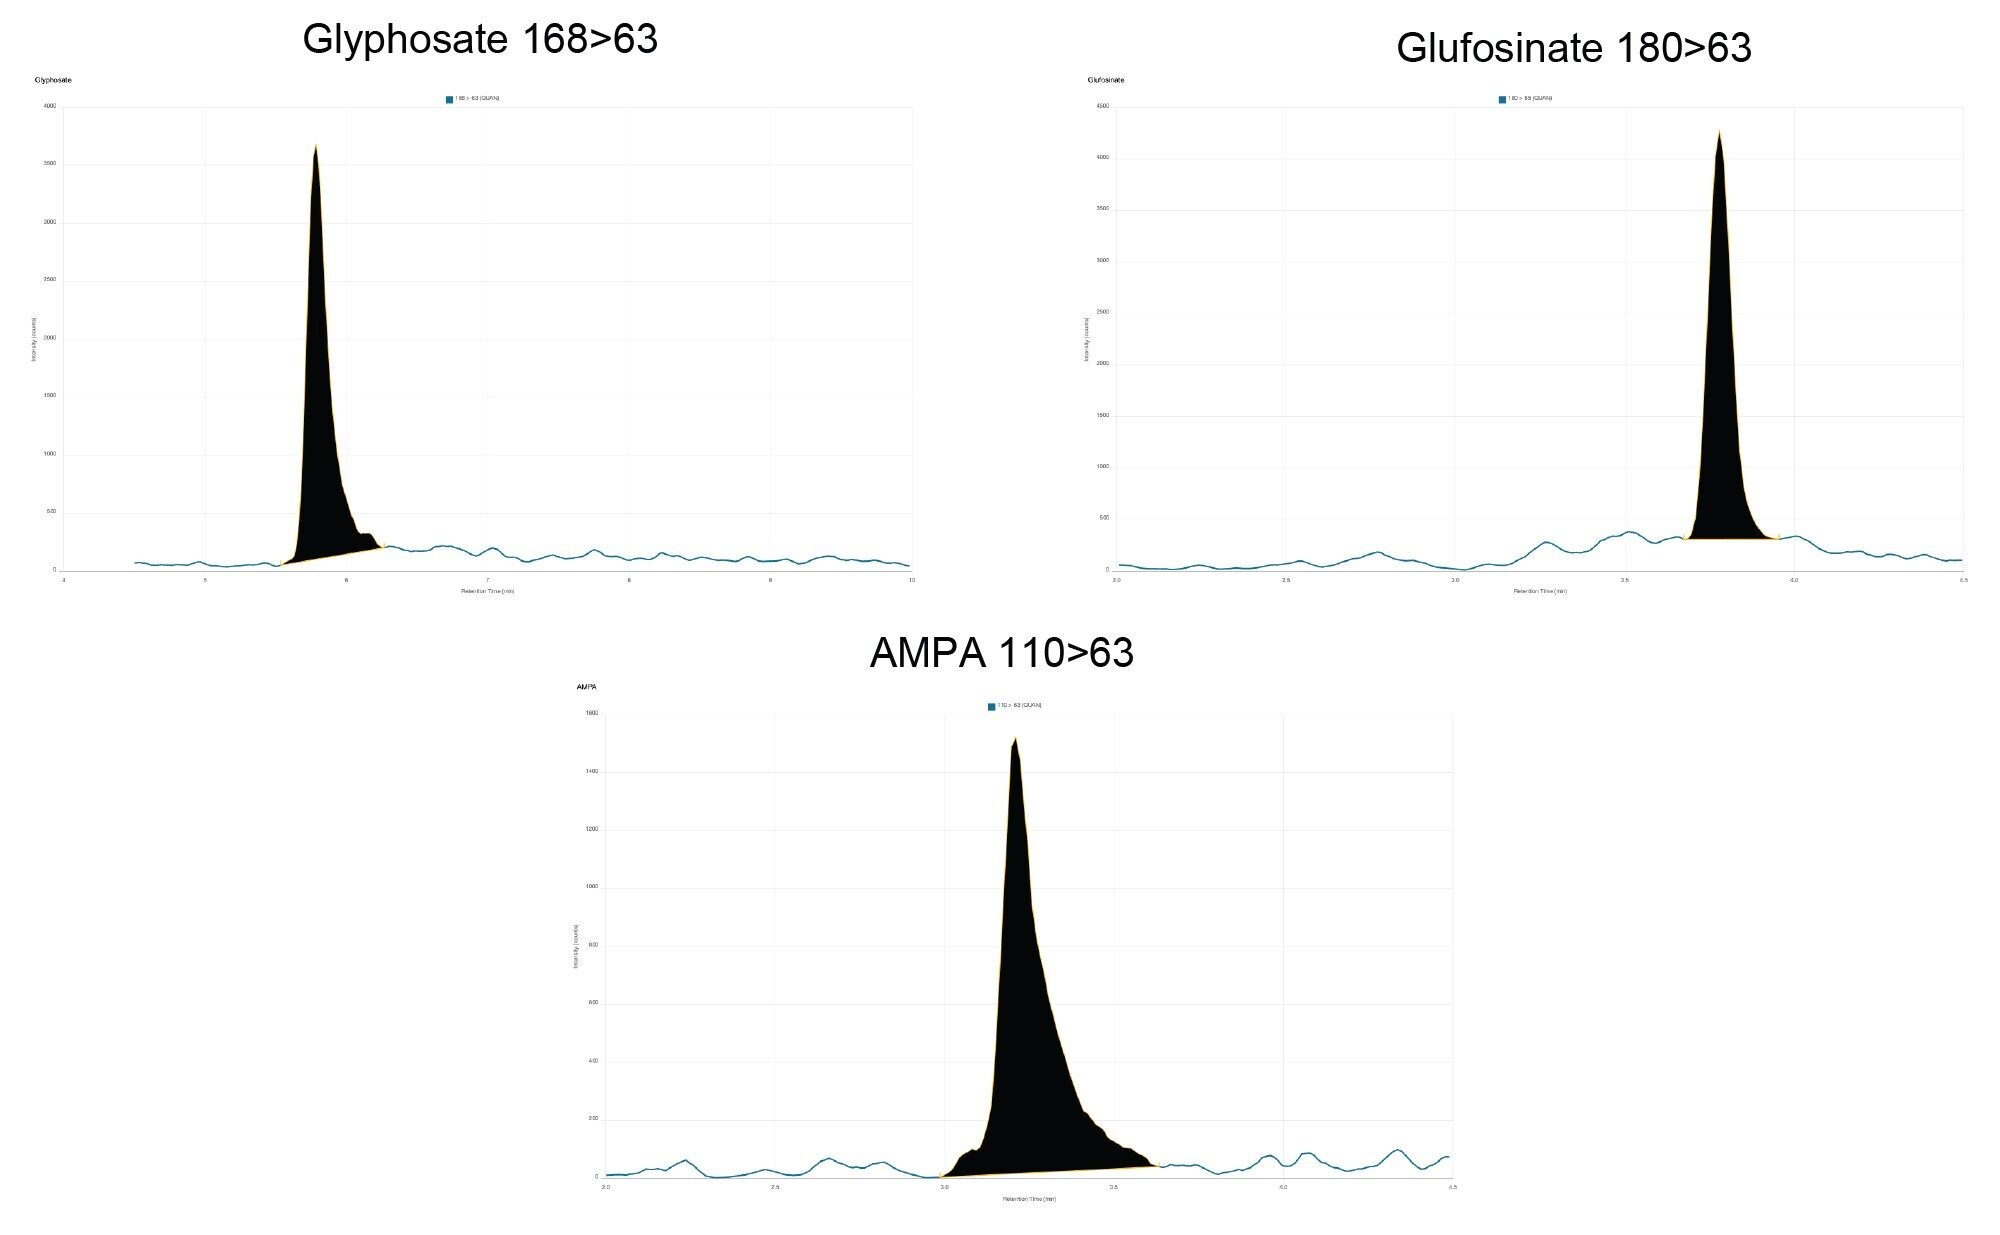 Figure 1. Typical chromatograms showing the anionic polar pesticides from analysis of York drinking water spiked at 20 ng/L.
Sensitivity
Figure 1 shows typical chromatograms for the three highly polar, anionic compounds, from the analysis of York drinking water spiked at 20 ng/L, which shows that the method is typically capable of detection of these analytes in drinking water at lower concentrations, suitable for checking compliance with the 100 ng/L parametric limit set in the EU Drinking Water Directive (DWD).
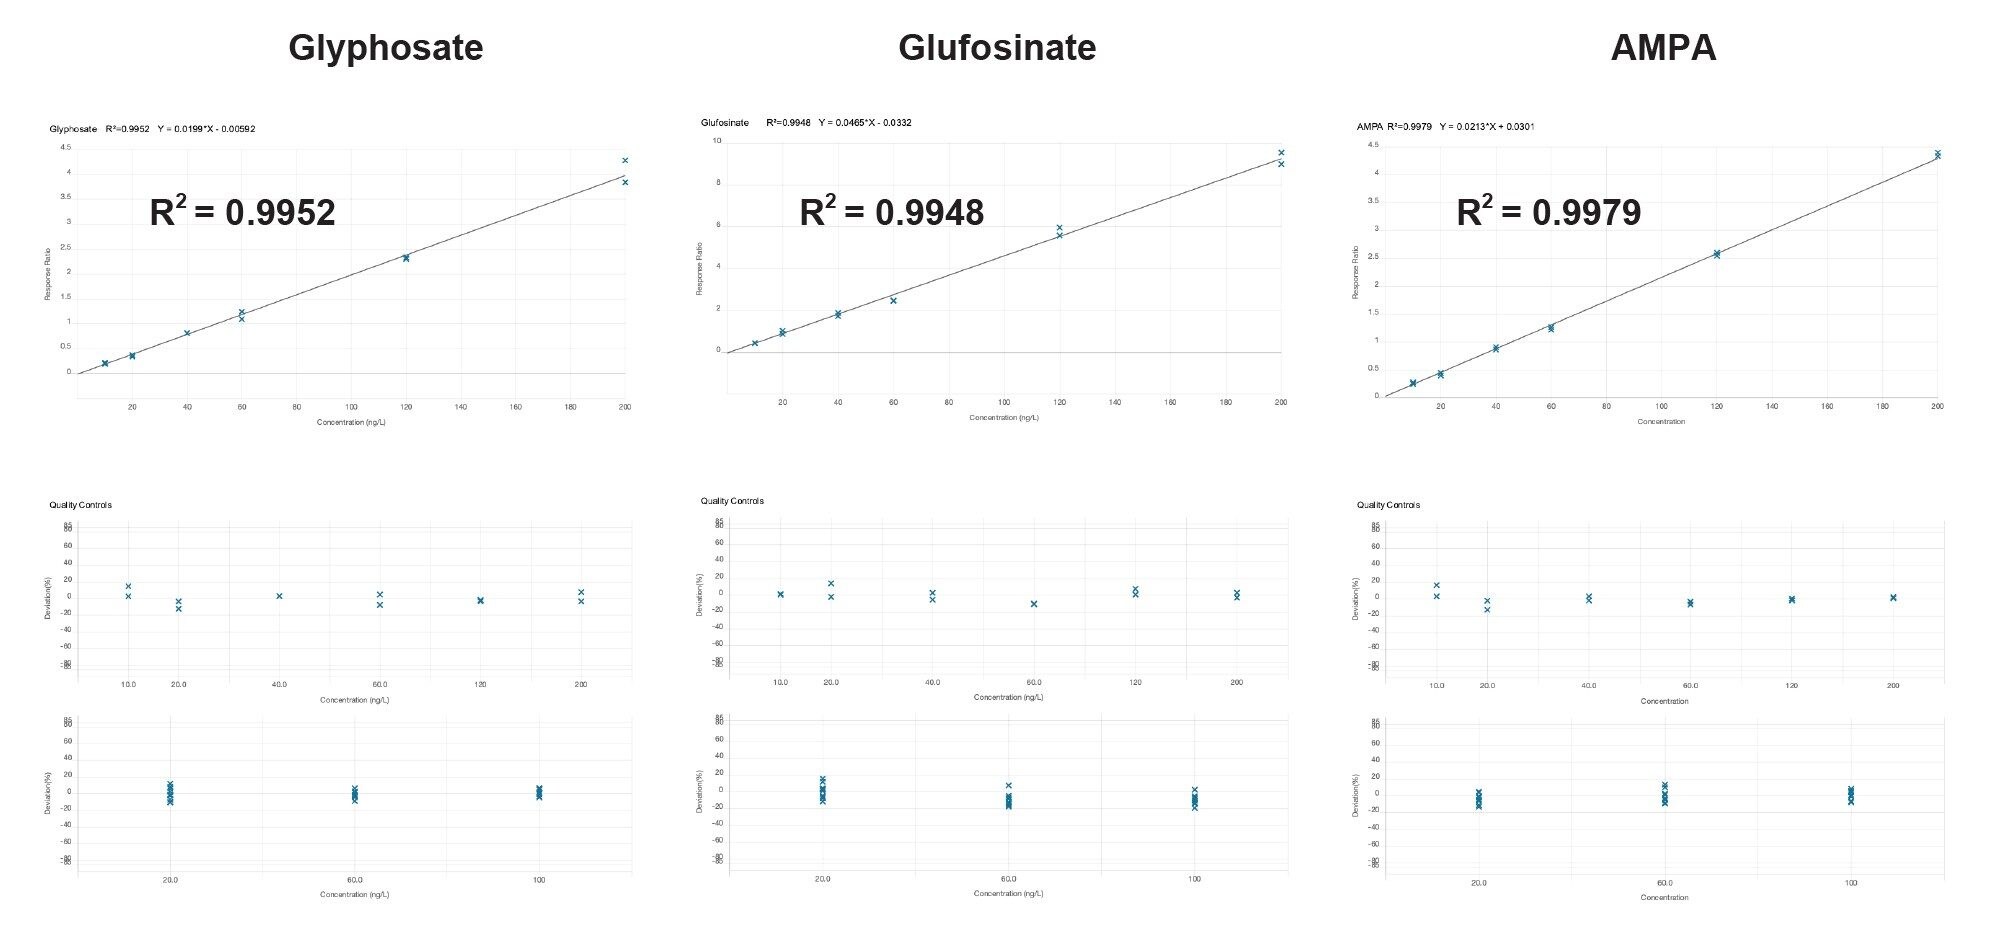 Figure 2. Typical calibration graphs for the anionic polar pesticides over the range 10–200 ng/L in Buxton mineral water.
Selectivity, Identification, and Calibration Criteria
Samples representative of the different types of water analyzed were prepared as blanks. No signal was detected in the blanks that could lead to detection of false reporting of non-compliant samples or impact on the sensitivity of the method. The two transitions for each analyte gave peaks with ion ratios and retention times within the tolerances given in the ISO 21253-1:2019 standard (part 1), when compared with the standards.13 Bracketed, 6-point calibration curves were prepared for each analyte in mineral water, using the stable isotope analogues as internal standards, and acquired on each day. Linear fit with 1/x weighing was applied and all correlation of determination (R2) values from the calibration graphs (10–200 ng/L) were >0.98, with individual residuals all <20%, demonstrating reliable quantification to check compliance with the parametric limit set in the EU DWD. Examples of typical calibration curves are given in Figure 2.
 Figure 3. A summary of the mean measured recovery values for all three spiking levels in each water sample, with associated repeatability given by the error bars.
Single Laboratory Validation
The results demonstrated good accuracy for the quantification of all three compounds in drinking water (Table 1). The accuracy was determined from the measured values for concentration in the spikes, in all three drinking waters, at 20, 60, and 100 ng/L, after adjustment using the appropriate internal standard. Pooling the results from all three water samples, trueness, determined as measured recovery, was shown to be between 96 and 102%, repeatability within the laboratory (pooled RSDr) between 7.9 and 11% and values for reproducibility within the laboratory over 3 days (RSDWLR) were between 7.6 and 15%. These values are within the acceptance criteria set out in the ISO 21253-1:2019 standard (part 2), when using internal standards: “yield” (measured recovery) between 70 and 120% and intermediate precision (RSDr) ≤20%.13 Figure 3 shows a summary of the mean measured recovery values for each water sample, with associated repeatability.
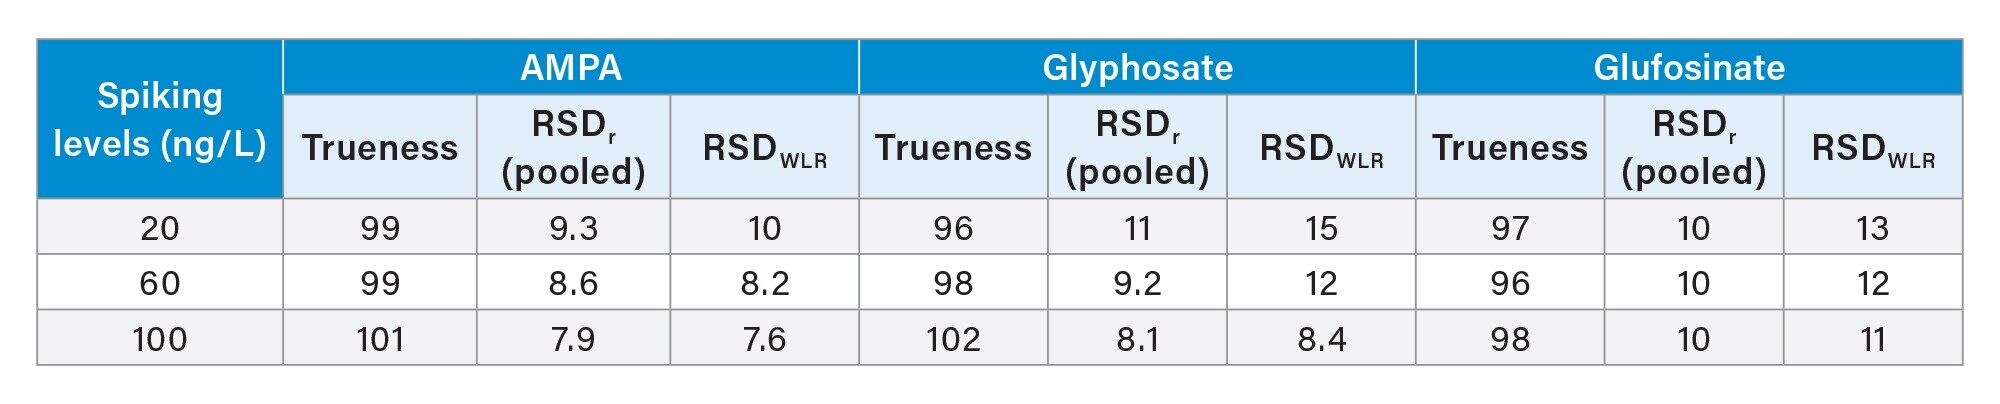 Table 1. A summary of the results from the single laboratory validation study.
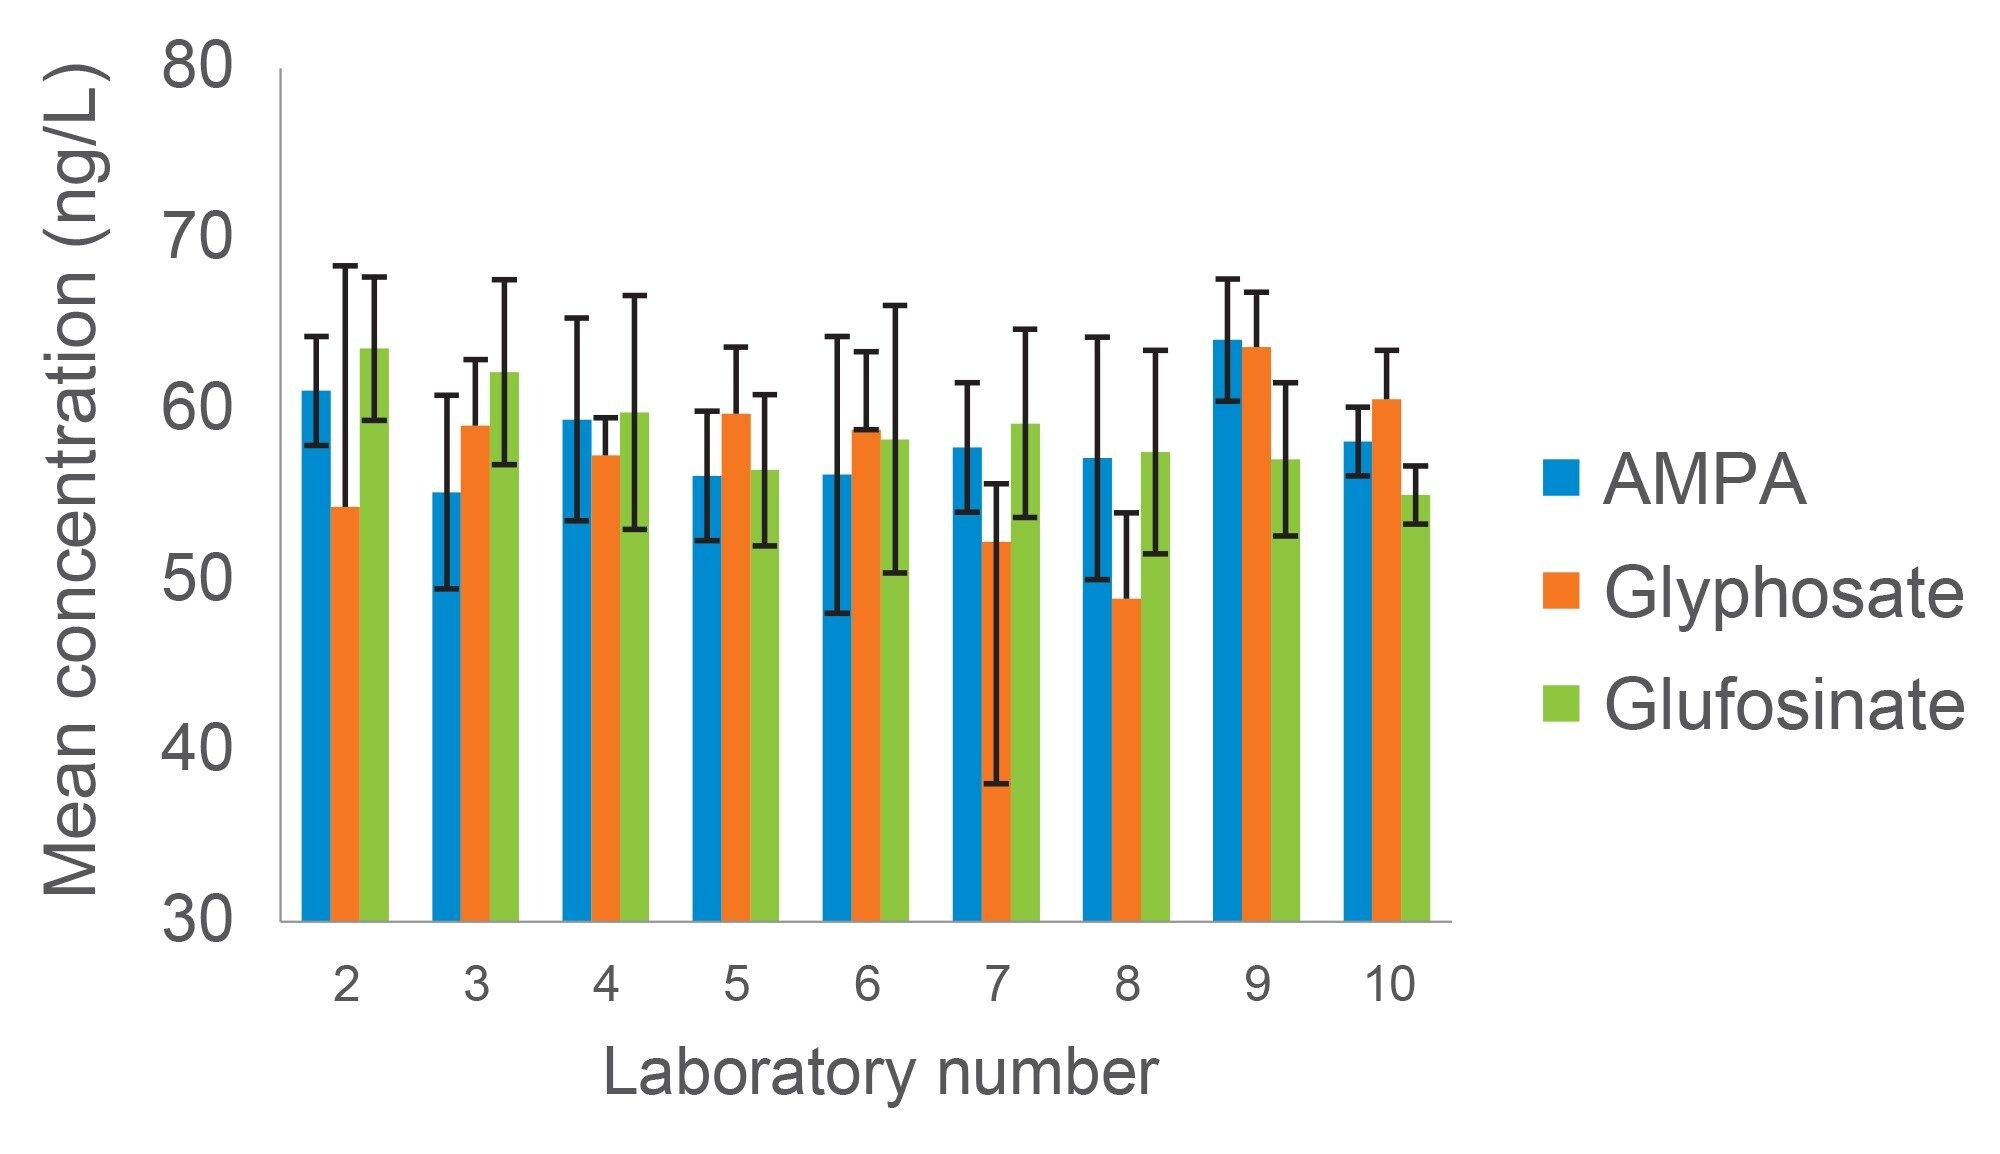 Figure 4. A summary of the mean measured recovery values for all three spiking levels in each water sample, with associated repeatability given by the error bars.
Multi-laboratory Validation
The accuracy of the method was determined using the same protocol used in the single laboratory validation but applied to the analysis by 9 laboratories of a single mineral water sample, spiked at 2 levels. No outliers were removed from the data before statistical analysis. The results verified the accuracy of the method as applied to the analysis of one mineral water (Table 2). Figure 4 shows a summary of the mean measured recovery values from each laboratory, with their associated within laboratory repeatability. Each laboratory reported trueness values between 82 and 110% and repeatability (RSDr) between 2.6 and 22%. Values for overall repeatability within the laboratory (pooled RSDr) and for reproducibility between the laboratories (RSDBLR) were within the range 11 to 14% and 10 and 16%, respectively. These values are all within the acceptance criteria set out in the ISO 21253-1:2019 standard (part 2), as referred to in the previous section.
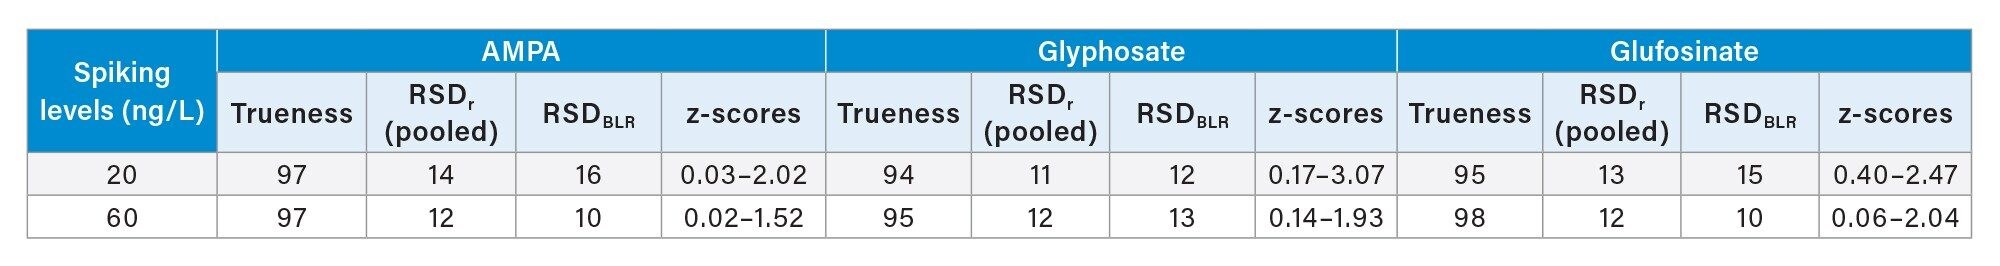 Table 2. A summary of the results from the multi-laboratory validation study.
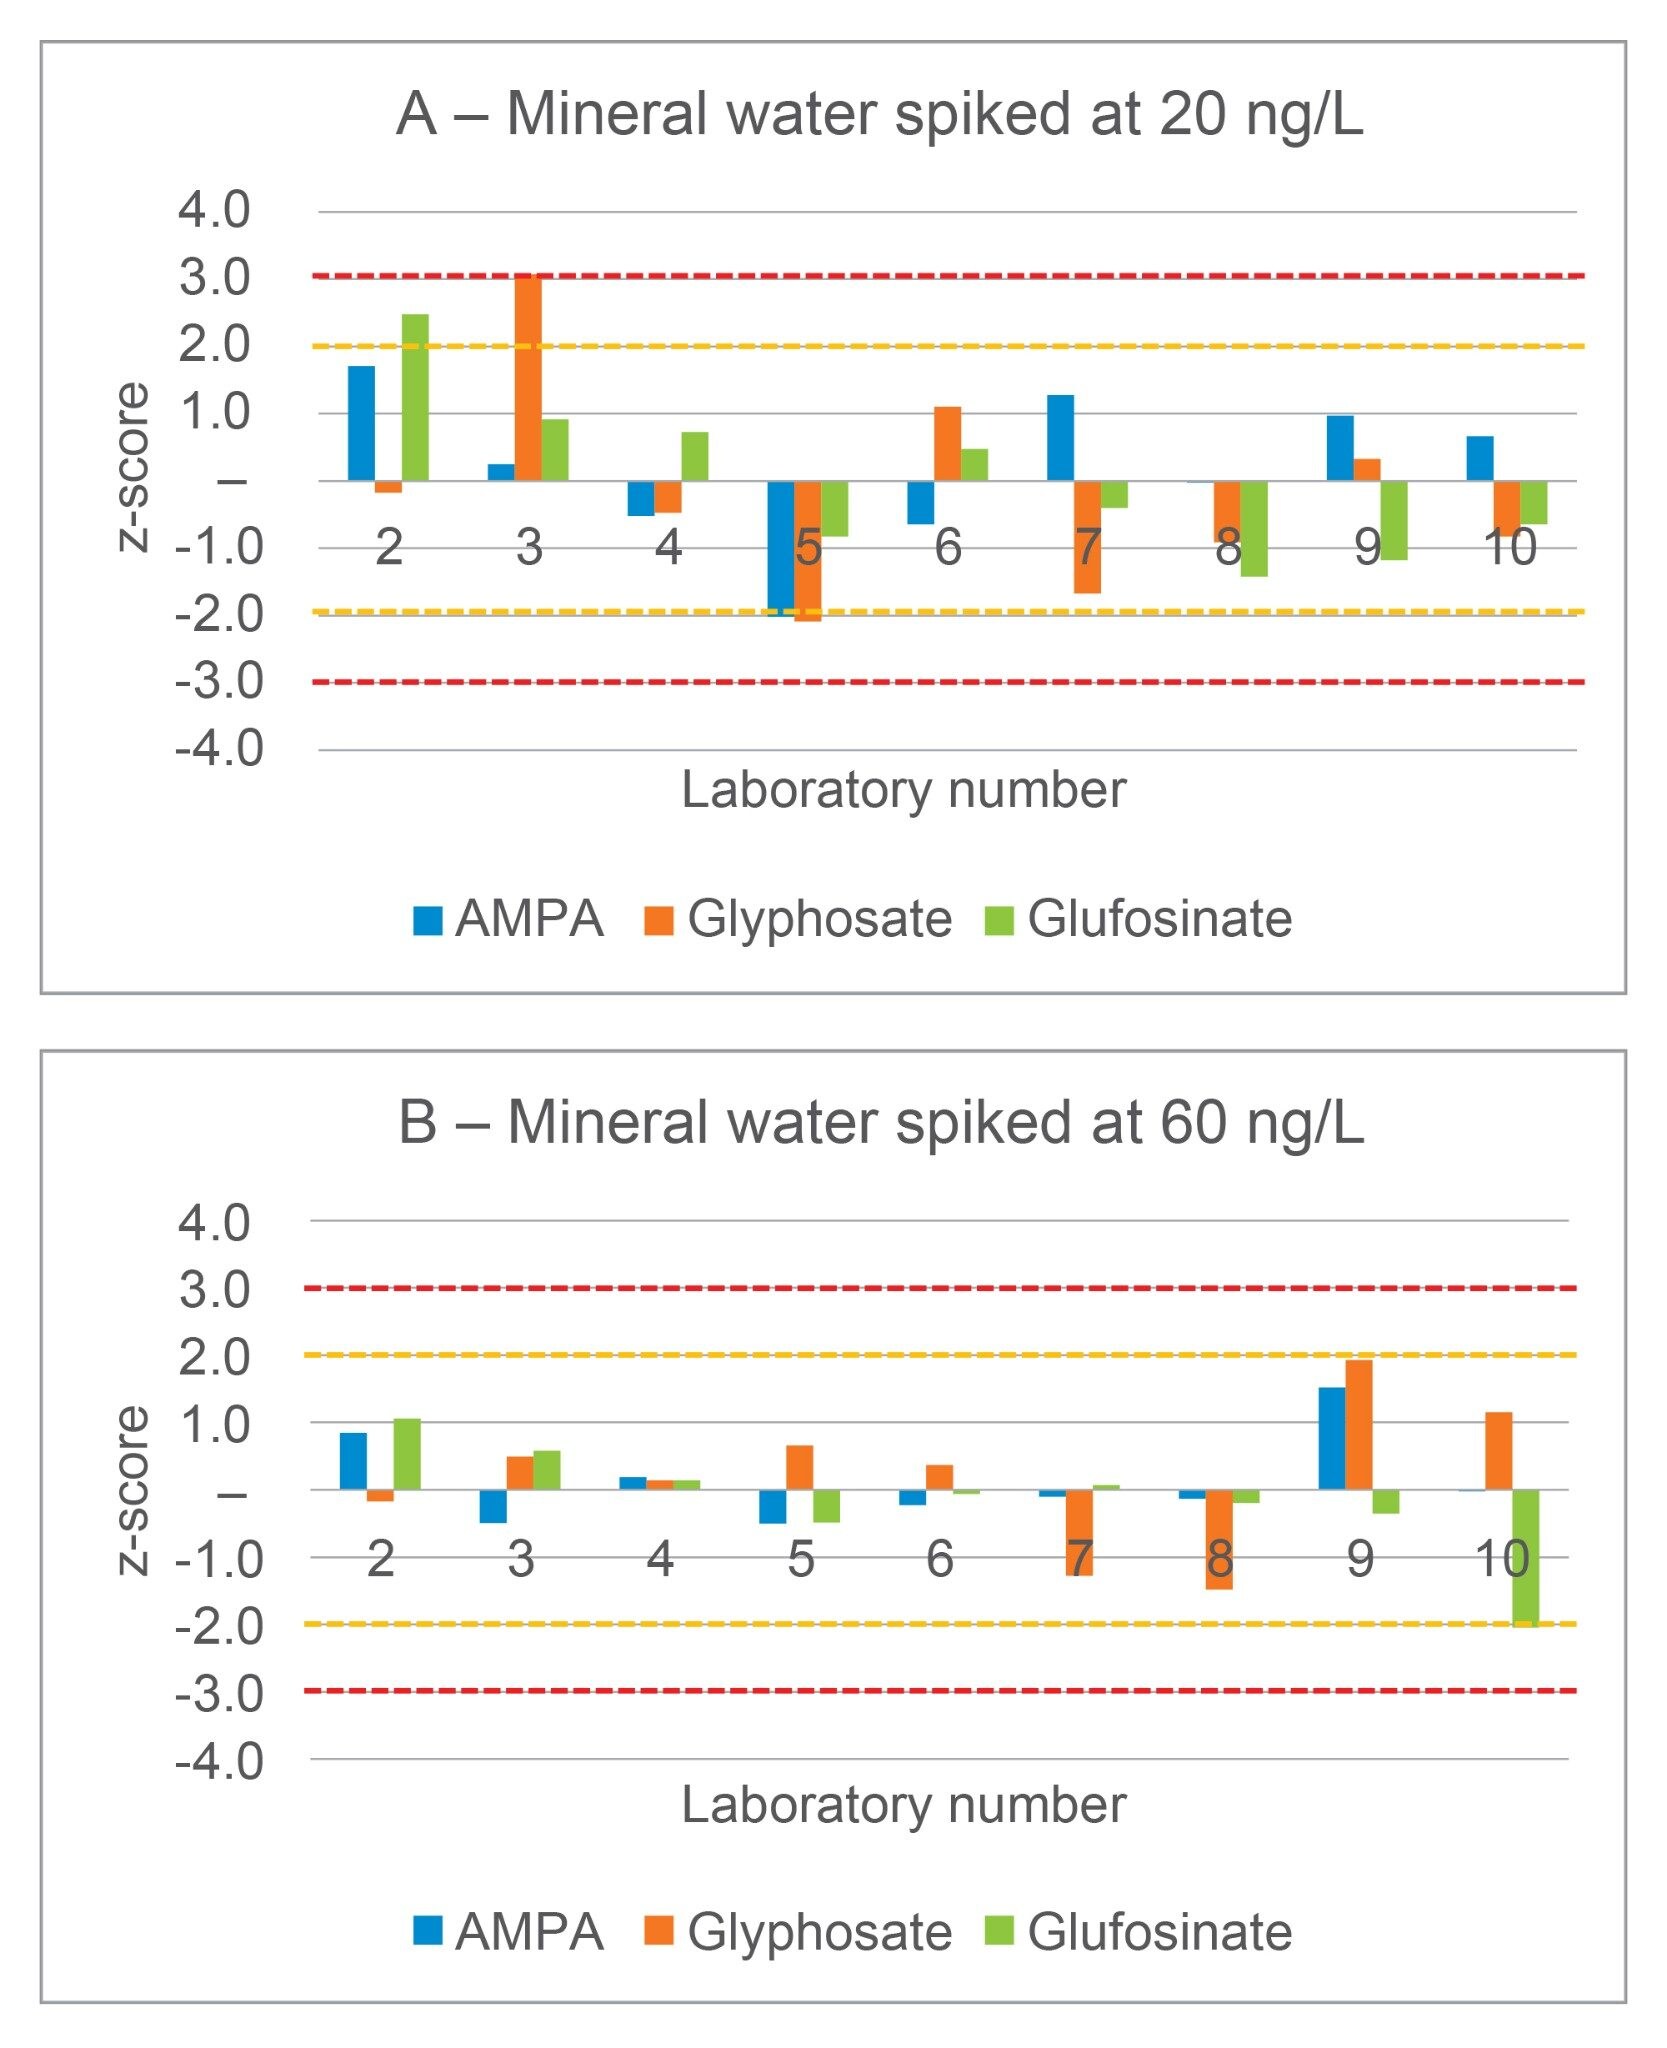 Figure 5. Bar charts showing the z-scores for each laboratory for all three analytes from the analysis of low-level spike at 20 ng/L (A) and high-level spike at 60 ng/L (B).
To facilitate further evaluation of the data, z-scores were calculated for each reported laboratory result. The z-score is the difference between the value reported by the laboratory and the assigned value, corrected for the variability. The results have been presented as two charts in Figure 5. Almost all the laboratories reported acceptable results with z-scores lower than 2. Three laboratories reported questionable results for the low-level spike and 1 laboratory for the high-level spike. There was only one unsatisfactory result: a z-score for glyphosate at 20 ng/L of 3.07.
Conclusion
This application note describes the extensive evaluation of performance for a simple direct analysis method for the determination of glyphosate, AMPA, and glufosinate in drinking water. Samples of water were injected directly into the Xevo TQ Absolute Tandem Quadrupole Mass Spectrometer coupled to an ACQUITY Premier LC System using the Anionic Polar Pesticide Column. This approach avoids the need for lengthy and laborious sample preparation and reduces potential errors associated with derivatization-based methods. The method allowed for reliable determination down to concentrations well below the DWD parametric value of 0.1 µg/L. The performance of the method was successfully evaluated in a series of different types of drinking water. This method has been demonstrated as suitable for monitoring the presence of these highly polar, anionic pesticide residues at very low levels in drinking water and could therefore be used to check compliance with regulatory limits and to support studies focusing on human exposure.
References
- Richmond M. Glyphosate: A review of its global use, environmental impact, and potential health effects on humans and other species. J Environ. Stud. Sci. (2018) 8:416–434.
- Takano HK and Dayan FE. Glufosinate-ammonium: a review of the current state of knowledge. Pest. Manag. Sci. (2020) 76:3911–3925.
- IARC. IARC monographs on the evaluation of carcinogenic risks to humans, volume 112. Glyphosate. 2016.
- EFSA. Conclusion on the peer review of the pesticide risk assessment of the active substance glyphosate. EFSA Journal (2015) 13(11):4302–4408.
- ECHA. Committee for Risk Assessment RAC Opinion proposing harmonised classification and labelling at EU level of glyphosate (ISO); N-(phosphonomethyl)glycine EC Number: 213-997-4 CAS Number: 1071-83-6 CLH-O-0000001412-86-149/F. 2017.
- US EPA. Revised Glyphosate Issue Paper: Evaluation of Carcinogenic Potential. D444689. 2017.
- Duke, S. Glyphosate: Environmental fate and impact. Weed Sci. (2020) 68(3):201–207.
- Carretta L et al. Review of studies analysing glyphosate and aminomethylphosphonic acid (AMPA) occurrence in groundwater. Environ. Rev. (2020) 30(1):88–109.
- Directive (EU) 2020/2184 of the European Parliament and of the Council of 16 December 2020 on the quality of water intended for human consumption. OJ L 435, 23.12.2020, p. 1–62.
- Wen-Tien T. Trends in the Use of Glyphosate Herbicide and Its Relevant Regulations in Taiwan: A Water Contaminant of Increasing Concern. Toxics (2019) 7(1):4.
- Analysis of Glyphosate, AMPA, and Glufosinate in Water Using UPLC-MS/MS. Waters Application Note. 720006246. 2018.
- ISO 21253-2:2019. Water quality. Multi-compound class methods – Part 2: Criteria for the quantitative determination of organic substances using a multi-compound class analytical method. 2019.
- ISO 21253-2:2019. Water quality. Multi-compound class methods – Part 1: Criteria for the quantitative determination of organic substances using a multi-compound class analytical method. 2019.
720008052, September 2023