In this work, 2D-LC/MS was used to assess monoclonal antibody (mAb) titer and confirm both product mass and glycosylation profile. The simplicity of data collection on a single platform configured for 1D titer measurements and 2D product profiling with MS detection is demonstrated.
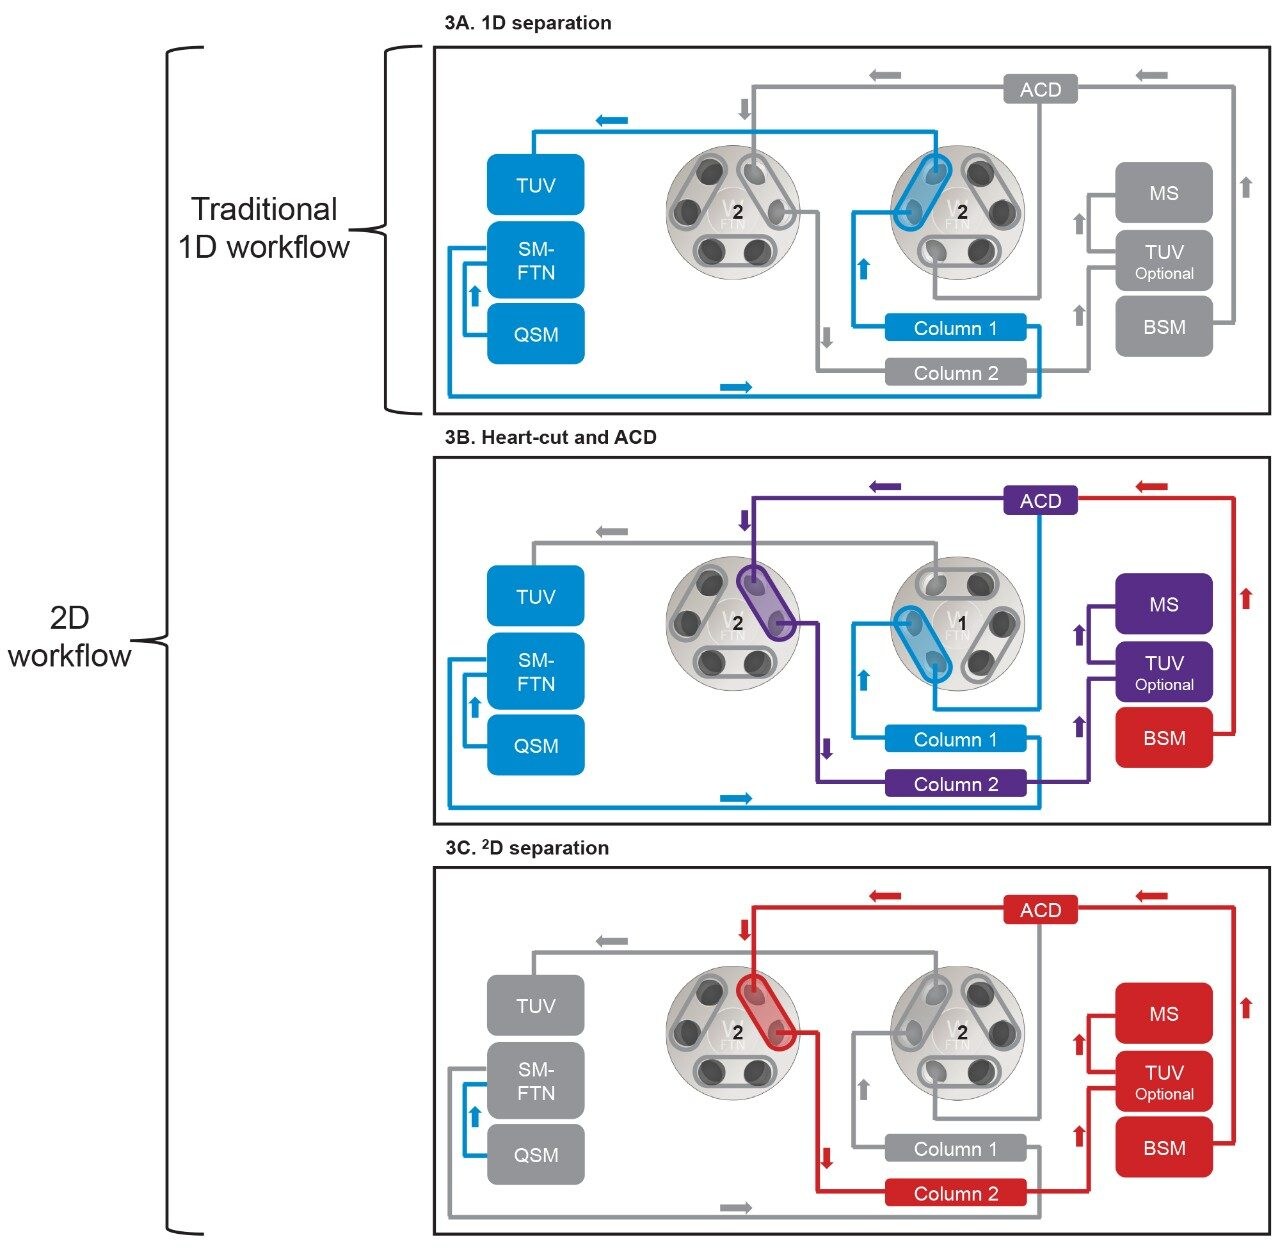
Two-dimensional liquid chromatography (2D-LC) is used in many applications throughout the biopharmaceutical industry. As therapeutics become more complex and new modalities are being explored, there is a greater performance demand placed on analytical methods and instrumentation to provide high quality data for informed decision-making. Industry initiatives have also driven additional requirements for improved method robustness and operation under regulatory compliance. To address these evolving demands, 2D-LC with high-resolution mass spectrometry operating within compliant-ready UNIFI informatics is demonstrated. Protein A affinity chromatography coupled to reversed-phase mass spectrometry (Pro A-RPLC-MS) using a single heart-cut was used to assess titer and primary structure attributes. Experimental design was intended to be straightforward and was developed from several literature reports that have successfully coupled Pro A to various second dimension analyses.1–3
Protein A affinity chromatography with optical detection is traditionally used for quantitation of Fc-containing molecules through purification from cell culture material. On an analytical scale, the assay is important for clone selection, where the highest producing cell lines are the most desirable. Once high titer is confirmed, additional assays that evaluate product quality attributes are also employed. In a general approach, samples of therapeutic molecules are purified from cell culture using preparative-scale chromatography or plate-based capture techniques, and one-dimensional (1D) assays such as size-exclusion chromatography (SEC), ion-exchange chromatography (IEX), and reversed-phase intact mass analysis would be run using the purified material. By using two-dimensional (2D) approaches, the need for excessive sample handling and downstream processing is eliminated.
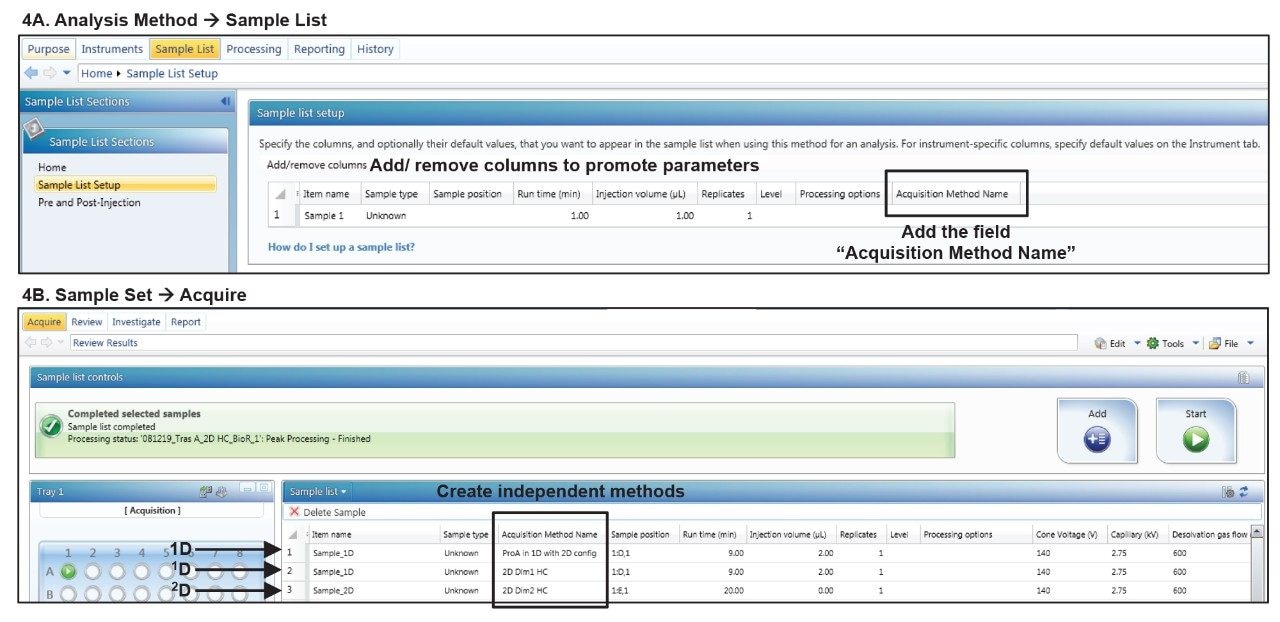
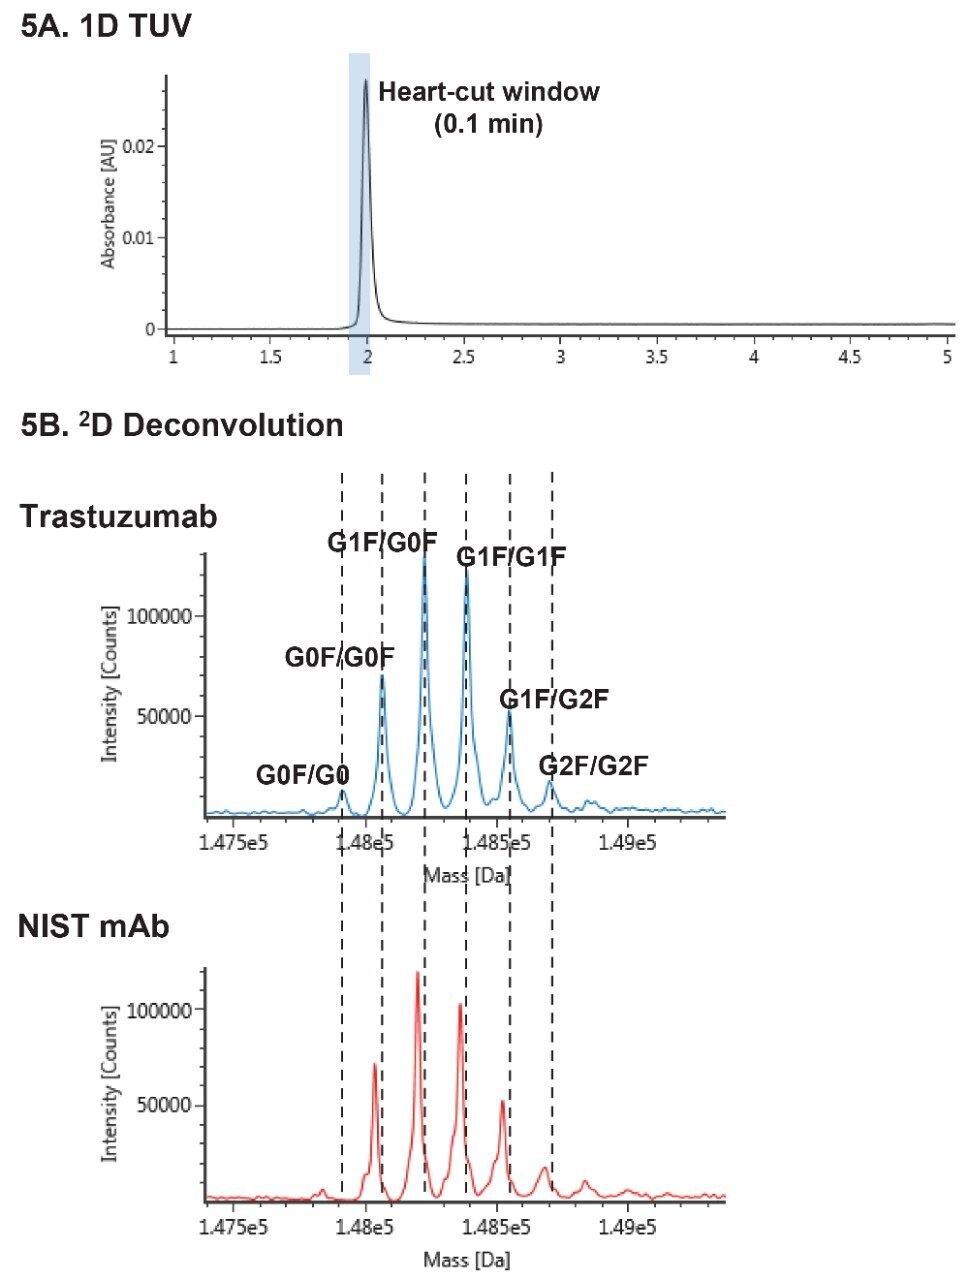
In this work, 2D-LC-MS was used to assess monoclonal antibody (mAb) titer and confirm both product mass and glycosylation profile. The simplicity of data collection on a single platform configured for 1D titer measurements and 2D product profiling with MS detection is demonstrated.
Formulated trastuzumab at 21 mg/mL was used to prepare a stock concentration of 4 mg/mL trastuzumab in 0.1% formic acid (v/v) in water. A two-fold dilution series was prepared until the optical limit of detection was reached in the 1D Pro A study.
System: |
ACQUITY UPLC I-Class PLUS with 2D Technology Quaternary solvent manager (QSM) (1st dimension) Binary solvent manager (BSM) (2nd dimension) |
Detectors: |
ACQUITY UPLC Tunable Ultraviolet (TUV) Detector (1st dimension) |
Wavelength: |
280 nm |
Sample temp.: |
6 °C |
Injection vol.: |
2 μL |
Column: |
POROS A 20 μm column, 2.1 × 30 mm |
Column temp.: |
25 °C |
Flow rate: |
1.000 mL/min |
Mobile phase A: |
50 mM phosphate, 150 mM NaCl, pH 7 |
Mobile phase B: |
500 mM acetic acid |
Column: |
XBridge Protein BEH C4, 300 Å, 3.5 μm, 4.6 × 50 mm (p/n: 186004502) |
Column temp.: |
80 °C |
Flow rate: |
0.500 mL/min (0.100 mL/min idle flow) |
Mobile phase A: |
Water, 0.1% formic acid (v/v) |
Mobile phase B: |
Acetonitrile, 0.1% formic acid (v/v) |
System: |
Vion IMS QTof |
Ionization mode: |
ESI+, sensitivity mode |
Mass range: |
m/z 750–4000 |
Capillary voltage: |
2.75 kV |
Cone voltage: |
140 V |
Source temp.: |
150 °C |
Desolvation temp.: |
600 °C |
Desolvation gas flow: |
600 L/Hr |
Lockmass: |
Glu fibrinopeptide B at 2.2 pmol/μL in 50/50 water/acetonitrile, 0.1% formic acid (v/v) |
UNIFI Scientific Information System v1.9.4
Vion IMS QTof driver pack 2.2.0
Pro A with optical detection is often used as a stand-alone, high-throughput analytical assay for assessing mAb titer. In a traditional 1D titer assay, a calibration curve is produced using purified standards, and fit to a linear regression for quantification. The calibration curve shown in Figure 1 was generated from a trastuzumab dilution series (0.05, 0.1, 0.25, 0.5, 1.0, 2.0, and 4.0 mg/mL). An overlay of the injections from the dilution series shows repeatable retention time. The plot of peak area (TUV at 280 nm) versus concentration (mg/mL) of these injections shows high correlation, which is typical of this assay (inset).
RPLC-MS of intact mAbs can aid in clone selection, process development, and process monitoring by providing mass confirmation and a rapid profile of product glycosylation of the biotherapeutic. Although the Pro A buffer components are not directly compatible with mass analysis, 2D technology can be employed to selectively heart-cut the analyte of interest from the first dimension to the second-dimension column to run a second-dimension separation with MS-friendly eluents.
Configuring a 2D system within UNIFI is straightforward, and once the system is created, the user can readily switch between using the system for a traditional 1D assay or the 2D workflow. Device Management can be accessed through the Administration tab to configure a 2D system (Figure 2). First dimension components should be added to the new system followed by second dimension components, which will then be assigned in that order within UNIFI for easy identification. This is especially useful when methods become more complex and additional pumps are incorporated, or a second column manager housing trap columns is required for a multiple heart-cut analysis.
The system configuration described in Figure 3 enables the user to switch between a traditional 1D workflow (Figure 3A) or modify the existing system to accommodate a 2D workflow through programming a series of valve switches, which can be carried out without any changes to system tubing connections. In this way, the 1D titer assay can serve as the workhorse for high-throughput screening when mass information isn’t necessary. When identity confirmation is required, a second injection of analyte can be made, and a heart-cut can be transferred to the second dimension (Figure 3B). When the heart-cut window is determined, the first- and second-dimension flow paths are combined through at-column dilution (ACD). By switching the valve positions back to the original position, the flow paths are once again isolated, and the second-dimension separation can be run (Figure 3C).
Once the 2D system is configured in UNIFI, individual 1D and 2D methods can be created. From the Analysis Method, the field “Acquisition Method Name” is added to the Sample list setup so that the appropriate method can be selected for data acquisition (Figure 4A). Additional methods can also be created for de-salting or for independent runs in a multiple heart-cut analysis, but these additional steps are not required in the Pro A-RPLC-MS analysis. Once individual methods are created, a Sample Set can be created (Figure 4B) to automate execution of all methods within an analysis.
Using the methods detailed in Figure 4, the Pro A 1D method was used to determine mAb titer (Figure 5A). Peak area from the optical trace was used to calculate sample concentration from the calibration curve shown in Figure 1. In this example, the sample was determined to have a concentration of approximately 1 mg/mL. This same optical trace also determines the heart-cut window for transferring analyte to the second dimension for LC-MS analysis. In a second injection, a heart-cut window of 0.1 min (1.9–2.0 min) was selected to transfer analyte to the in-line second-dimension column. In the third line of the sample set, the flow paths are once again isolated, and a 10-minute isocratic hold is incorporated to wash the transferred analyte, which is adsorbed to the head of the second-dimension column, to remove protein A buffer contaminants. After the wash step, a 10-minute RPLC-MS gradient method was run. Figure 5B shows the resulting deconvoluted data for trastuzumab with labelled glycoforms. This mass data can be used to confirm sample identity through comparison to the predicted mass calculated from a reference standard. Monitoring glycosylation patterns can be routinely employed to screen for optimal biosimilar candidates, guide process development decisions, or potentially supply data for at-line analyses in manufacturing operations.
This work demonstrates how a traditional 1D assay can be extended to incorporate 2D functionality using a common instrument platform. The UNIFI Scientific Information System enables automated switching between 1D and 2D workflows, as needed, without making physical changes to the instrument once the initial system configuration is completed. The Pro A-RPLC-MS assay was used to demonstrate how a 2D heart-cut approach can be used to transfer an analyte from a matrix that is not MS compatible to a MS-friendly mobile phase so that mass information can also be acquired in a single automated analysis.
720006691, October 2019