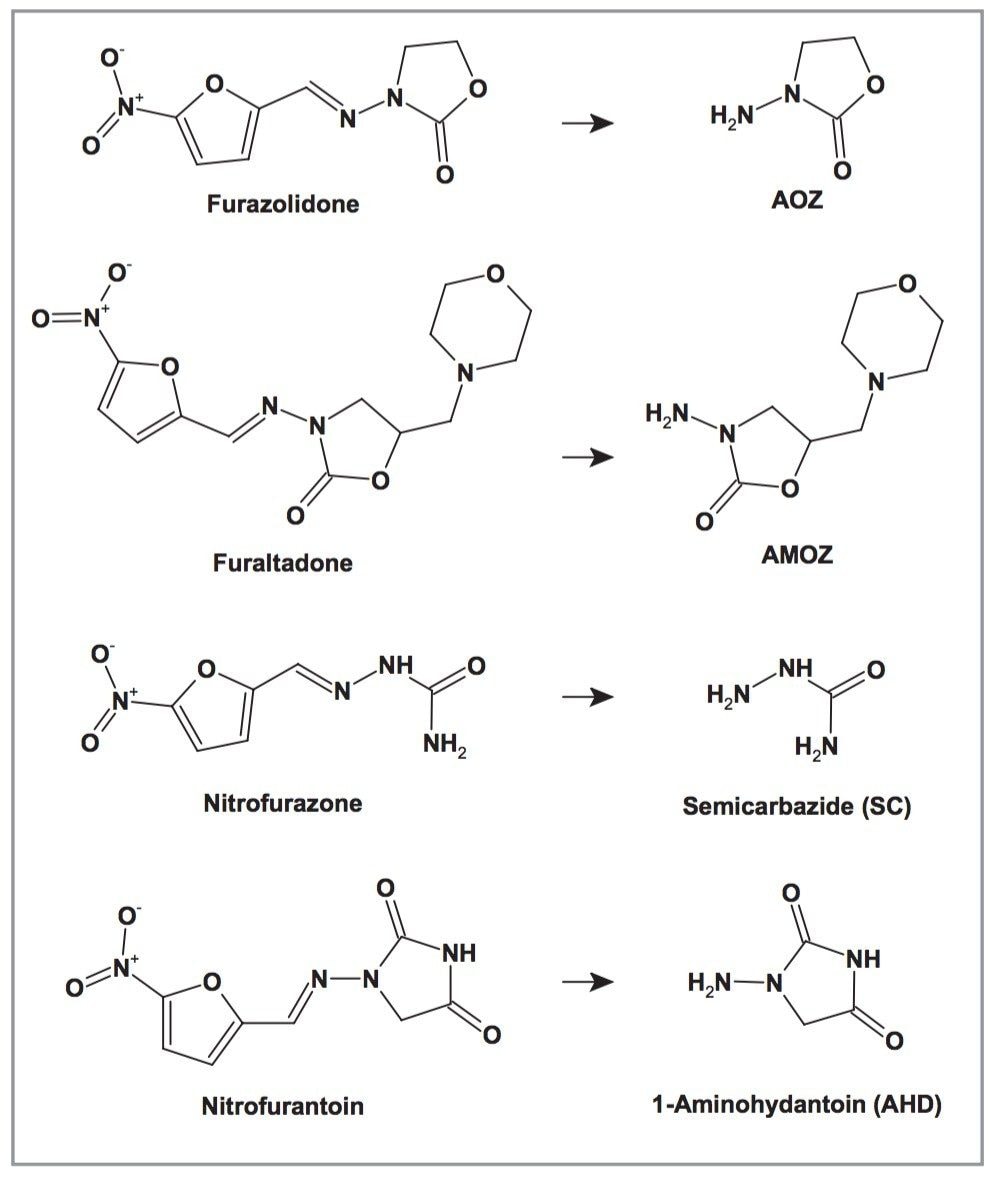
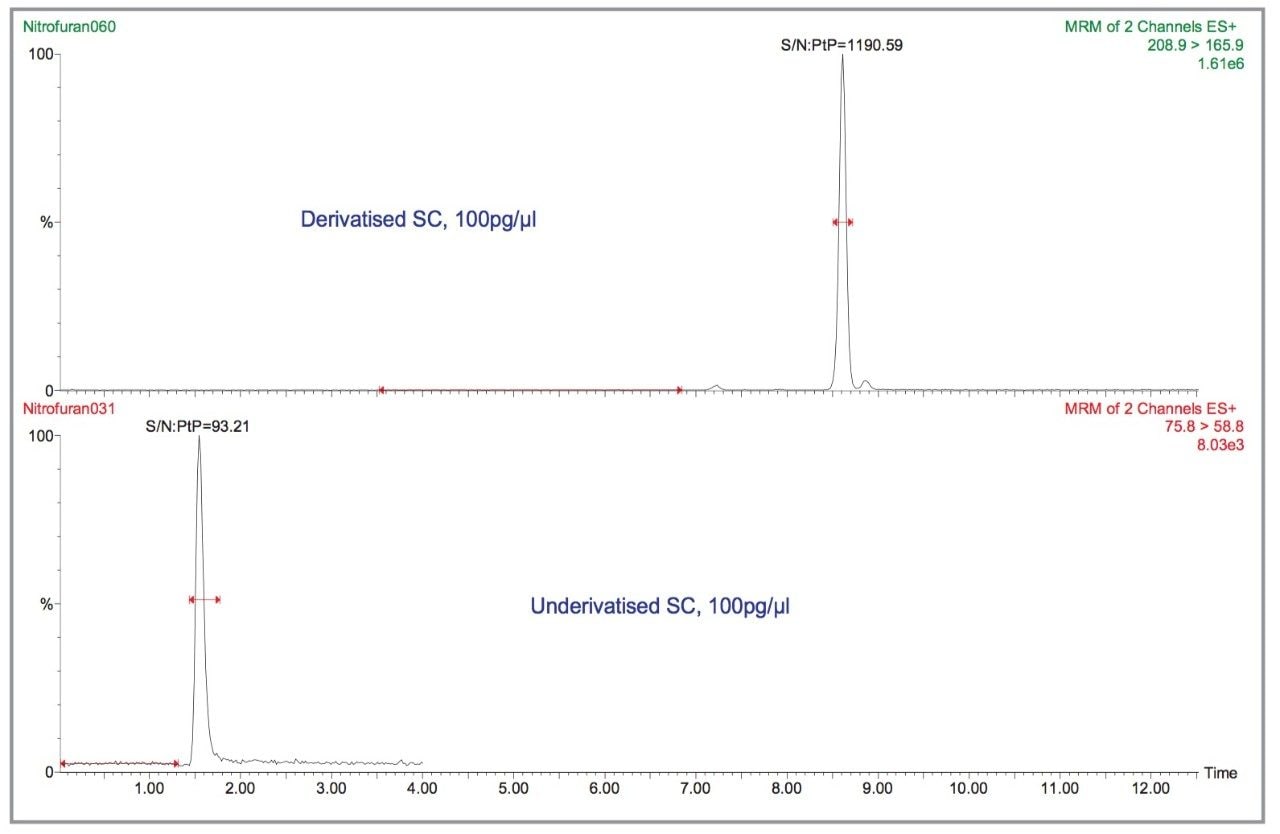
All of the nitrofuran metabolites have molecular masses between 75 and 201. Due to more abundant background noise in this mass range, a low ionisation efficiency of the analytes and their non-specific fragmentation behaviour (predominantly loss of ammonia, water or carbon dioxide), the MS sensitivity is relatively poor. Consequently, derivatisation of the free amino group of the target analytes with 2-nitrobenzaldehyde is normally carried out to achieve compounds with more favourable properties.
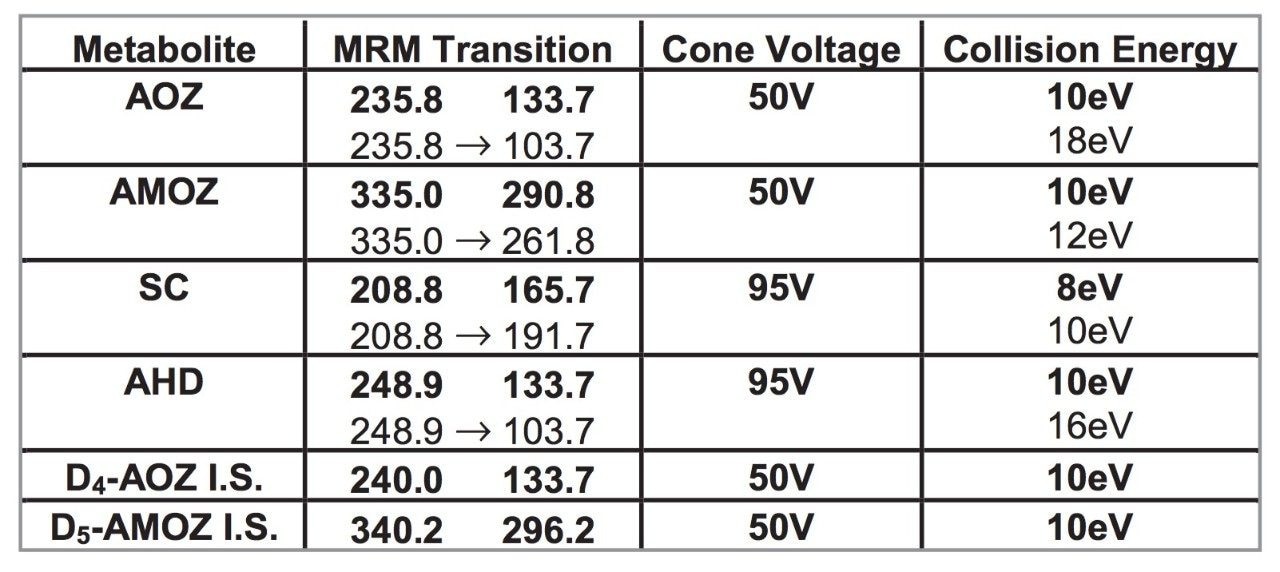
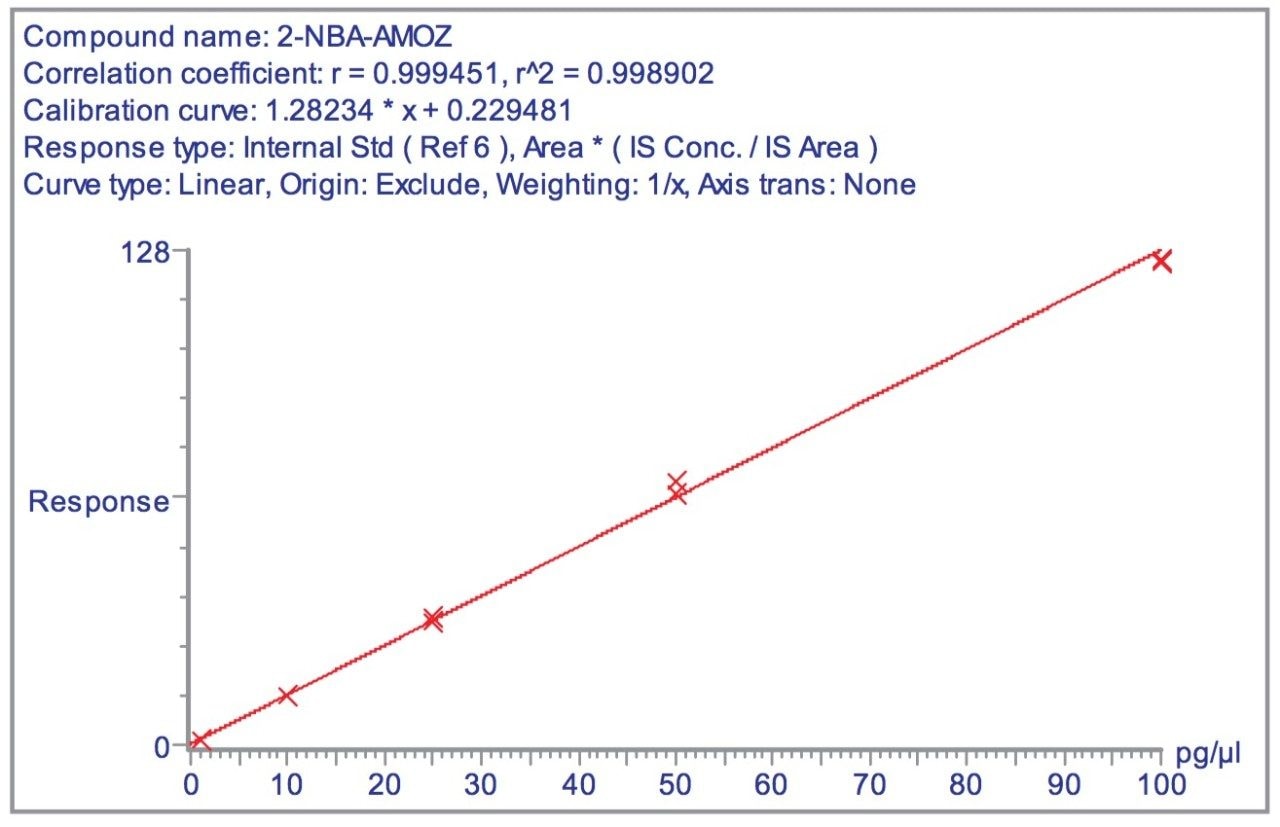
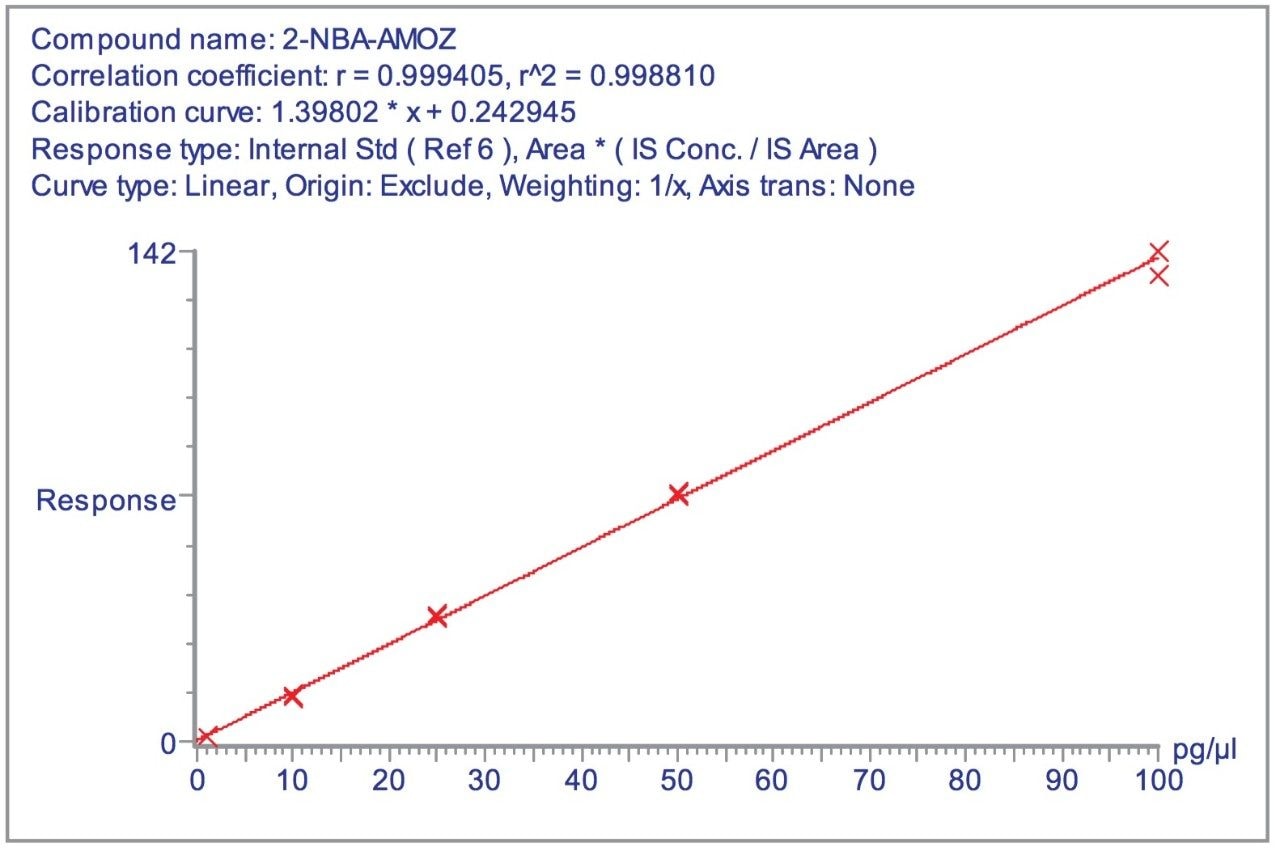
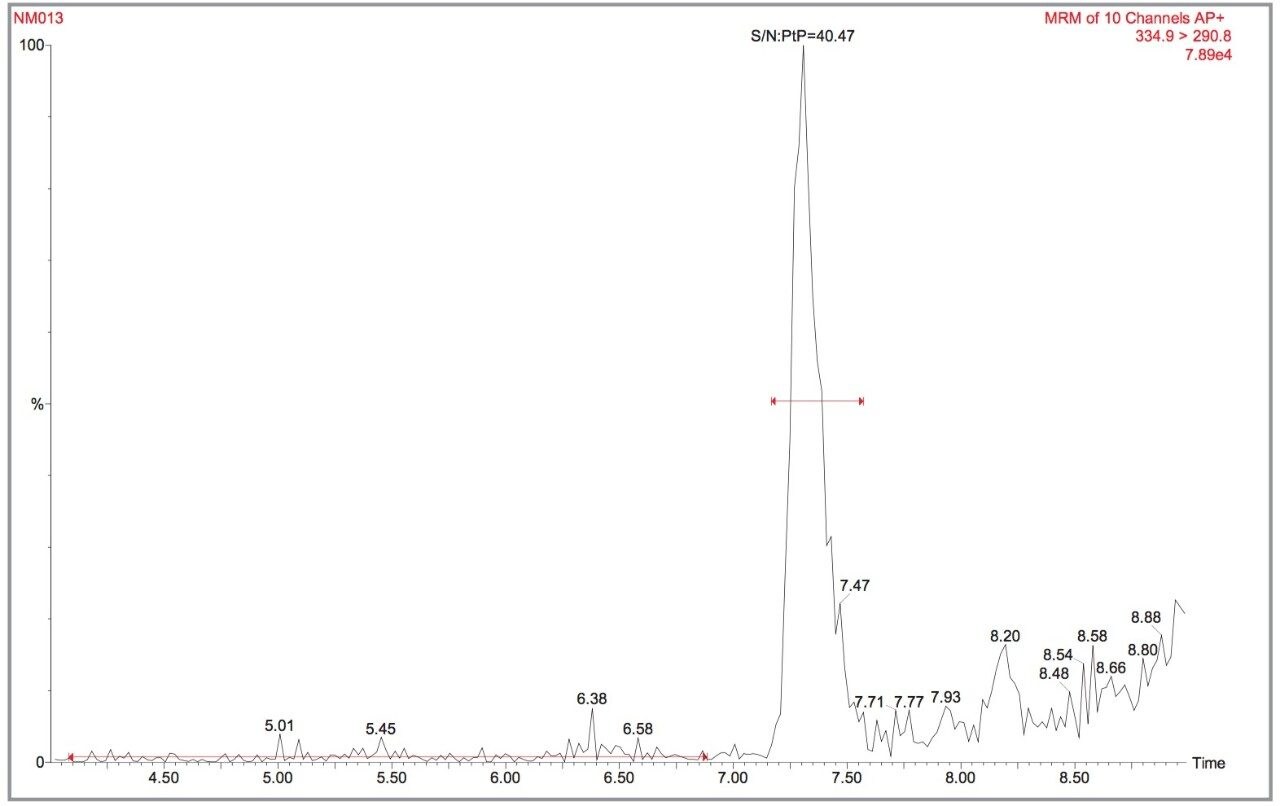
Due to the low limits of detection required by the MRPL, a significant concentration factor is used in the extraction method. This increases the potential for matrix interference during the determinative step. Triple quadrupole mass spectrometry in the Multiple Reaction Monitoring (MRM) mode provides the analytical selectivity required for achieving low analyte detection levels in complex sample matrices and was employed in accordance with European Union guidelines.3
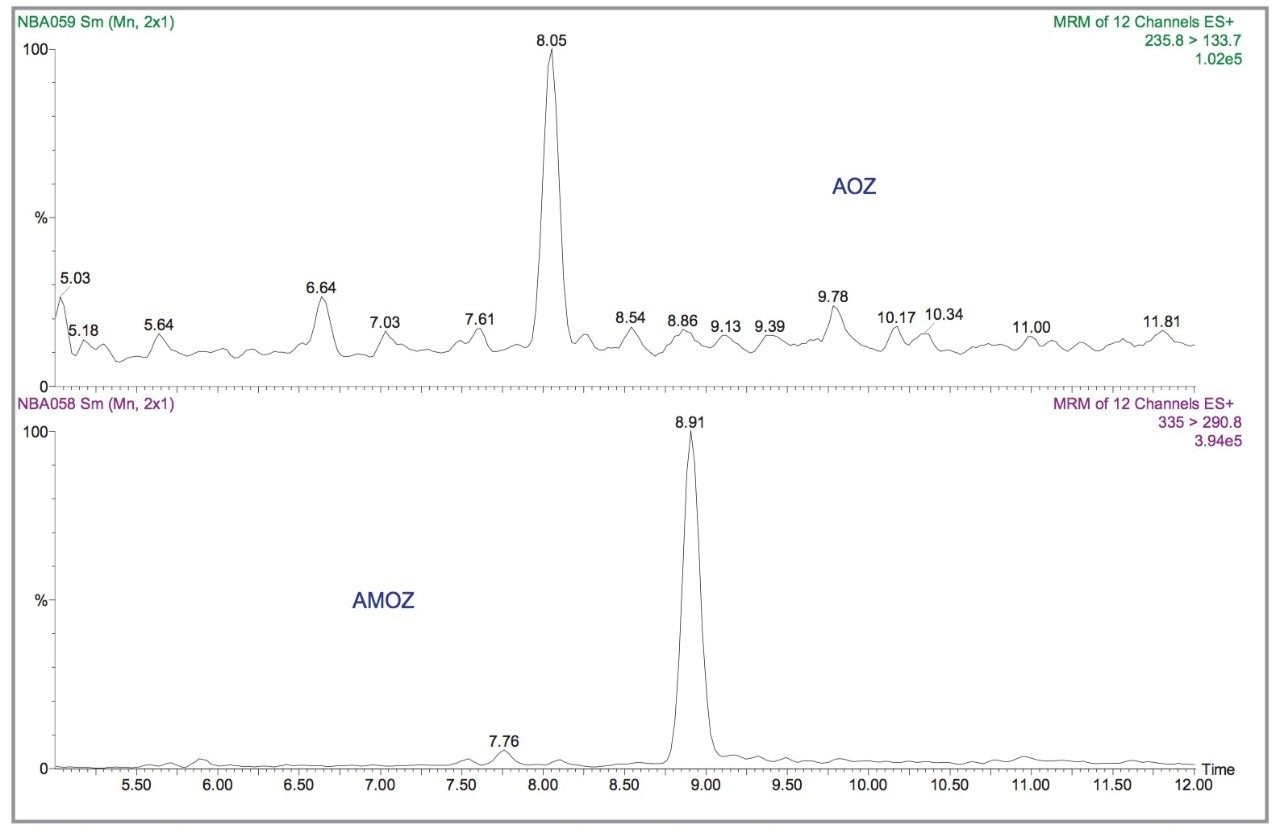
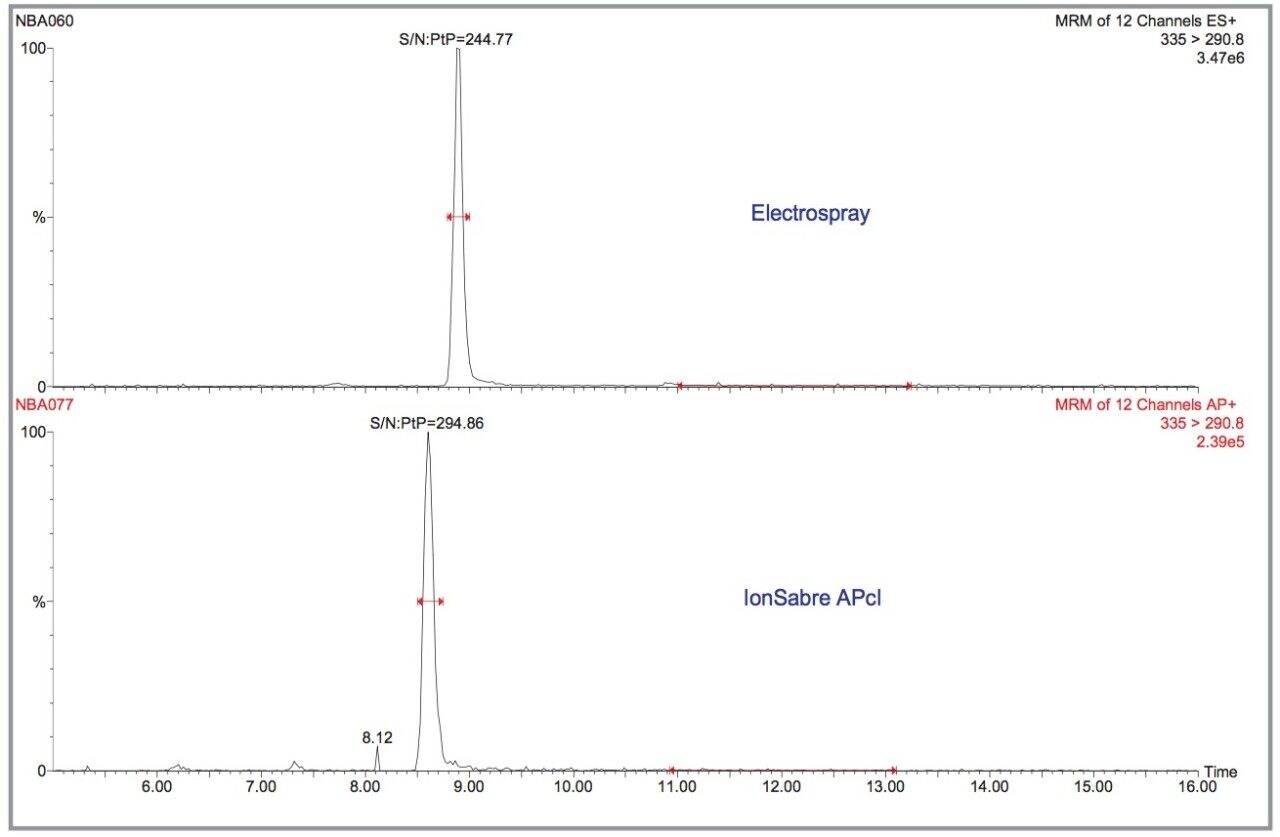
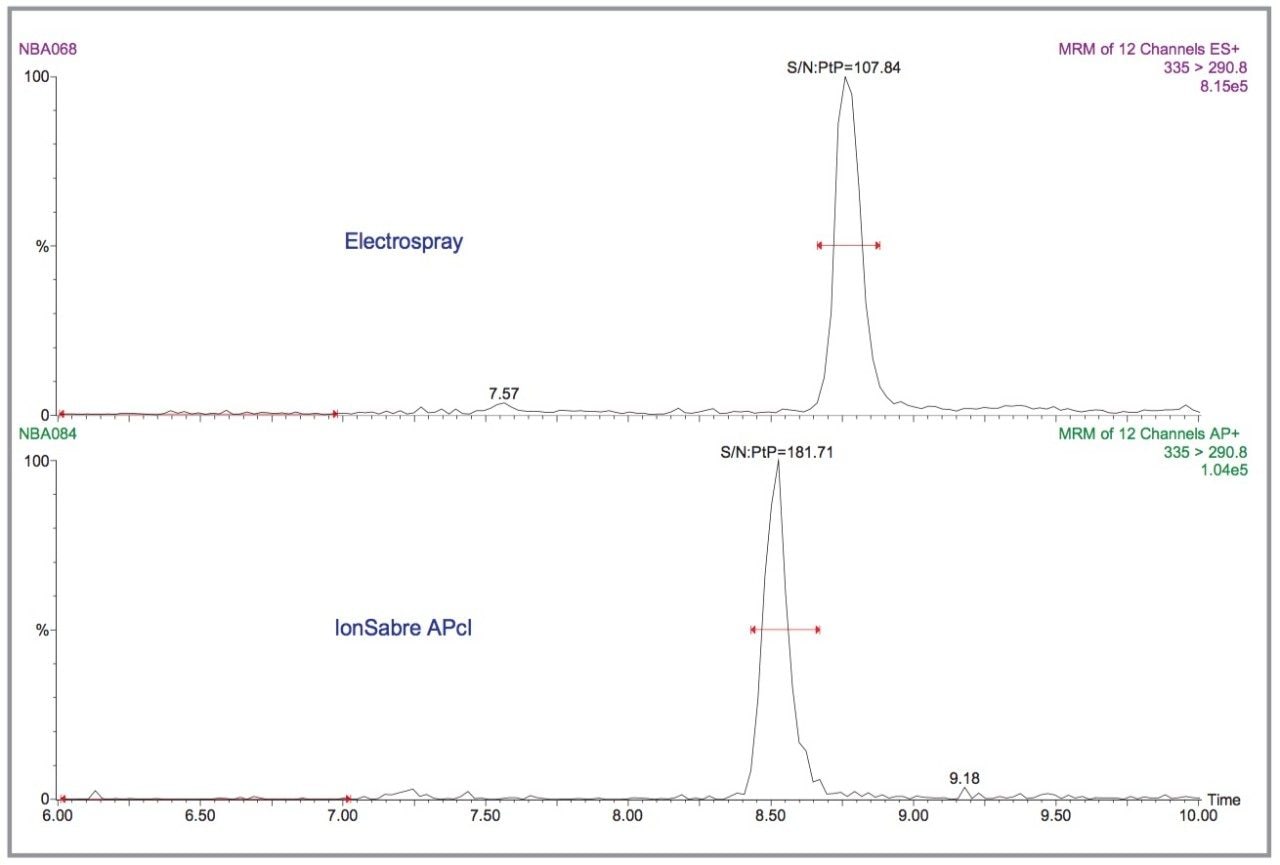
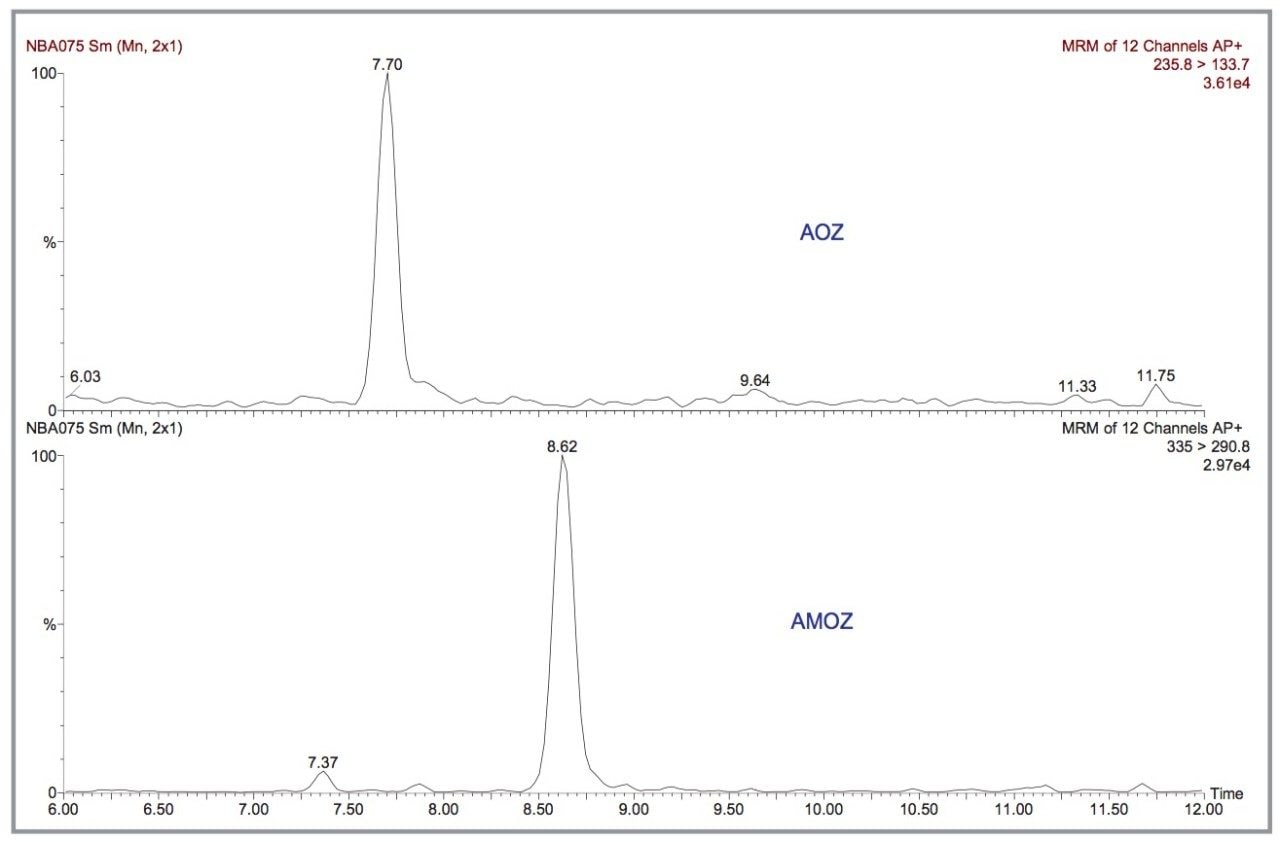
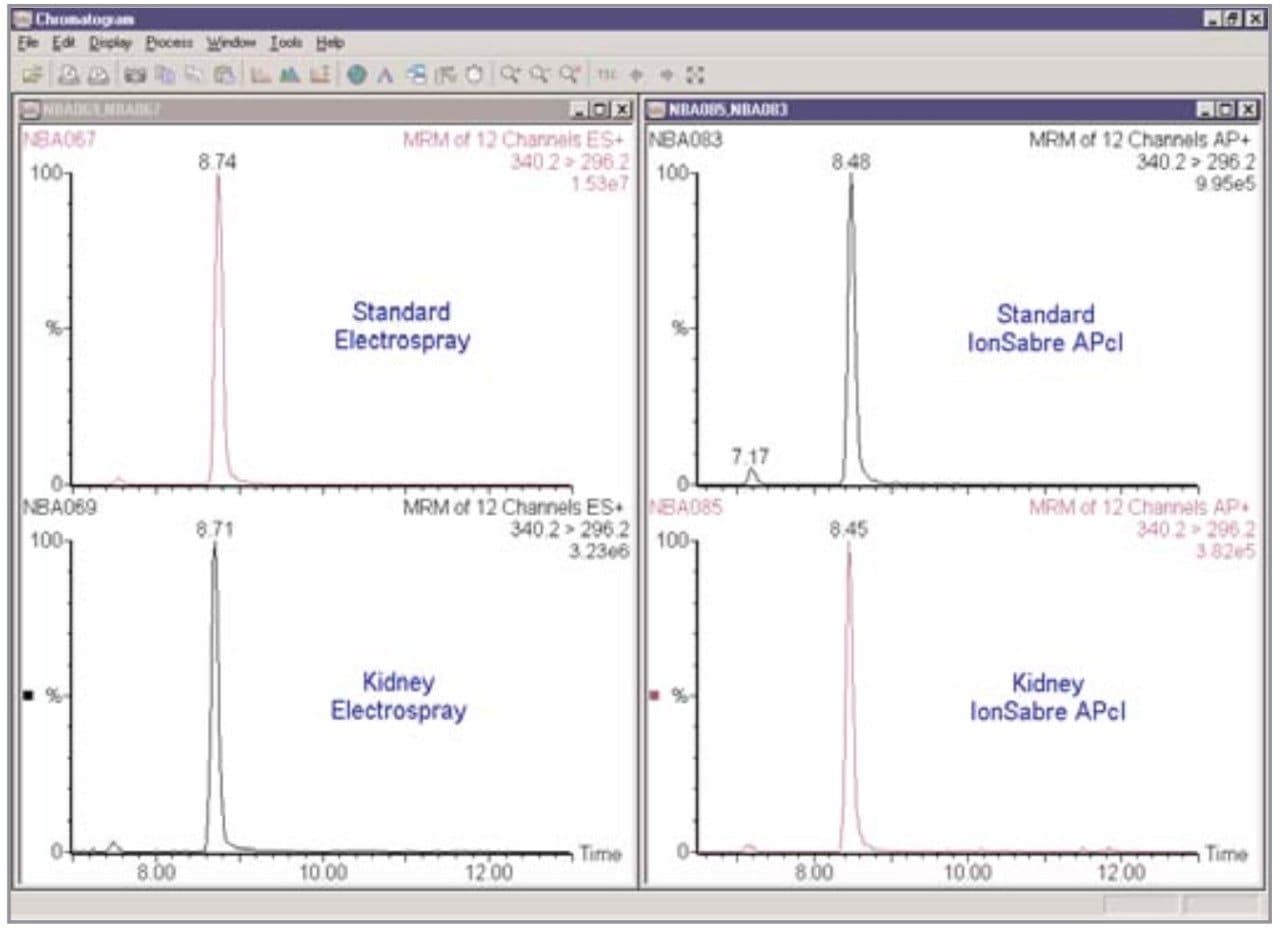
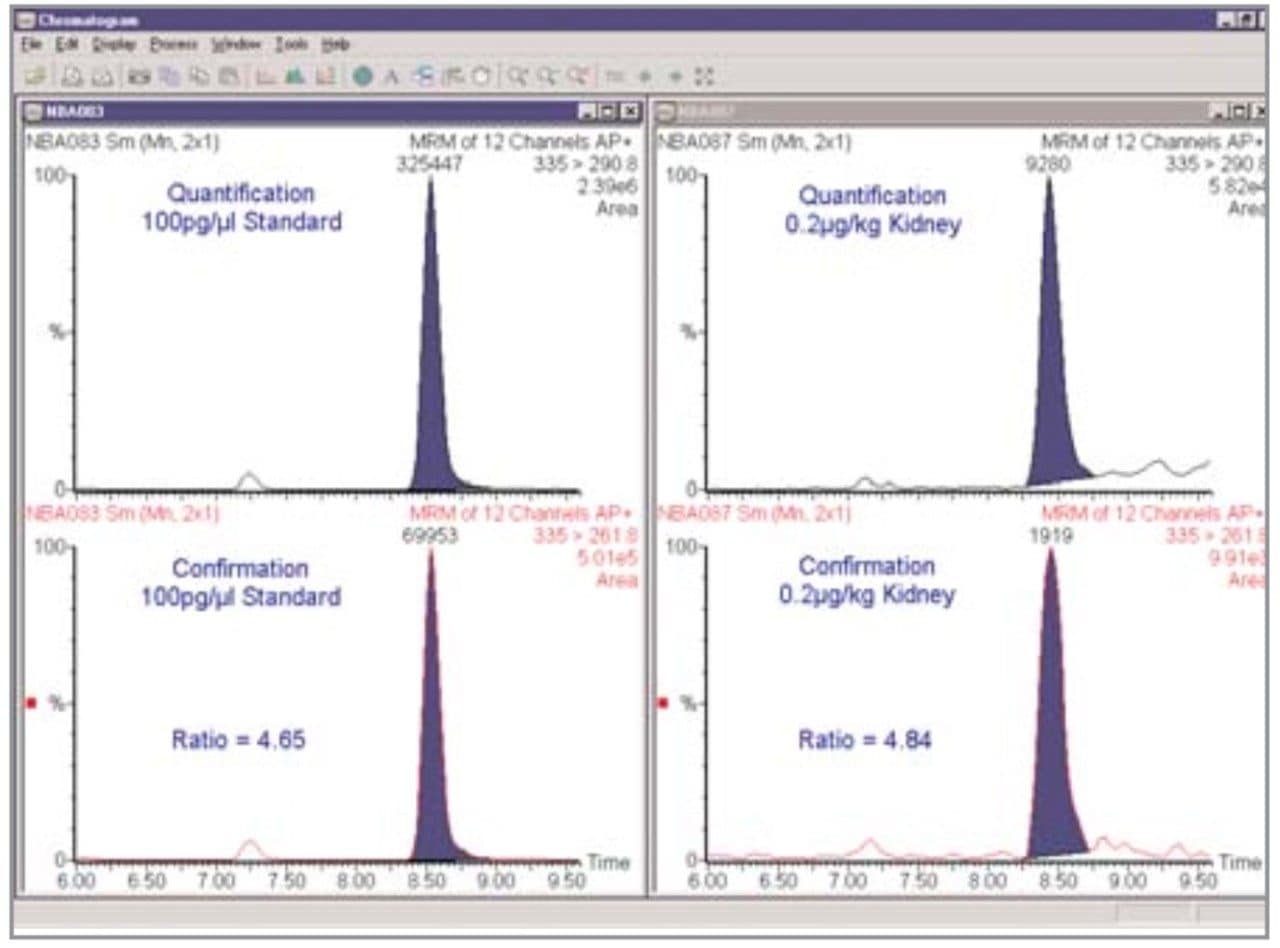
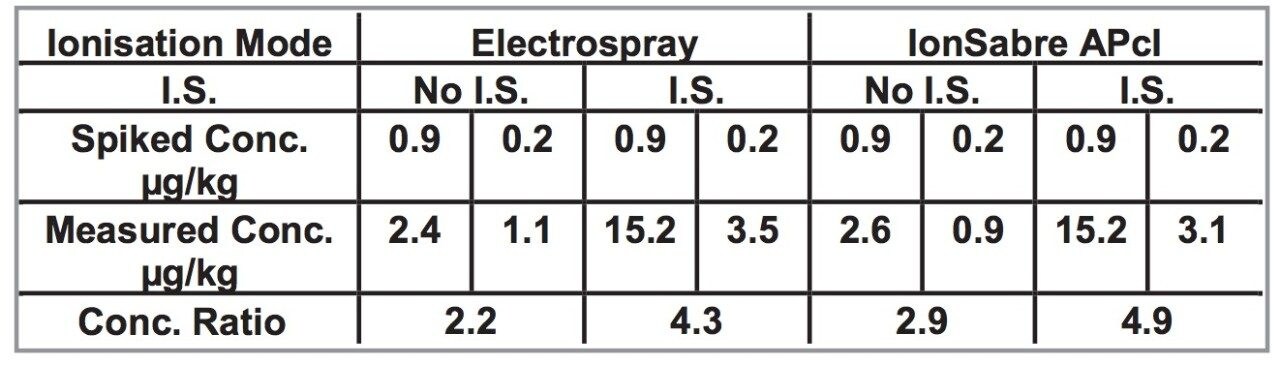
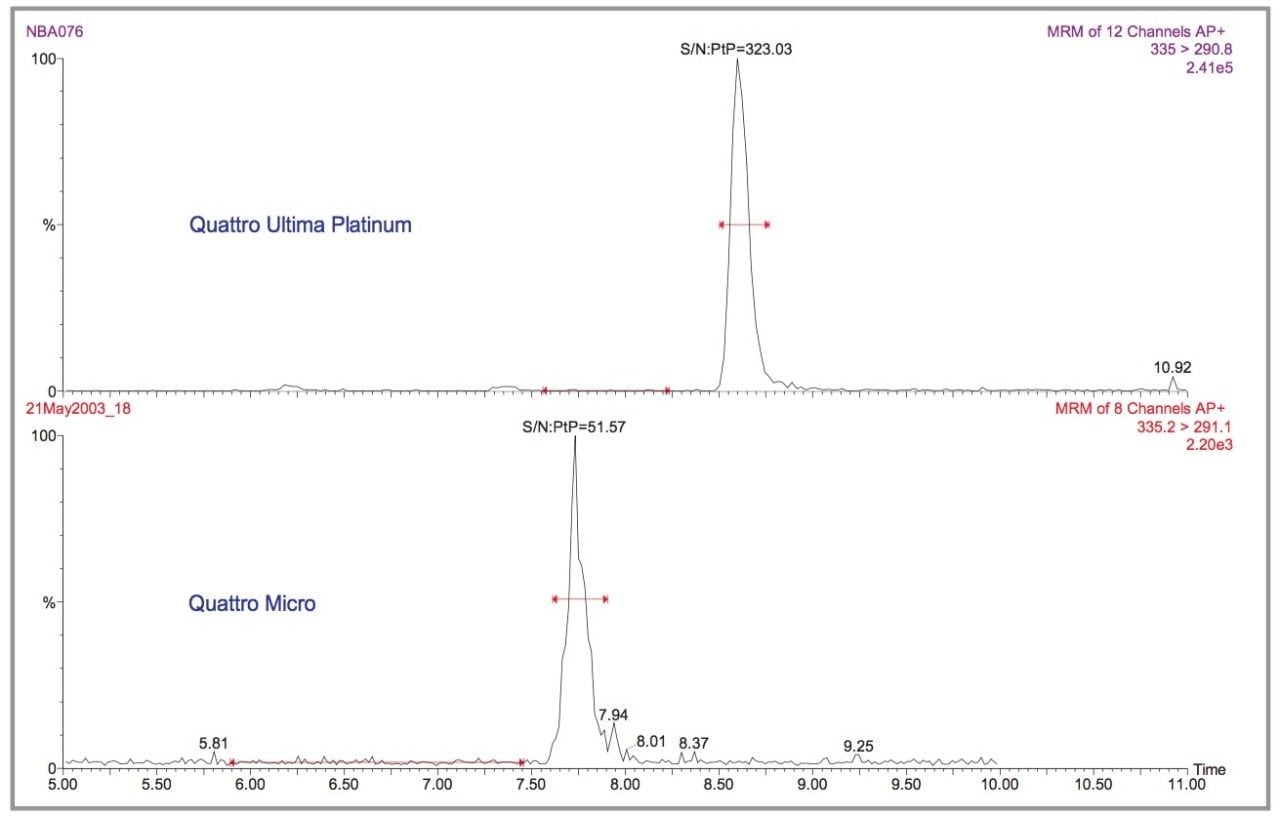
Using the MRM technique a method was developed for the quantification of all four derivatised nitrofuran metabolites in bovine kidney samples. Also compared are the ionisation efficiency of Electrospray and IonSabre APcI along with the sensitivity of the Quattro Ultima Pt and the Quattro micro LC-MS/MS instruments for the determination of the nitrofuran metabolites.