• Application Note

Assay for Identification and Quantification of Host Cell Protein Impurities in High-Purity Monoclonal Antibodies Down to 1 ppm: An Inter-Laboratory Study

Assay for Identification and Quantification of Host Cell Protein Impurities in High-Purity Monoclonal Antibodies Down to 1 ppm: An Inter-Laboratory Study

  • Catalin E. Doneanu
  • Malcolm Anderson
  • Brad J. Williams
  • Matthew A. Lauber
  • Asish B. Chakraborty
  • Weibin Chen
  • Waters Corporation

Abstract

This application note demonstrates the ability of 2D UPLC-MS system to identify and measure low-abundance HCPs (1 to 100 ppm) by analyzing a highly-purified monoclonal antibody that has been made available from the National Institute of Standards and Technology (NIST).

Benefits

We demonstrate a generic and sensitive mass spectrometric assay for the identification and quantification of host cell proteins (HCPs) that are present in highly purified biotherapeutic monoclonal antibodies (mAbs), in the concentration range of 1 to 100 ppm.

Introduction

Most biotherapeutic proteins are produced by recombinant DNA technology using a highly qualified host cell system. Host cells express a large number of their own proteins that can easily contaminate the recombinant protein drug. Even after several orthogonal purifications steps, low levels (1–100 ppm) of host cell proteins may still remain in the final biopharmaceutical product. Since HCPs may induce an adverse immunogenic response, regulatory guidelines stipulate that HCPs must be identified and quantified to protect patient safety.

Characterization of HCPs in protein drugs is required before a biopharmaceutical can be accepted by the regulatory agencies worldwide. For example, in 2008, the European Medicines Agency (EMA) approved a recombinant form of human somatropin only after the manufacturer added additional purification steps to remove the HCPs responsible for immunogenic response in patients.1 The same agency rejected an interferon biosimilar in 2006 because of insufficient validation for immunogenicity testing.

Since HCPs are trace contaminants in the biopharmaceutical product, any analytical methods used to measure them must be effective over a wide dynamic range, typically from 4 to 6 orders of magnitude. Some widely used analytical methods, such as process-specific ELISAs and Western blots,2 require prior knowledge of the composition of HCP contaminants. In addition, process-specific immunoassays are both time consuming (e.g., 6 months) and expensive to develop (> $100K). Further, immunochemical assays cannot readily adapt to evaluate biopharmaceutical products from different cell types and purification protocols.

Two-dimensional gel electrophoresis coupled to fluorescent staining,3,4 another popular method for HCP analysis, is semi-quantitative, has limited dynamic range (2 to 3 orders of magnitude), and requires mass spectrometry or another off-line technique for HCP identification. Although commercial ELISA kits are readily available, they are developed for generic HCP monitoring, are less specific than the process-specific immunoassays, and cannot offer complete coverage for all the existing HCPs present in the sample.5,6

An organization that demonstrates the ability to accurately identify and monitor HCPs in biotherapeutic samples is more likely to meet the regulatory requirements and to produce better quality products.

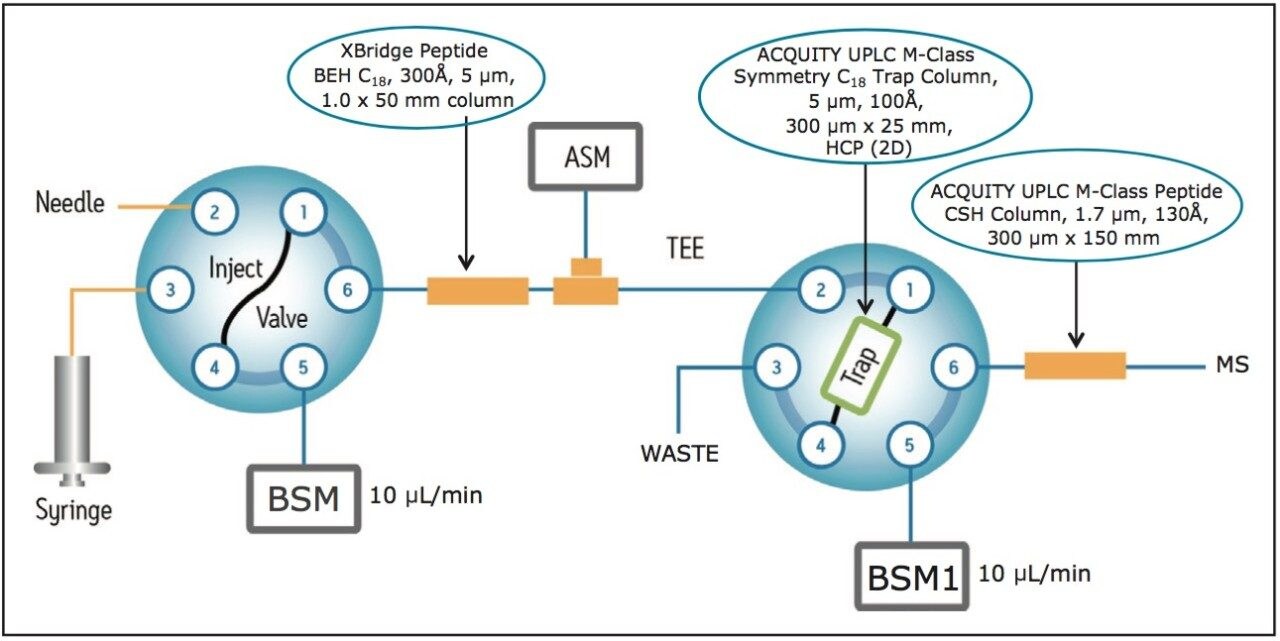
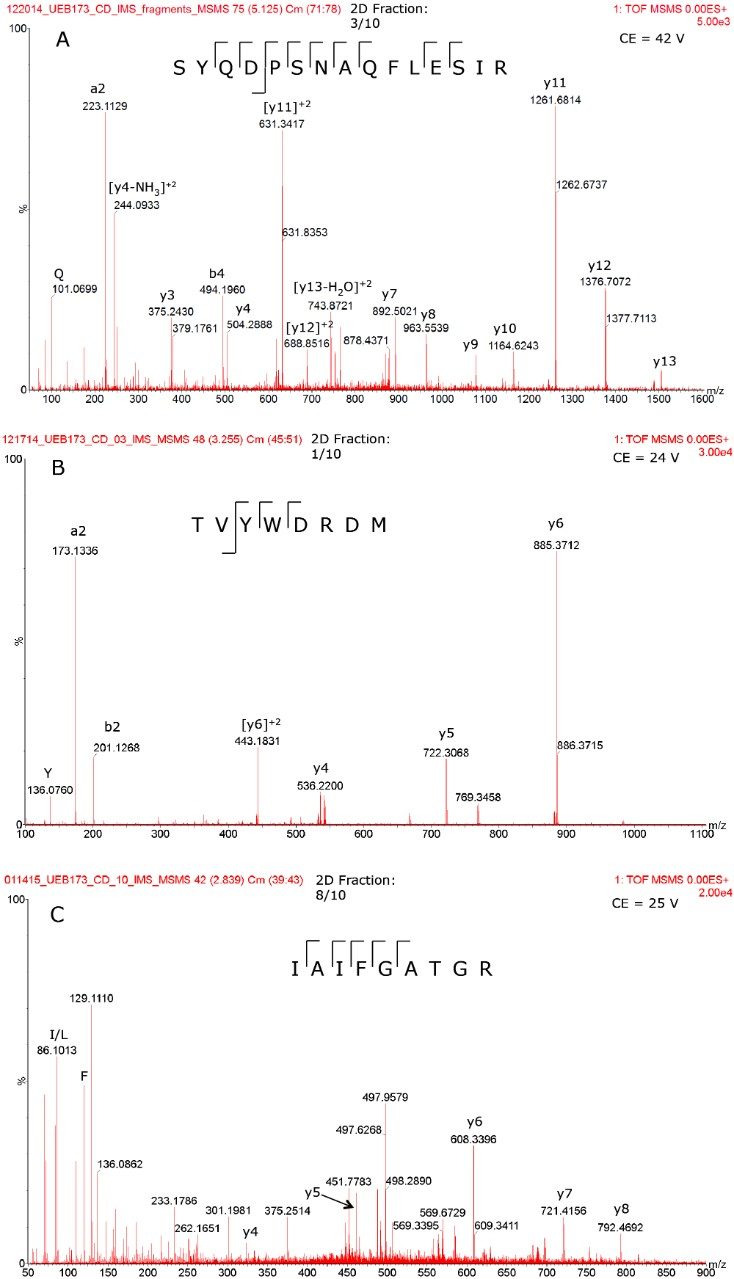
Here, a generic LC-MS assay that offers comprehensive HCP identification and quantification for biotherapeutic protein samples is described. The assay uses a bottom-up peptide-based strategy for HCP identification. The biopharmaceutical product is digested into peptides and analyzed with an on-line two-dimensional LC system coupled to a high-resolution, high-mass-accuracy ion mobility enabled mass spectrometer for protein identification and quantification.

For a successful LC-MS assay for HCP analysis, multiple dimensions of separation are clearly beneficial as a single analytical technique does not offer the required dynamic range. In contrast to traditional 2D-chromatography schemes based on strong cation exchange (SCX) and low-pH reversed-phase7 separations, the 2D-LC configuration used here couples a high-pH (pH 10) reversed-phase (RP) separation to a low-pH (pH 2.5) RP separation.8-13

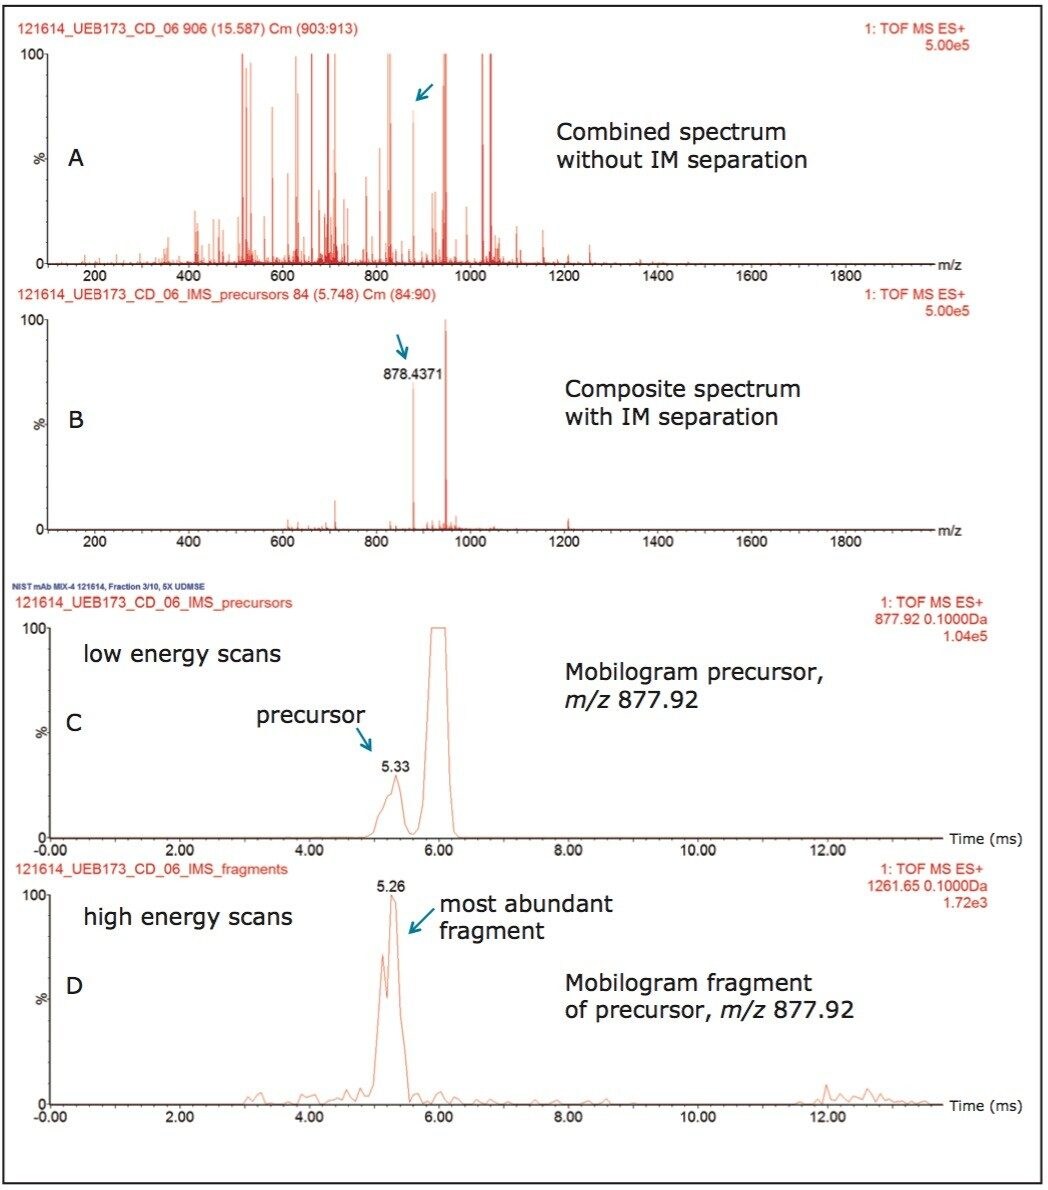
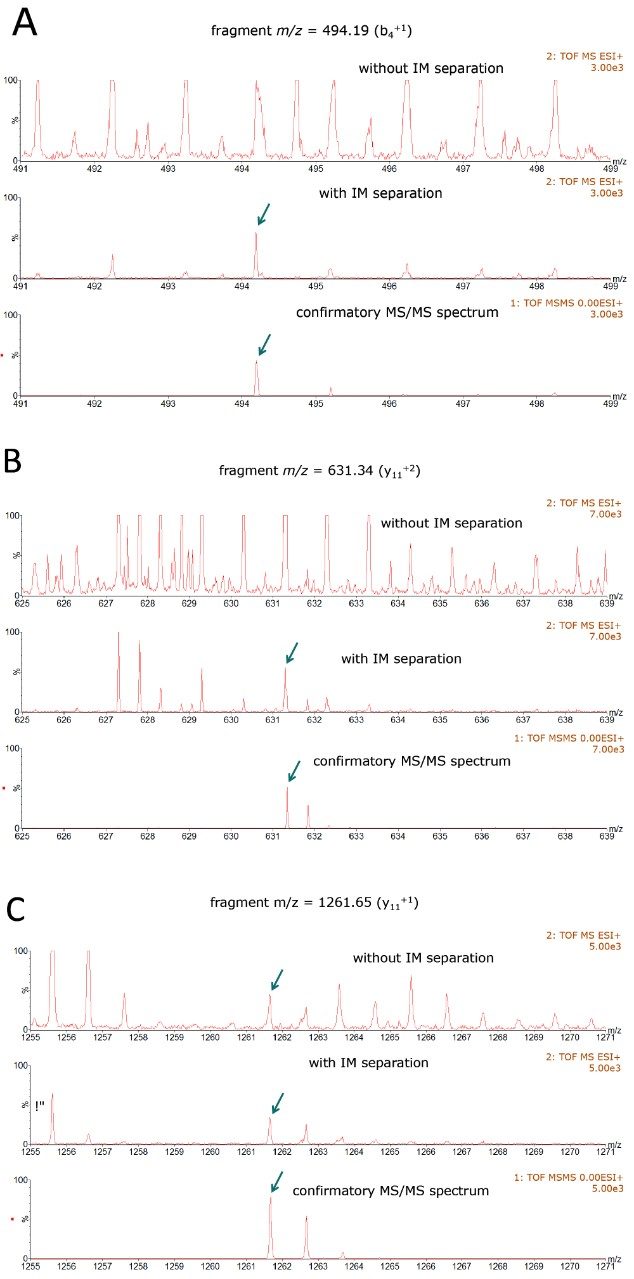
This 2D-RP/RP system achieves high-peak-capacity chromatographic separations, and thus is able to resolve the high complexity typically encountered in HCP analysis. In addition, a multiplexed data acquisition method using travelling wave (T-Wave) ion mobility separation of peptide precursor ions, followed by their fragmentation using ion mobility-specific collision energies,15 is utilized in the mass spectrometric data acquisition, such that low abundance HCP peptides can be reproducibly sampled and identified.

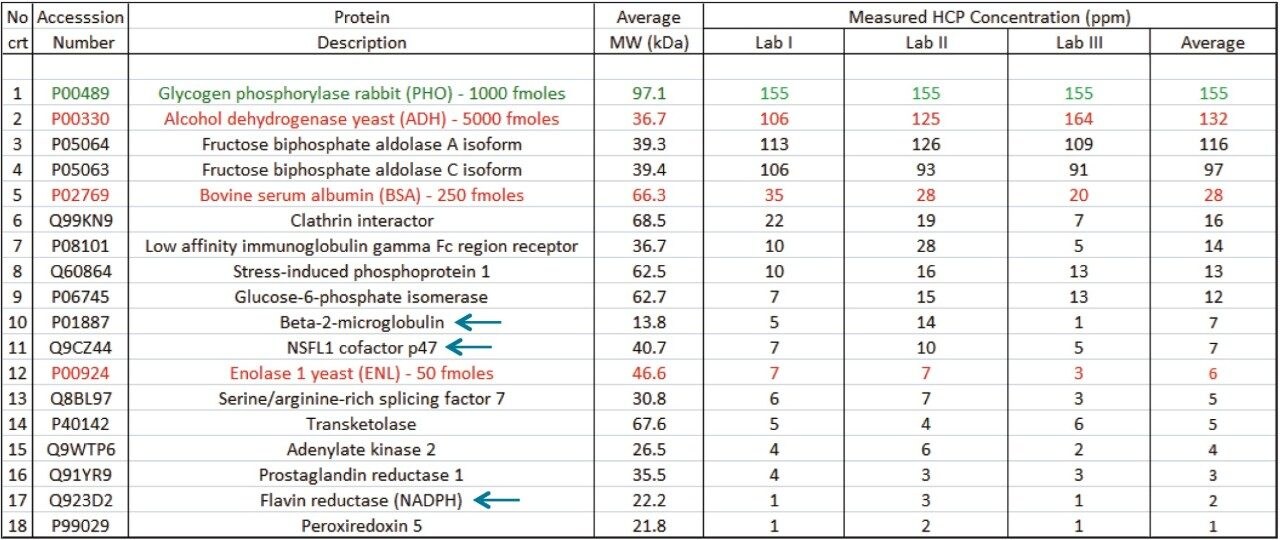
The ability of this 2D UPLC-MS system to identify and measure low-abundance HCPs (1 to 100 ppm) is demonstrated by analyzing a highly-purified monoclonal antibody that has been made available from the National Institute of Standards and Technology (NIST).

Experimental

Sample preparation

A candidate reference mAb (NIST RM 8670 mAb Lot #3F1b) produced in a murine suspension cell culture was acquired from the National Institute of Standards and Technology (NIST) at a concentration of 100 mg/mL. The NIST mAb sample (25 μL) was denatured with 0.05% RapiGest SF (in 50 mM ammonium bicarbonate) for 15 min at 60 °C, reduced with 20 mM dithiothreitol (DTT) for 60 min at 60 °C, alkylated with 10 mM iodoacetamide (IAM) for 30 min (at room temperature) and digested overnight (37 °C) with porcine trypsin (Promega, Madison, WI, USA) using a 1:16 molar ratio (enzyme: protein).

After digestion, the RapiGest SF surfactant was decomposed by adding 5 μL of formic acid (FA), and the samples were incubated for 30 min at 37 °C and centrifuged (15 min at 12,000 rpm) to separate the insoluble component of RapiGest SF by precipitation. The supernatant was transferred to a new vial and the pH of the solution was adjusted to pH 8-9 by adding 25 μL of 25% ammonium hydroxide. Four MassPREP protein digests standards (20 μL of 1 μM ADH, 40 μL of 100 nM PHO, 10 μL of 100 nM BSA, and 20 μL of 10 nM ENL) were spiked and the total digest volume was brought to 1 mL using 20 mM ammonium formate (pH=10). The amounts of spiked protein digests loaded on-column were 5,000 fmoles of ADH (yeast alcohol dehydrogenase), 1,000 fmoles of PHO (rabbit phosphorylase b), 250 fmoles of BSA (bovine serum albumin), and 50 fmoles of ENL (yeast enolase 1) with an injection volume of 250 μL.

LC conditions

2D-LC system:

ACQUITY UPLC M-Class 300 μm I.D. with 2D Technology using on-line dilution ACQUITY UPLC M-Class 300 μm scale kit (p/n 205001432)

First LC dimension (operating at pH 10.0)

Column:

XBridge Peptide BEH C18 Column, 300Å, 5 μm, 1 mm x 50 mm (p/n 186003615)

Flow Rate:

10 μL/min

Column Temp.:

60 °C

Mobile phase A:

20 mM ammonium formate in DI water

(pH=10)

Mobile phase B:

Acetonitrile (ACN)

Step-elution gradient:

A 10-step elution gradient was used for the fractionation of the peptide mixture at pH 10. The percentages of ACN in each step were: 10.8, 12.4, 14.0, 15.4, 16.7, 18.6, 20.4, 25.0, 30.0, and 50.0%, respectively.

Profile of the step elution gradient (example of fraction 1):

Time(min)

Flow(μL/min)

%B

0.0

10

0.0

5.0

10

0.0

6.0

10

10.8

11.0

10

10.8

12.0

10

0.0

20.0

10

0.0

Diluting solution:

0.1% (v/v) TFA in DI water, 90 μL/min flow rate

Trap column:

ACQUITY UPLC M-Class Symmetry C18 Trap Column, 100Å, 5 μm, 300 μm x 25 mm (p/n 186007499)

Second LC dimension (operating at pH 2.5)

Column:

ACQUITY UPLC M-Class Peptide CSH C18 Column, 130Å, 1.7 μm,300 μm x 150 mm (p/n 186007563)

Column temp.:

60 °C

Flow rate:

10 μL/min

Mobile phase A:

0.1% FA in DI water (pH=2.5)

Mobile phase B:

0.1% FA in ACN

Gradient elution table:

Time(min)

Flow(μL/min)

%B

0

10

3

40

10

40

41

10

90

42

10

90

43

10

3

50

10

3

MS conditions

MS instrument:

SYNAPT G2-S HDMSE Mass Spectrometer equipped with a narrow bore ESI probe (p/n 186007529)

Ionization mode:

ESI+

Tof resolution:

Resolution mode (~20,000)

Capillary voltage:

2.6 kV

Cone voltage:

40 V

Source offset:

100 V

Source temp.:

100 °C

Desolvation temp.:

250 °C

Cone gas:

50 L/h

Desolvation gas flow:

500 L/h

Nebulizer:

2.5 bar

Acquisition parameters:

m/z range 100-1990 0.5 sec scans, 50 min runtime

Lockspray solution:

0.2 μm GFP in 50% ACN, 0.1% FA, sampled every 4 min

HDMSE settings:

Typically in the HDMSE approach, ion-mobility separated precursor ions are subjected to fragmentation in the transfer cell, normally applying ramped collision energies (CEs). In this study, drift time specific collision energies are used to fragment precursor ions prior to TOF-analysis resulting in 2-fold increase in fragmentation.15

MS scan functions

Energy settings for trap cell

Energy settings for transfer cell

Low-energy scan(precursors)

4 V


4 V

High-energy scan(fragmentations)


2 V

Collision energy varies according the IM separation bins -
IMS bin 0–20: 17 V
IMS bin 21–110: 17–45 V
IMS bin 111–200: 45 – 60 V

Data management

MassLynx Software v4.1 SCN 916 for data acquisition

ProteinLynx Global SERVER (PLGS) v3.0.2 for data processing

Results and Discussion

A schematic diagram illustrating the operation of the 2D-LC RP/RP system during sample loading, sample elution from the first dimension, and sample separation from the second dimension is shown in Figure 1. A microscale configuration (300 μm I.D. scale chromatography) was adopted because of its enhanced robustness and improved peak capacity compared to the nanoflow (75 μm I.D.) configuration. Peptide samples were loaded under basic conditions (pH 10) on the first dimension column (1.0 x 50 mm XBridge Peptide BEH C18, 5 μm particles) and fractionated using step elution with 10-steps of increasing acetonitrile (ACN) concentrations (see Experimental LC conditions for the individual organic percentages used for eluting each fraction). Each peptide fraction was diluted on-line with a solution containing 0.1% TFA (pH=2.1) at a 1:10 ratio, such that peptides eluting from the first dimension can be temporarily retained on the Symmetry C18 Trapping Column (300 μm x 25 mm, 5 μm particles). Peptides were then separated on the 2nd dimension analytical column (300 μm x 150 mm, 1.7 μm CSH C18 particles) using a 40 min gradient under acidic conditions (pH 2.5). When applied to HCP analyses, this system typically achieves a peak capacity of ~2000.

Figure 1. Fluidic configuration for the two-dimensional high pH/low pH RP/RP chromatographic setup employing on-line dilution

Four protein digestion standards (ADH, PHO, BSA, and ENL, originating from species other than the murine cells of the host) were spiked in the NIST mAb digest post digestion. These protein standards serve as an internal control to probe the dynamicrange of the assay and to provide internal references for quantification of HCPs using the summed signal of the top three ionizing peptides of each protein identified in the analysis.14

The NIST mAb sample was analyzed by three laboratories independently at different sites, using the same methodologies including the 10-step 2D-LC high-pH/low-pH fractionation and HDMSE data collection method described in the Experimental section. As shown in Table I, 14 common HCPs (with concentrations ranging from 1-100 ppm) along with all four spiked protein standards (ADH, PHO, BSA, and ENL) were identified by all laboratories. Individual HCP amounts were calculated using the three best responding peptides from each protein compared against the signal of top three peptides from one of the protein calibrants – PHO, loaded at 1,000 fmoles on-column.

Based on the calculated amounts loaded on-column from each HCP (expressed in femtomoles), the ng amounts of each HCP loaded on-column were calculated by taking into account their predicted molecular weights. The HCP concentrations expressed in ng/mL were then computed based on the injected sample volume (250 μL). Finally, using the initial mAb concentration (100 mg/mL), the individual HCP concentrations (expressed as ppm or ng HCP per mg mAb) were obtained. Individual HCP concentrations were calculated by each laboratory from three replicate injections and these results are likewise provided in Table 1.

Table 1. Fourteen HCPs, present in the concentration range of 1-100 ppm, were identified in the NIST mAb by all three laboratories. Eleven out of twelve low-abundance HCPs (1–30 ppm, were validated using “pure” MS/MS spectra. Three “pure” MS/MS spectra displayed in Figure 4A-C were acquired for the three HCPs labeled by the blue arrows shown this table.

Figure 2 illustrates the utility of ion mobility (IM) separation to reduce spectrum complexity at the precursor level to facilitate protein identification from MS/MS fragmentation spectra. The top panel (Figure 2A) displays the combined ESI-MS spectrum (10 scans) recorded during the elution of an HCP peptide from NSFL1 protein, while the bottom panel (Figure 2B) shows the composite spectrum obtained after combining 7 ion mobility bins containing the same peptide precursor. Following the IM separation, the ions of the analyte of interest (HCP peptide SYQDPSNAQFLESIR) can be isolated away from many co-eluting peptide ions. These panels clearly demonstrate that the number of co-eluting precursors left after IM separation is significantly reduced.

Because high-energy fragmentation (HDMSE) takes place post IM separation, it is expected that peptide precursors and their corresponding fragments would align on the scale of IM drift times. Figure 2C and 2D depict this observation clearly, as the apex of the mobilogram recorded for the precursor of this HCP peptide (m/z=877.92/+2 vs drift time (ms)) aligns well with the apex of the mobilogram recorded for one of its most abundant fragments ions (m/z=1261.65, y11). This correlation between the drift times of precursors and their fragments in conjunction with retention time correlation is used by the data processing software (PLGS) to automatically produce cleaner (complexity-reduced) MS/MS fragmentation spectra, which greatly enhance the software capability to identify low abundance HCPs.

Figure 2. The role of ion mobility separation in reducing spectra complexity: (A) ESI-MS spectrum generated from 10 combined scans recorded during elution of an HCP peptide (SYQDPSNAQFLESIR) from NSFL1 cofactor p47 without IM separation; (B) the ESI-IM-MS spectrum recorded for the same peptide; (C) mobilogram recorded for the precursor of this peptide (m/z=877.92/+2); (D) mobilogram obtained for one of the most abundant fragments (y11 = 1261.65) of the peptide.

The incorporation of ion mobility separations into MS data acquisition also facilitates the use of a novel strategy for applying optimized (controlled) collision energy to a subset of peptide ion populations (IM isolated), according to their ion mobility drift times.15 The utility of data-independent HDMSE acquisition with ion mobility-specific collision energies to correctly identify low-abundance HCPs is illustrated by the spectra shown in Figure 3 (panels A-C). The high energy fragmentation spectra shown in these panels were acquired for the HCP peptide SYQDPSNAQFLESIR from NSFL1 protein. Each panel displays a portion of the fragmentation spectrum obtained without the IM separation (top spectrum), with precursor level IM separation (middle spectrum) and the confirmatory ESI-IM-MS/MS spectrum (shown at the bottom). The bottom spectra were recorded for a quadrupole selected (~2 Da mass window), ion mobility separated peptide precursor (m/z=877.92/+2).

Figure 3. Comparison of high-energy MS/MS spectra obtained with/without ion mobility separation. Each panel displays a portion of the fragmentation spectrum obtained without the IM separation (top spectrum), with precursor level IM separation (middle spectrum) and the confirmatory ESI-IM-MS/MS spectrum (shown at the bottom). The bottom spectra were recorded for a quadrupole selected (~2 Da mass window), ion mobility separated peptide precursor (m/z=877.92/+2). Spectra are centered around three abundant fragment ions of this HCP peptide: (A) b4; (B) y11(+2) and (C) y11(+1).

Three major fragment ions of this HCP peptide are clearly distinguished in all the HDMSE spectra (see the middle spectra in these panels). In the absence of the ion mobility separation (top spectra in each panel), the MS/MS background is more complex and the spectra have more interfering fragment ion signals, thus making the correct sequence assignment rather challenging. Ion mobility separation at the precursor level enables the removal of a significant amount of interfering signals (including overlapping fragment ions and noise), resulting in less crowded, more discernible high energy fragmentation spectra, which help to produce correct sequence identifications.

Use of HDMSE acquisition with ion mobility-specific collision energies is advantageous over traditional quadrupole-based precursor selection, because it can employ very fast scan rates for mobility isolated sets of multiple precursor ions, therefore improving the duty cycle of the analysis and resulting in more in depth sample coverage.

To further validate the identification of low abundance HCPs, 11 HCPs (present in the 1–30 ppm range) were subsequently targeted to acquire confirmatory MS/MS fragmentation spectra. For each HCP, the corresponding precursor masses (obtained from the PLGS identification step) were isolated using the quadrupole filter with a mass selection window of ~2 Da, separated from other co-eluting precursors using ion mobility, and fragmented with optimized collision energy in the transfer cell of the SYNAPT G2-S instrument.

Figure 4 displays the fragmentation spectra recorded for three very low abundance HCPs (in the 2–7 ppm range). These cleaner, information rich, high-quality MS/MS spectra are able to provide extensive amino acid sequence coverage for each peptide, thus allowing unambiguous HCP identification and validation.

In addition, these MS/MS spectra indicate that this type of generic HCP assay would be suitable for monitoring previously identified HCPs (using HD-MRM) at sub ppm levels, potentially down to 100 ppb.

Figure 4. HCP validation: “pure” MS/MS spectra recorded for three peptides from 3 low-abundance HCPs (2–7 ppm range). Extensive peptide sequence coverage was obtained in each case, with almost complete sequence verification.

Conclusion

  • The HCP assay based on the 2D-LC-HDMSE approach allows the identification and quantification of low-abundance HCP contaminants in biopharmaceuticals in the range of 1–100 ppm
  • Ion mobility separation at the precursor level improves the quality of high-energy fragmentation spectra thus allowing the HCP assay to achieve previously unattainable detection limits (1 ppm HCP in high-purity mAbs)
  • HDMSE findings were validated by acquiring confirmatory MS/MS spectra from quadrupole isolated, mobility separated peptide precursors
  • LC-MS assays are now able to achieve comparable sensitivity to traditional HCP assays (e.g., ELISA), while offering the unique advantage of providing unambiguous HCP identification

References

  1. European Medicines Agency. Omnitrope: Scientific Discussion 2006. http://www.emea.europa. eu/humandocs/PDFs/EPAR/Omnitrope/060706en6.pdf
  2. Wang X, Hunter AK, Mozier NM. Host cell proteins in biologics development: Identification, quantitation and risk assessment. Biotechnol Bioeng. 2009 Jun 15;103(3):446–58.
  3. Hayduk EJ, Choe LH, Lee KH. A two-dimensional electrophoresis map of Chinese hamster ovary cell proteins based on fluorescence staining. Electrophoresis. 2004 Aug;25(15):2545–56.
  4. Jin M, Szapiel N, Zhang J, Hickey J, Ghose S. Profiling of host cell proteins by two-dimensional difference gel electrophoresis (2D-DIGE): Implications for downstream process development. Biotechnol Bioeng. 2010 Feb 1;105(2):306–16.
  5. Savino E, Hu B, Sellers J, Sobjak A, Majewski N, Fenton S, Yang TY. Development of an In-House, Process-Specific ELISA for Detecting HCP in a Therapeutic Antibody, Part 1. BioProcess Intl. 2011 Mar;9(3):38–49.
  6. Savino E, Hu B, Sellers J, Sobjak A, Majewski N, Fenton S, Yang TY. Development of an In-House, Process-Specific ELISA for Detecting HCP in a Therapeutic Antibody, Part 2. BioProcess Intl. 2011 Apr9(4):68–75.
  7. Wolters DA, Washburn MP, Yates JR III. Large-scale analysis of the yeast proteome by multidimensional protein identification technology. Nat Biotechnol. 2001 Mar;19(3):242–7.
  8. Gilar M, Olivova P, Daly A, Gebler JC. Orthogonality of separation in two-dimensional liquid chromatography. Anal Chem. 2005 Oct 1;77(19):6426–34.
  9. Doneanu C, Xenopoulos A, Fadgen K, Murphy J, Skilton SJ, Prentice H, Stapels M, Chen W mAbs 2012, 19, 242.
  10. Schenauer MR, Flynn GC, Goetze AM. Identification and quantification of host cell protein impurities in biotherapeutics using mass spectrometry. Anal Biochem. 2012 Sep 15;428(2);150–7.
  11. Doneanu C, Chen W. Analysis of Host-Cell Proteins in Biotherapeutic Proteins by LC/MS Approaches. In Protein Downstream Processing; Labrou NE, Eds.; Methods in Molecular Biology Volume 1129; Springer, 2014;pp 341–50.
  12. Zhang Q, Goetze AM, Cui H, Willie J, Trimble S, Hewig A, Flynn GC. Comprehensive tracking of host cell proteins during monoclonal antibody purifications using mass spectrometry. mAbs. 2014 May-Jun;6(3);65970.
  13. Thomson JH, Chung WK, Zhu M, Tie L, Lu Y, Aboulaich N, Strouse R, Mo WD. Improved detection of host cell proteins (HCPs) in a mammalian cell-derived antibody drug using liquid chromatography/mass spectrometry in conjunction with an HCP-enrichment strategy. Rapid Commun Mass Spectrom. 2014 Apr 30;28(8):855–60.
  14. Silva JP, Gorenstein MV, Li GZ, Vissers JP, Geromanos SJ. Absolute quantification of proteins by LCMSE: a virtue of parallel MS acquisition. Mol Cell Proteomics. 2006 Jan;5(1):144–56.
  15. Distler U, Kuharev J, Navarro P, Levin Y, Schild H, Tenzer S. Drift time-specific collision energies enable deep-coverage data-independent acquisition proteomics. Nat Methods. 2014 Feb;11(2):167–70.

720005379, June 2015

Back To Top Back To Top