Many food and beverage products are routinely fortified with vitamins to enhance their nutritional value and to help address any deficiencies in dietary requirements. In order to meet legal requirements, manufacturers must label their products according to the regulations of the country in which the product is consumed. Examples of these regulations include European Commission (EC) 1925/2006 on the addition of vitamins and minerals, and Title 21 Code of Federal Regulations (C.F.R.), Part 101 on food labeling in the United States.
Rapid, reliable, and cost-effective methods are required by food manufacturers and ingredient suppliers in order to verify product consistency and ensure that label claims are met. This can be a challenging task with the combination of complex matrices and low fortification levels of some vitamins. In addition, many of the methods currently employed stipulate that the vitamins are either analyzed separately, or in small groups. Established techniques include microbiological assays, colorimetric and fluorimetric analysis, titrimetric procedures and HPLC methodologies.1 LC-MS offers the opportunity to consolidate methods along with the ability to improve detector selectivity and reduce limits of quantification. Waters ACQUITY QDa Mass Detector offers laboratories the opportunity to capture the benefits of mass detection without the challenges associated with the adoption of mass spectrometers.
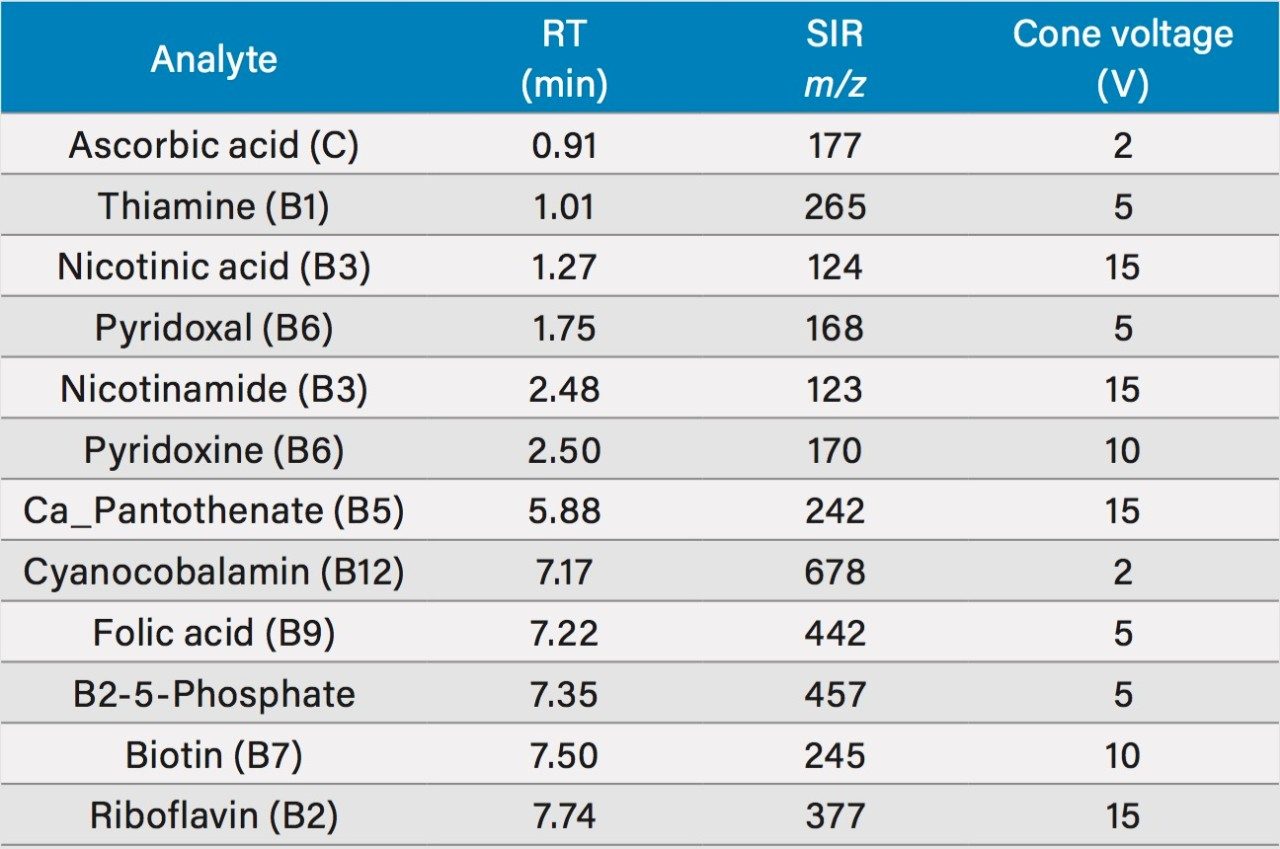
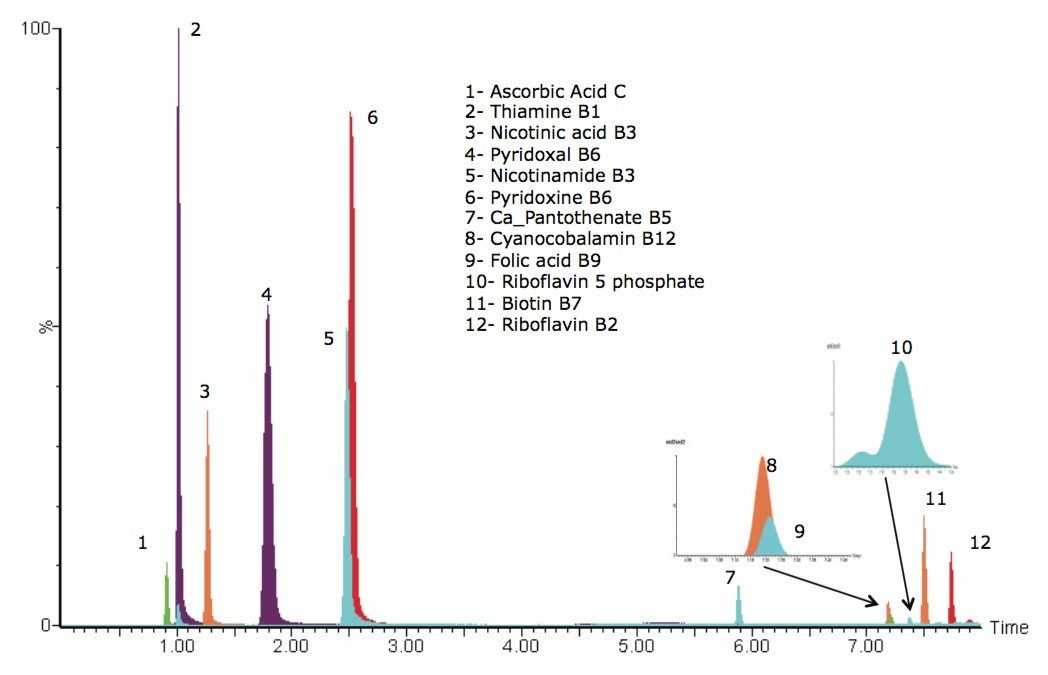
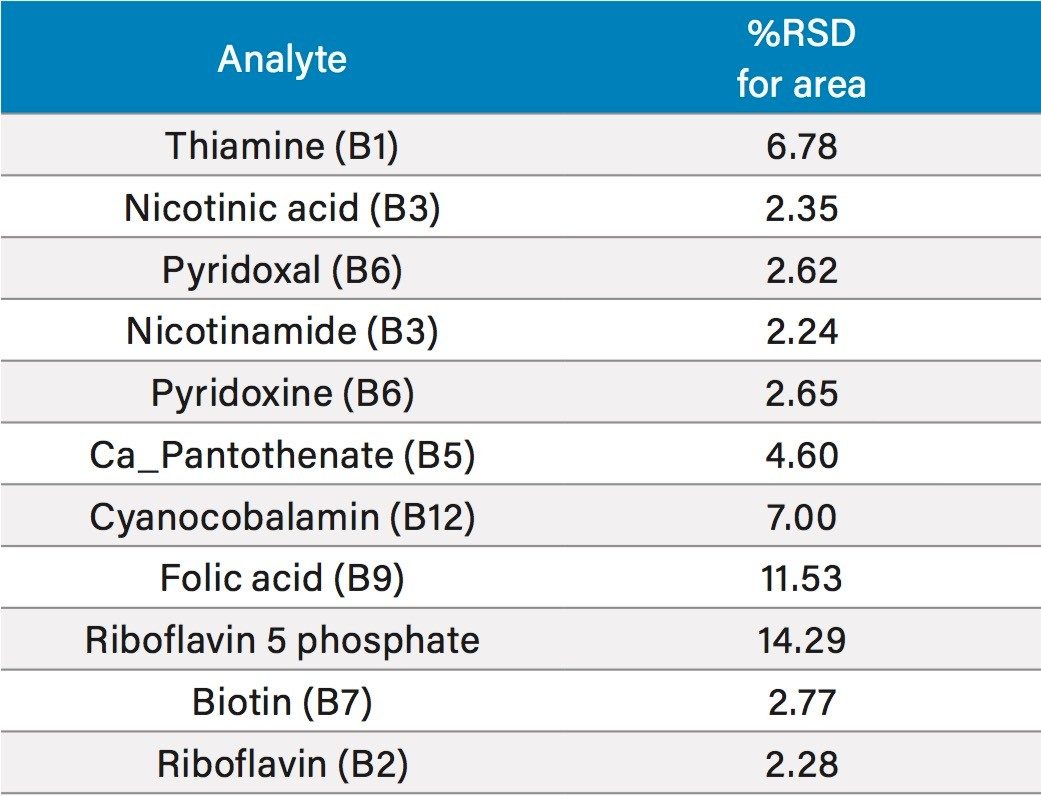
In this application note, 12 water soluble vitamins (WSVs) were analyzed in dietary supplements and beverage samples using the ACQUITY UPLC H-Class System with the ACQUITY QDa Mass Detector.