This application note describes the separation of THC and their enantiomers using Acquity UPC2 system.
Cannabinoids are chemicals found in Cannabis sativa L (Cannabis) that have been shown to exhibit various pharmacokinetic activities. Specifically, Tetrahydrocannabinol (THC) is considered the key psychoactive cannabinoid present in cannabis.1 Depending on how it is derived, THC exists in many isomeric forms, four are predominant, and include (+)trans-Δ8-THC, ( )trans-Δ8-THC, (+)trans-Δ9-THC, and (-)trans-Δ9-THC (structures in Figure 1). The main plant-derived stereoisomer is (-)trans-Δ9-THC, while many synthetic preparations of THC produce the more stable Δ8-THC isomer, or a mixture of positional and stereo isomers. Finally, cannabidiol (another major active cannabinoid) isomerizes under acidic conditions to form mixtures that contain THC isomers and other cannabinoid related compounds.2,3 Just as with other pharmaceutically active ingredients, the stereochemistry of THC affects pharmacological activity.
Analytical procedures capable of separating the positional and stereoisomers of THC are required in many applications.1 For active chiral pharmaceutical compounds, such as THC, the FDA requires that stereoisomeric composition be quantified.4 This will be important as the use of cannabis for medicinal purposes becomes legal in many states. Currently, however, cannabis and many of the constituents derived from cannabis (including THC) are classified as Schedule I illicit drugs. Therefore, the separation of THC stereoisomers can be useful not only for pharmaceutical stereoisomerc composition, but also for analysis of seized drugs in forensics, where achiral analysis alone does not provide a comprehensive sample profile.5 Where legalized, many consumables are being infused with cannabis derived products. Monitoring the stability of products that contain THC or CBD is important, in case new mixtures of positional and stereoisomers form that result in changes in potency, pharmacological activity, or toxicity.
To that end, the separation of the Δ8-THC and Δ9-THC positional isomers, as well as their respective stereoisomers, was investigated using Waters ACQUITY UPC2 technology and Trefoil chiral columns. Once an optimized UPC2 method was established, calibration and repeatability was performed for each enantiomer. The method was used to determine the THC composition of a commercially available CBD product, before and after undergoing acidic conversion to THC.
Federally exempt standards were obtained from Cerilliant including: (±)Δ8-THC at 0.1 mg/ml in heptane, (±)Δ9-THC at 0.1 mg/ml in heptane, (-)Δ8-THC at 1 mg/ml in methanol, and (-)Δ9-THC at 1 mg/ml in methanol. For initial method development, a mixture of all four isomers was used. The mixed sample was a 50:50 mix of the (±)Δ8-THC and the (±)Δ9-THC standards resulting in 0.05 mg/ml solution (0.0125 mg/ml each isomer). The (-)Δ8-THC and (-)Δ9-THC samples were diluted to 0.1 mg/ml in ethanol and were used to determine peak order. Serial dilutions of the (±)Δ8-THC and the (±)Δ9-THC standards were used to create calibration curves for the four stereoisomers.
A commercially available CBD oil extract was obtained and used as an example product. Three aliquots of the CBD oil samples were made up using the following conditions:
Sample 1: 15.65 mg of CBD Oil in 3 mL 200-proof ethanol, heated overnight at 55 °C
Sample 2: 15.26 mg of CBD Oil in 3 mL 0.1 M HCl in 200-proof ethanol, heated overnight at 55 °C
Sample 3: 15.40 mg of CBD Oil in 3 mL 200-proof ethanol, room temperature
All three samples were filtered and diluted 1:10 in ethanol before injecting on the UPC2
UPC2 screening conditions |
|
---|---|
System: |
ACQUITY UPC2 System with an ACQUITY PDA Detector |
Columns: |
ACQUITY UPC2 Trefoil AMY1 Column, 2.5 μm, 3 mm x 150 mm ACQUITY UPC2 Trefoil CEL1 Column, 2.5 μm, 3 mm x 150 mm ACQUITY UPC2 Trefoil CEL2 Column, 2.5 μm, 3 mm x 150 mm |
Mobile phase A: |
Carbon Dioxide |
Mobile phase B: |
200-proof ethanol |
Gradient: |
2 to 20% B over 5 minutes |
Column temperature: |
50 °C |
Injection volume: |
1 μL |
Flow rate: |
2 mL/min |
ABPR: |
2000 psi |
PDA absorbance: |
228 nm, compensation reference:500–600 nm |
Optimized conditions: |
noted on figures |
In normal phase chromatography, and SFC in particular, the first step in method development involves column screening. In this case, the columns used in the screening were amylose (AMY1) and cellulose (CEL1 and CEL2) based chiral stationary phases, which are commonly used because of their wide range of applicability. In particular, the three Trefoil columns provide orthogonal selectivity, which is optimal for successful chiral method development. Much of the work involving cannabis quality control and post-extraction processing uses ethanol as the preferred solvent in order to avoid toxicity from solvent contamination in any final product or consumable. Consequently, ethanol was chosen as the sample diluent and co-solvent for method development. As is typical in column screening, a generic gradient from 2% to 20% ethanol was utilized (Figure 2). It was observed, that all three columns showed good separation of the four THC isomers. As a result, all three separations could be optimized for qualitative or quantitative analysis of the THC isomers. The AMY1 column was chosen for method development because it showed high resolution and more retention of these compounds, resulting in more room for optimization of the separation than with the two cellulose (CEL) columns.
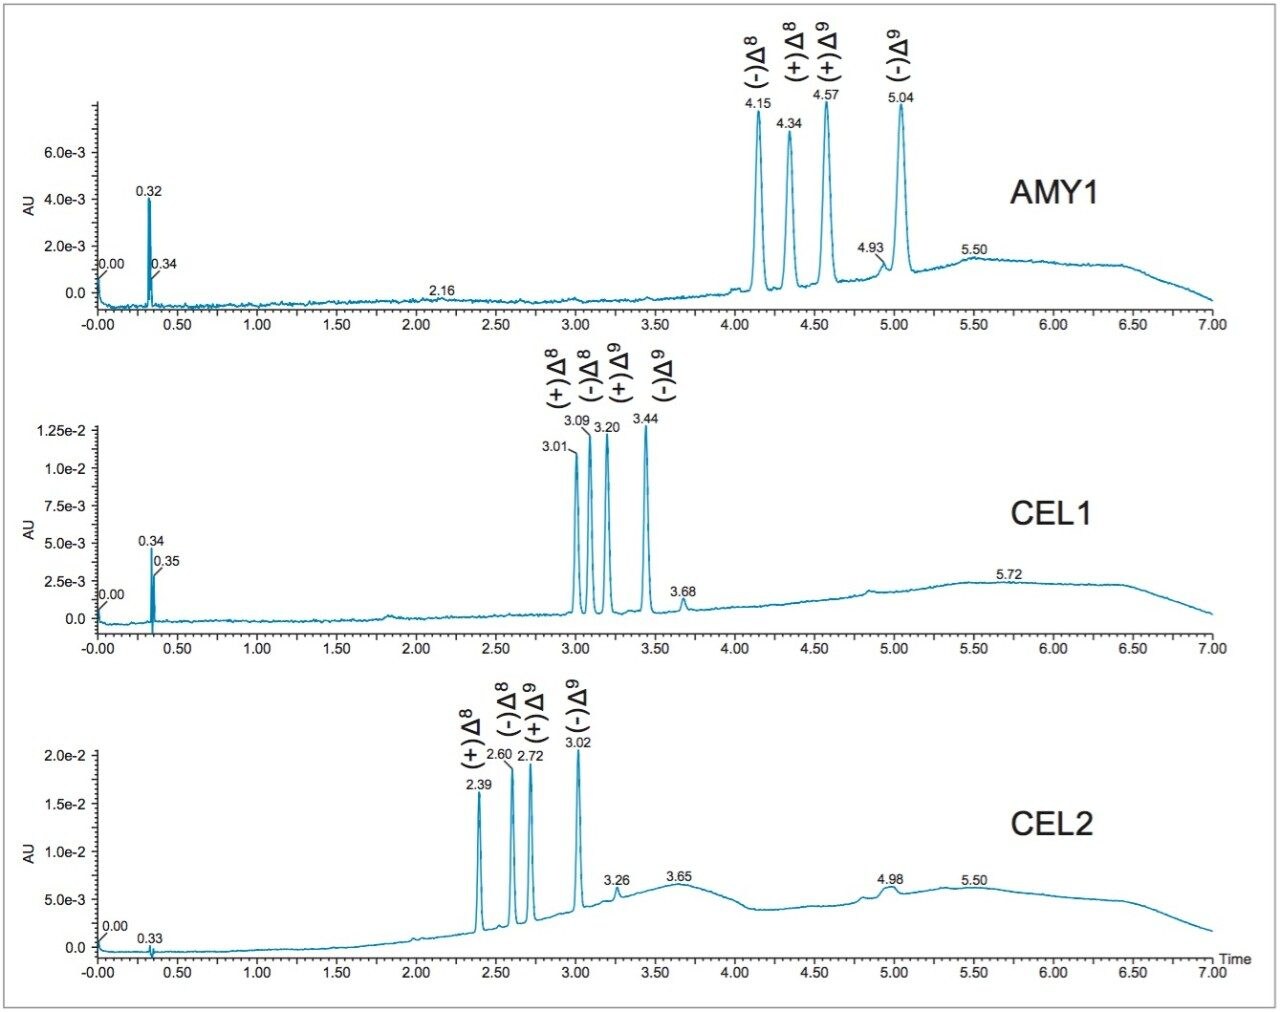
Optimization of the mobile phase conditions usually involves either focusing the gradient or determining isocratic conditions. Isocratic methods are ideal because they are easy to develop and no equilibration is required between runs, improving productivity. Using retention times and gradient slope, and compensating for system and column volume delay, the co-solvent percentage at elution was determined for the separation on the AMY1 column.
With a gradient delay of 0.34 min, gradient slope of 3.6%/min, and 2% starting percentage, the co-solvent percentage
at elution of the first peak at 4.15 was calculated using the following equation:
%Co-solvent at elution = (retention time – gradient delay) x gradient slope + starting %
%Co-solvent at elution = (4.15 – 0.34 min ) x 3.6%/min + 2%
% Co-solvent at elution = 15.7%
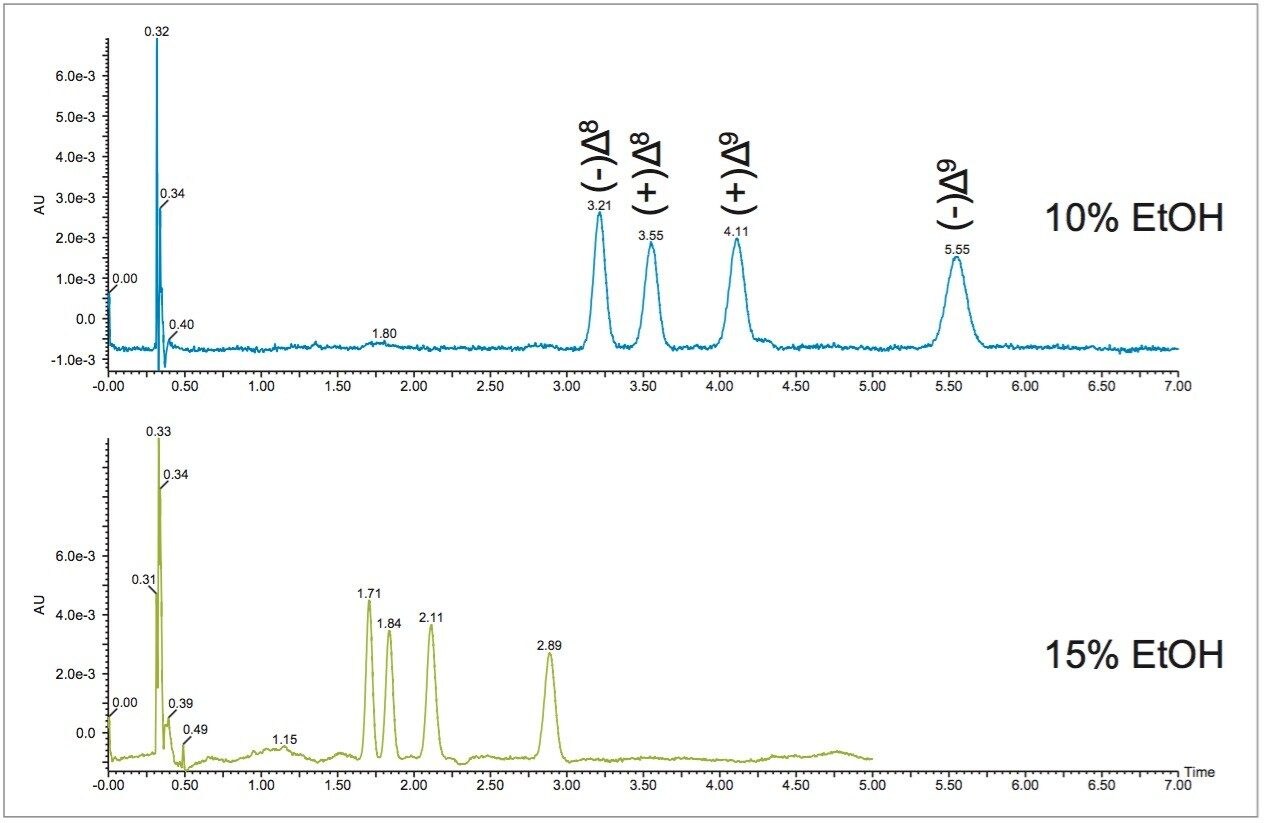
In SFC, usually the best starting point for optimization is 5% below the calculated percentage. Therefore, the initial isocratic method was run at 10% ethanol. Figure 3 shows separation of the THC isomers at 10% and 15% ethanol conditions. At 15%, the separation of the positional and stereo isomers of THC is achievable in less than 3 minutes. Comparatively, the liquid chromatography separation of these compounds does not result in baseline resolution of all four enantiomers, even with a relatively long 23 minute run time.3
In this case, the separation was going to be used to analyze THC in a complex matrix containing cannabidiol (CBD). As a result, the methods were investigated to ensure separation of the THC isomers from CBD. The 10% method showed acceptable resolution from the CBD and matrix, and was subsequently used for calibration and repeatability. Figure 4 shows calibration curves at concentrations of 0.003125, 0.00625, 0.0125, 0.025, and 0.05 mg/mL for all four THC isomers on the AMY1 column at 10% ethanol conditions. The 0.025 mg/mL standard was used to determine repeatability. The calibration curves are linear, with R2 values greater than 0.998, and the peak areas show good reproducibility, with area count RSD values less than 2% (n=7).
Depending on the strain of cannabis used in the production of CBD oil, the resulting product can contain varying amounts of other cannabinoids. THC content is of particular interest for purposes of product quality control. In this case, the product was a CBD oil extract that was marketed as “CBD only”, indicating there is no THC present in the untreated sample. Once the method was calibrated, and shown to be reproducible, the separation was applied to the analysis of the CBD oil extract. Three samples of the product were analyzed; a heated sample, a sample exposed to heat and acidic conditions, and a third control sample that was left untreated. Comparative analysis of the three samples against the THC standards can be seen in Figure 5.
Analysis of the CBD oil samples showed a very small amount of THC in the initial product (control sample). The heat treated sample showed no significant change in THC content. The sample exposed to acidic conditions contained a significant amount of (-)Δ9-THC, calculated to be 1.16mg or approximately 7.6% of the initial 15.26 mg sample. There was also a very small detectable amount of (-)Δ8-THC in the sample exposed to acidic conditions. The samples were incubated for one overnight period (approximately 16 hrs), given more time the conversion would likely be even more pronounced.3
720005812, September 2016