In this application note, we describe a method that utilizes a combination of LC and high resolution mass spectrometry (HRMS) to perform targeted screening of microcystins in lake water samples.
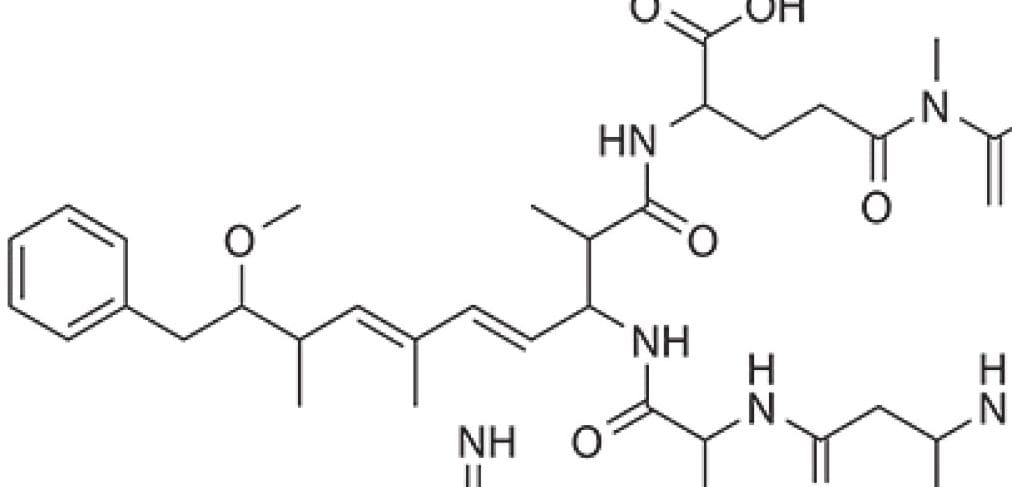
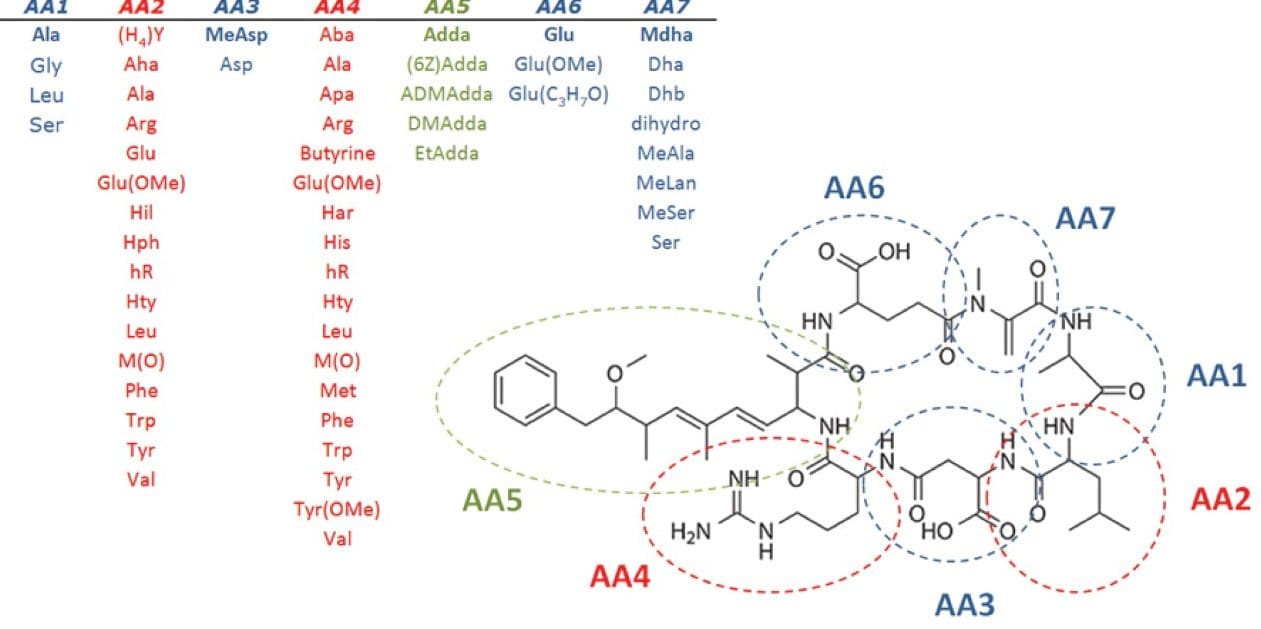
Lake closures due to harmful algae blooms have become a regular occurrence during the summer months. Recent data show that harmful algae blooms have been implicated in human and animal illnesses and death in at least 43 states in the U.S.1 In August 2016, at least 19 U.S. states reported public health advisories due to CyanoHABS.1 These algae blooms are fueled by phosphorus and nitrogen runoff from fertilizers, animal feedlots, and leaky septic systems. The algal population explosions occur due to higher summer temperatures believed to be caused by global warming. Blue-green algae generate microcystins which are cyclic heptatpeptide hepatotoxins produced by certain species of cyanobacteria found in freshwater environments. The structure of the most common microcystin, Microcystin-LR, is shown in Figure 1. These secondary metabolites are toxic to higher organisms, causing human sickness or even death in some cases.2 As they are produced in fresh and brackish waters, they can contaminate drinking water supplies. These public health advisories can cause panic and negatively impact state and municipal economies due to lost income from tourism, as was the case in Toledo Ohio in 2014, and the beach closures in Florida in July of 2016.
The WHO guideline limit for microcystin-LR is used in many countries. It includes a provisional value of 1 µg/L in drinking-water, and 10 µg/L for recreational exposure for total microcystin-LR (free plus cell-bound).3 Some countries have set their own limits for microcystin-LR in drinking water (e.g. Australia and Canada have 1.3 µg/L and 1.5 µg/L respectively). There are only a handful of microcystin standards available on the market, while approximately 100 different microcystins variants have been reported in literature. These variants are produced by the substitution of the seven amino acids. Figure 2 shows the possible substitutions of a microcystin. As regulations are constantly changing and the fact that other microcystins may have a similar toxic effect as the regulated LR, it is important to develop targeted and untargeted methods for the analysis of these compounds.
In this application note, we describe a method that utilizes a combination of LC and high resolution mass spectrometry (HRMS) to perform targeted screening of microcystins in lake water samples. A standard containing a mixture of 11 microcystins plus anatoxin A was used as a reference for positive identifications. Alongside the samples, a calibration curve of microcystin-LR was acquired to perform quantitation. The combination of accurate mass data for both precursor and fragment ions in a single analysis, combined with high quality UPLC separation was used to identify targeted compounds. As the data were acquired using a data-independent approach, additional compounds that were not included at the time of the initial analysis could be investigated.
Water samples from lakes in the U.S. were screened for 12 targeted compounds in the UNIFI Scientific Library. The library was generated by running a standard mix and includes structural information, molecular formula, and retention time for each of the targets. A calibration curve of microcystin-LR standard in HPLC water was also run between 0.1 to 50 µg/L in order to quantitate the amount in the samples. Data were acquired using full spectral acquisition and alternating high- and low-collision energy states (MSE). This allowed us to use the structural information to confirm the presence of targeted compounds.
Samples were obtained from U.S. lakes that reported harmful algae blooms in 2016. A lake water sample, a dock side sample, and scum layer sample were analyzed. The samples were lysed (freeze/thaw), filtered, and diluted before analysis. Prior to injection the samples were diluted 1 in 10 with water.
UPLC system: |
ACQUITY UPLC I-Class |
Column: |
ACQUITY UPLC HSS T3 1.8 μm, 2.1 x 100 mm |
Column temp.: |
35 °C |
Sample temp.: |
8 °C |
Flow rate: |
0.450 mL/min |
Injection volume: |
1, 5, and 10 μL |
Mobile phase A: |
0.1% formic acid in water |
Mobile phase B: |
0.1% formic acid in acetonitrile |
Total run time: |
12 min |
*This UPLC method was established and previously published by Waters.4
Min. |
Flow rate (mL/min) |
%A |
%B |
---|---|---|---|
Initial |
0.45 |
98 |
2 |
0.80 |
0.45 |
98 |
2 |
9.00 |
0.45 |
30 |
70 |
9.05 |
0.45 |
10 |
90 |
9.90 |
0.45 |
10 |
90 |
9.91 |
0.45 |
98 |
2 |
11.50 |
0.45 |
98 |
2 |
MS system: |
Xevo G2-XS QTof |
Ionization mode: |
ESI+ |
Collision energy (LE): |
4 eV |
Collision energy (HE ramp): |
25 to 80 eV |
Scan time: |
0.25 sec |
Acquisition range: |
50 to 1200 m/z |
Capillary: |
1.5 kV |
Sampling cone: |
36 V |
Source temp.: |
120 °C |
Source offset: |
50 |
Desolvation temp.: |
500 °C |
Cone gas flow: |
150 L/Hr |
Desolvation gas flow: |
1000 L/Hr |
Lockmass: |
Leucine enkephaline (556.2766 m/z) |
MassLynx v4.1 MS Software and the UNIFI Scientific Information System
A standard at 10 μg/L of all 12 standards in HPLC water was run in order to establish retention times for the UPLC method. These retention times were added along with molecular formula and available structural information to the UNIFI Scientific Library. The UNIFI library was used to interrogate the highly complex data set for the 12 target compounds. In order to ensure the system was performing as expected, the above standard mix was acquired along with the samples of interest. Figure 3A shows the results from the standard injections. Figure 3B overlay shows the extracted ion chromatograms for each of the 12 compounds found in the standard. The standard data shows that the retention time delta is very low and the mass error for each compound of interest is within 5 ppm.
Once it was established that the system was performing as expected, the four samples were run. A 1-µL aliquot from each sample was injected. The raw data was componentized and processed once by UNIFI Software.6 In order to review the data of interest, a user-defined filter was applied (Figure 4). This filter was defined by the quality of the standard data and only showed the identified compounds that were within 5 ppm mass error, 0.1 minute retention time error, and above a minimal response. These user-defined filters can be combined with pieces of data the analyst wants to view, as well as previously saved data so that the same workflow can be followed for further data review. UNIFI’s filters, views, and workflows allow analysts to follow their own protocol for interrogating data, and it can help standardize how the data is reviewed.
The results from each sample are shown in Figures 5a, 5b, and 5c. An example of one of the identifications depicted in these figures shows how an analyst can visualize the results. One of the advantages about using untargeted data acquisition is the ability to determine the presence different charge species of the target compounds. Microcystins can often form multiply charged species that can be potentially missed if the method is predefined by only one species. In this case both the single and double charged species were detected. By acquiring high and low energy data in one run the confirmation of the target compounds can be easily made. The high energy data is automatically used by the software to perform structural matching of the fragments to the compound of interest. Figure 6 shows the high and low energy spectra for the identification of microcystin-LR in the lake sample and in silico fragmentation using the compound’s structure.
Alongside the samples, a calibration curve for microcystin-LR was acquired in order to determine the concentration in the samples. Figure 7a shows the calibration curve for microcystin-LR between 0.1 and 50 µg/L, and Figure 7b shows the chromatogram for microcystin-LR at 0.1 ppb. The Xevo G2-XS QTof provided excellent mass accuracy across a wide dynamic range of detection (Table 1), demonstrating that this instrument is fit-for-purpose to achieve legislative limits in real samples. It also shows that even at low concentrations, the mass accuracy on the system is excellent and gives confidence in the quantitation data. The data obtained demonstrate that the Xevo G2-XS QTof is extremely sensitive and can be used to quantify low levels that meet regulatory requirements. When assessing the samples against the calibration curve and taking into consideration the dilution factors, the levels in the samples were 100 times higher than the action level for recreational water (Table 2). In drinking water, levels of contaminations will be a fraction of that at the source of the contamination. In this instance, to decrease detection limits even further, the use of 2D UPLC systems have been employed. These systems allow large volumes of water to be injected achieving lower detection limits.5
Microcystin-RR was not included in the UNIFI Scientific Library when the data was first acquired. In order to demonstrate that historical data could be reviewed on a QTof system, unlike traditional tandem quandrupole analysis, microcystin-RR was added to the scientific library by acquiring the standard using the same UPLC method. When working with a tandem quadrupole MS system, the MRM transitions must be defined up front and historical data review is not possible for compounds that were not included in the original method. It is not always possible to run the standard to add a compound to the library because they are not always available. If the standard is not available, the structure can be imported into the library and a literature search can be used to assess the relative retention time for that structure. Figure 8 shows the acquired standard spectra which displays a predominant doubly charged species. The sample data were then re-interrogated for the presence of microcystin-RR. In both the dock and scum samples, a significant level of microcystin-RR was found. Figure 9 shows the extracted ion chromatograms for both samples and the resulting spectra for microcystin-RR. The exact same data was used to detect and identify this additional compound. This approach allows historical occurrence studies to be performed on data in order to determine when emerging compounds were first present in recreational water.
720006016, May 2017