A complete LC-MS solution, including reagents and software, is presented for the analysis of complex biotherapeutics in serum.
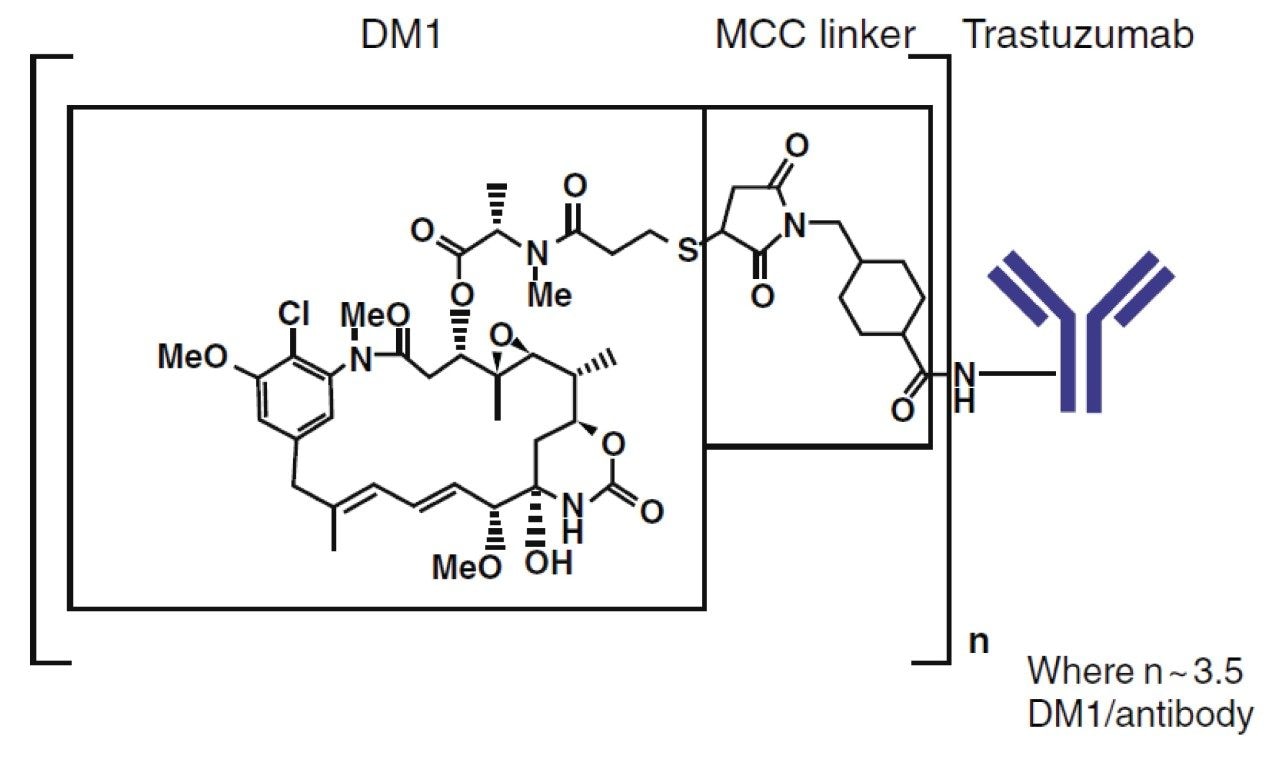
Antibody-drug conjugates (ADCs) are comprised of a cytotoxic drug attached at several locations to a monoclonal antibody (mAb) via a chemical linker. The therapeutic use of ADCs offers sustained release, with the benefit of targeted delivery of the cytotoxic payload, thereby enhancing efficacy as well as reduced toxicological burden.1 Ado-trastuzumab emtansine (T-DM1, Kadcyla) is an FDA and EMA approved ADC for the treatment of HER2-positive metastatic breast cancer. The linker in T-DM1, N-maleimidomethylcyclohexane-1-carboxylate (MCC), covalently attaches the warhead (DM1) to the antibody (trastuzumab) leading to a broad drug load distribution (mainly 0 to 8 conjugations) and a DAR (average number of drugs conjugations) of ~3.5 DM1 per antibody (Figure 1). The DAR and the drug load distribution are critical quality attributes as they can change over time due to biotransformation and/or different clearance rates, and should be assessed comprehensively in vivo. Therefore, bioanalytical methods for PK analysis capable of measuring all conjugated species of the ADC for an accurate representation of exposure are desirable. The most frequently used assays for T-DM1 quantitation are measurement of the released payload and antibody (total and conjugated).2 The released payload, being a small molecule, is preferentially measured by LC-MS/MS. For the total antibody (DAR 0–8) as well as conjugated antibody assays (DAR 1–8), ELISA remains the gold standard due to its unrivaled sensitivity and high throughput. However, ELISA is limited regarding obtaining structural information. DAR determination and biotransformation information are not provided as the assay does not differentiate individual DAR species. Therefore, LC-MS information complements ELISA, particularly for the measurement of DAR and drug load distribution.3
We set out to measure T-DM1 DAR and drug load distribution in biological matrix at different pharmacokinetic-relevant concentrations using immunoaffinity ultraperformance liquid chromatography high resolution mass spectrometry (IA-UPLC-HRMS). Purification from mouse serum is performed using streptavidincoated magnetic beads. Antigen-specific capture, based on recombinant biotinylated HER2, was successful in retaining trastuzumab emtansine on the beads. T-DM1 was eluted under acidic conditions in an aqueous environment and separated by reversed-phase LC on an ACQUITY UPLC H-Class PLUS Bio System. The Xevo G2-XS QTof Mass Spectrometer enabled qualitative analysis and quantification of ADC samples (Figure 2). Herein we show that UPLC-QTof can monitor the DAR of the therapeutic and provide consistent, reproducible measurements even at low levels in matrix.
T-DM1 was purified from mouse serum using magnetic beads. Briefly, 25 μL streptavidin-coated beads (Dynabeads M-280 Streptavidin, Thermo Fisher Scientific) were washed three times with HBS-EP buffer (GE Healthcare Life Sciences) and incubated with 2 μg biotinylated human HER2 in HBS-EP at room temperature for two hours. After washing with HBS-EP buffer, serum samples (5 μL) in HBS-EP buffer were added to the beads and the mixture was incubated overnight at 4 °C. Post capture, beads were washed with HBS-EP buffer and water. Elution of T-DM1 was performed by adding 100 μL of 10% acetonitrile in water with 1% formic acid. Using the protocol above, a dilution series of T-DM1 in matrix was prepared. The neat solution of T-DM1 was prepared in elution solvent.
LC system: |
ACQUITY UPLC H-Class PLUS Bio FTN |
Detection: |
Xevo G2-XS Mass Spectrometer, ESI+, sensitivity mode |
Column: |
ACQUITY UPLC Protein BEH C4, 300 Å, 1.7 μm, 2.1 × 50 mm (p/n: 186004495) |
Column temp.: |
80 °C |
Sample temp.: |
8 °C |
Injection volume: |
5 μL |
Mobile phases: |
A: 0.1% formic acid in water B: 0.1% formic acid in acetonitrile |
Time (min) |
Flow rate (mL/min) |
%A |
%B |
Curve |
---|---|---|---|---|
Initial |
0.2 |
90 |
10 |
6 |
1.0 |
0.2 |
90 |
10 |
6 |
2.0 |
0.2 |
75 |
25 |
6 |
7.0 |
0.2 |
50 |
50 |
6 |
7.5 |
0.2 |
5 |
95 |
6 |
8.0 |
0.2 |
5 |
95 |
6 |
8.5 |
0.2 |
90 |
10 |
6 |
9.0 |
0.2 |
5 |
95 |
6 |
10.5 |
0.2 |
90 |
10 |
6 |
12.0 |
0.2 |
90 |
10 |
6 |
Ionization mode: |
ESI+ |
Capillary: |
2.75 kV |
Cone: |
150 V |
Source temp.: |
150 °C |
Desolvation temp.: |
500 °C |
Desolvation gas flow: |
700 L/hr |
Cone gas: |
4 |
Acquisition mode: |
MS continuum |
Acquisition time: |
8 min |
Mass range: |
m/z 500–4000 |
MS scan time: |
1 sec |
(acquire LockSpray – apply correction) |
|
LockSpray reference compound: |
GFP (m/z 785.8426) |
Reference scan time: |
0.1 sec |
Lockmass frequency (interval, sec): |
120 sec |
Scans to average: |
3 |
Mass window: |
±0.5 Da |
For analysis of intact molecules, it is crucial that the system is fully passivated to manage loss of the biotherapeutic caused by non-specific binding. Protocols described in Waters Application Note “HRMS System Check for Intact Protein Quantification” (p/n: 720006614EN) were performed prior to analysis of samples.
Several different columns were screened and the ACQUITY UPLC Protein BEH C4, 300 Å, 1.7 μm, 2.1 × 50 mm Column was selected due to it having the best balance of performance in terms of reproducibility, robustness, and low carry-over. Using the gradient specified in the method, T-DM1 eluted at 5.4 minutes from the column (Figure 3A). The observed peak showed slight tailing which can be explained by the increasing hydrophobicity of the later eluting DAR species. Peak width is also broader than what is typical for monoclonal antibodies due to the contributions and heterogeneity of the various DAR species as well as glycoforms. The MS spectra of T-DM1 consist of an envelope of charge states ranging from about 70+ to 40+ centering around m/z 2700–3000 (Figure 3B). Deconvolution of the mass spectra showed a distribution of DAR species (0–8) with the most represented species being DAR 3 and 4 (Figure 3C). Naked antibody (DAR 0) and higher drug loads (DAR 7, DAR 8) species were very low in abundance. Individual DAR species also present various glycosylated variants (GOF, G1F, G2F).
The ADC DAR has been shown to change in vivo as the drug undergoes biotransformation.3 When measuring in vivo samples, it is imperative that the bioanalytical method is sound, and that the true biological biotransformation profile can be reproducibly captured and interpreted. T-DM1 was spiked in mouse serum at different concentrations to investigate the reliability of DAR and drug load distribution measurement across levels. The individual DAR values as well as the average DAR (DARav) in neat and in matrix were compared. There are potential sources of bias that can occur during IA-LC-MS. For example, the capturing reagent should not preferentially bind some DAR species over others. The HER2 binding site is located far away from drug and glycoform binding regions and should therefore present less bias for binding the ADC variants.4 Biotinylated HER2 was also selected for its broader compatibility across matrix/species types, particularly human versus other anti-IgG or anti-Fc approaches. In our studies, blank matrix noise levels were also found to be lower with HER2 compared to the other approaches tested (data not shown). An excessive amount of capture reagent was used to avoid saturation of the beads, especially at high concentrations. The chromatograms of the blank serum as well as different concentrations ranging from 5–100 μg/mL are depicted in Figure 4. Linearity was established through quantification of the intact ADC by extracted ion chromatogram (XIC). The 53+ charge state ion of GOF/G1F of DAR 3 with an m/z of 2851.7697 was selected with an extraction window of 500 mDa and produced good linearity in the range of 5–100 μg/mL. An example of a quantification run processed in UNIFI is shown in Figure 5.
Spectra were also deconvoluted (protein deconvolution using MaxEnt1) to get information on the individual DAR species present. Deconvolution allows a simplification of the mass spectrum by collapsing the multiple charge states of all represented ions to a single neutral intact mass representation. UNIFI software enabled deconvolution of the T-DM1 samples down to low concentrations. Custom fields with corresponding formula were applied during the deconvolution process allowing for the automatic calculation of DAR. An example of deconvolution results depicting the different species of T-DM1, response, observed mass, error (ppm), retention time, percent ADC response, and average DAR is shown in Figure 6. The bottom panel in Figure 6 shows the deconvoluted chromatogram (left) and the spectrum (right). Application of this deconvolution process to T-DM1 spiked in mouse serum over a concentration range of 5–50 μg/mL showed identification of the individual DAR species (0–8) with their main glycoforms (GOF, G1F, G2F).
As expected, the DAR species on the edge of the distribution profile (very low and very high DAR values) become more challenging to measure as the concentration (and instrument response) of T-DM1 in matrix decreases (Figure 7A). However, the most abundant species (3–4) are still well detected even at low concentrations as shown in the zoomed deconvolution spectrum (Figure 7B).
Each sample of T-DM1 across the concentration range was run in replicates (n = 5) in buffer (Figure 8A) and mouse serum (Figure 8B), and the drug load distribution as well as average DAR were automatically calculated and plotted. The error bars represent the standard deviation of the measurements. In general, the biological replicates showed confidence of the measurement down to low concentrations. Variability increased slightly with decreasing concentration and in biological matrix, however, the profile and calculated average DAR are still in good agreement over the concentration range tested.
In vitro stability was conducted by spiking T-DM1 at a concentration of 50 μg/mL in buffer (PBS, pH 7.4 with 0.5% BSA) and in mouse serum. The experiment was carried out in triplicate incubations (n = 3). Samples were incubated over five days at 37 °C. Aliquots were taken at specific timepoints (0, 24, 48, and 120 hours) for analysis. The data is presented in Figure 9. The top graph depicts the average response over time in a semi-logarithmic scale. In general, there is a negligible decrease in response over time both in buffer and matrix. The average DAR was not found to change significantly in both assay conditions for the entire length of the incubation. This is consistent with previous reports showing that the linker in T-DM1 is relatively stable in vivo.3
ADCs have high heterogeneity arising from the structural complexities and permutations of its individual components (antibody, linker, and payload). With careful sample preparation and optimized LC analysis, they can be analyzed using HRMS to acquire quantitative and qualitative information. Complementary to ELISA, intact mass analysis of the ADC by LC-MS enables the detection and quantification of individual DAR species and major glycoforms. IA-UPLC-HRMS further enhances understanding of the PK of ADCs by observing the behavior and/or measuring individual DAR species during PK and/or pharmacodynamic (PD) experiments. UNIFI provides scientists with the features and capabilities to perform quantification and qualitative assessment of biotherapeutics in compliant-ready software.
720006673, September 2019