• Application Note

High Throughput Non-Targeted Screening Using a Rapid Gradient Microbore UPLC Method and a Library of FDA-Approved Small Molecule Drugs

High Throughput Non-Targeted Screening Using a Rapid Gradient Microbore UPLC Method and a Library of FDA-Approved Small Molecule Drugs

  • Michael McCullagh
  • Jeff Goshawk
  • Russell J. Mortishire-Smith
  • Waters Corporation

Abstract

Rapid gradient microbore UltraPerformance Liquid Chromatography was combined with ion mobility mass spectrometry (RGM-UPLC-IM-MS) to generate a library of reference data for a set of FDA-approved small molecule drugs. The incorporation of collision cross section (CCS) values provides a routine and robust non-targeted screening approach that can provide additional multi-factor authentication specificity when used in conjunction with retention time, accurate mass, and product ions. The RGM-UPLC-IM-MS library comprises data for 1206 ES+ measurements and 756 ES- measurements (representing a total of 1285 drugs). Rapid gradient microbore chromatography has a relatively low total peak capacity compared to conventional chromatography, however, when combined with ion mobility mass spectrometry separation, peak capacity can be retained, while simultaneously improving non-targeted analysis screening efficiency.1 RGM-UPLC-IM-MS non-targeted screening may be used in areas of research, where a drive for higher sample throughput, time efficiency, and cost reduction exists. We have used the library generated to perform a human urine drug screen of a subject sample to identify administered pharmaceutical compounds and distinguish them from the endogenous compounds of the complex biological matrix. Measured CCS values were within 1% of library values, an identification was confirmed with additional data filters of mass accuracy within 5 ppm and product ion count ≥1. The screening approach facilitates increased sample throughput and when compared to conventional UPLC-IM-MS, comparable detection rates have been observed. 

Benefits

  • A high throughput RGM-UPLC-IM-MS small molecules library has been generated incorporating retention times, precursor ions, product ions, and CCS
  • ES+ and ES- libraries were generated for a total of 1285 compounds
  • Increased analysis flexibility
  • Enhanced identification confidence in complex matrices

Introduction

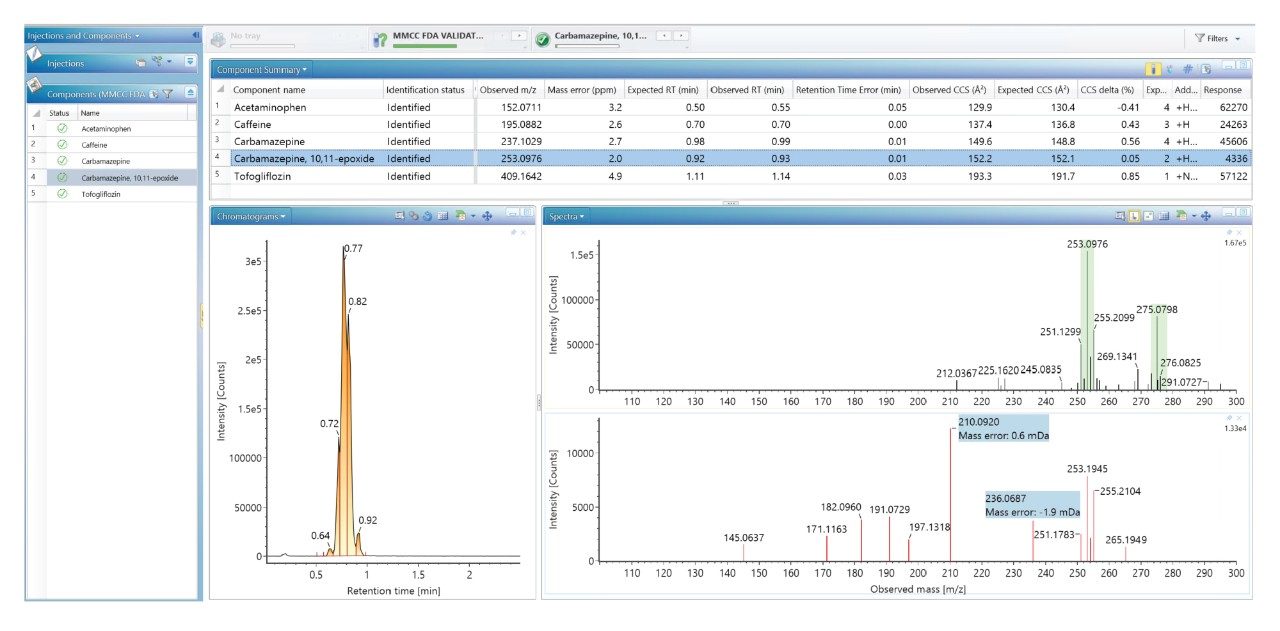
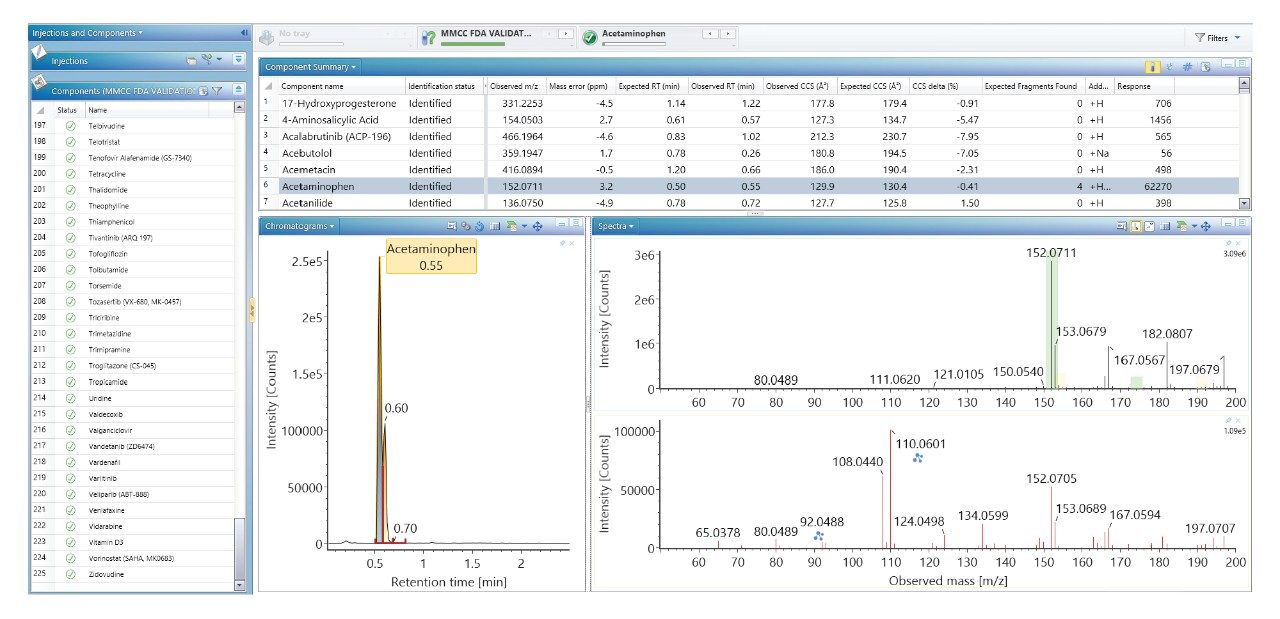
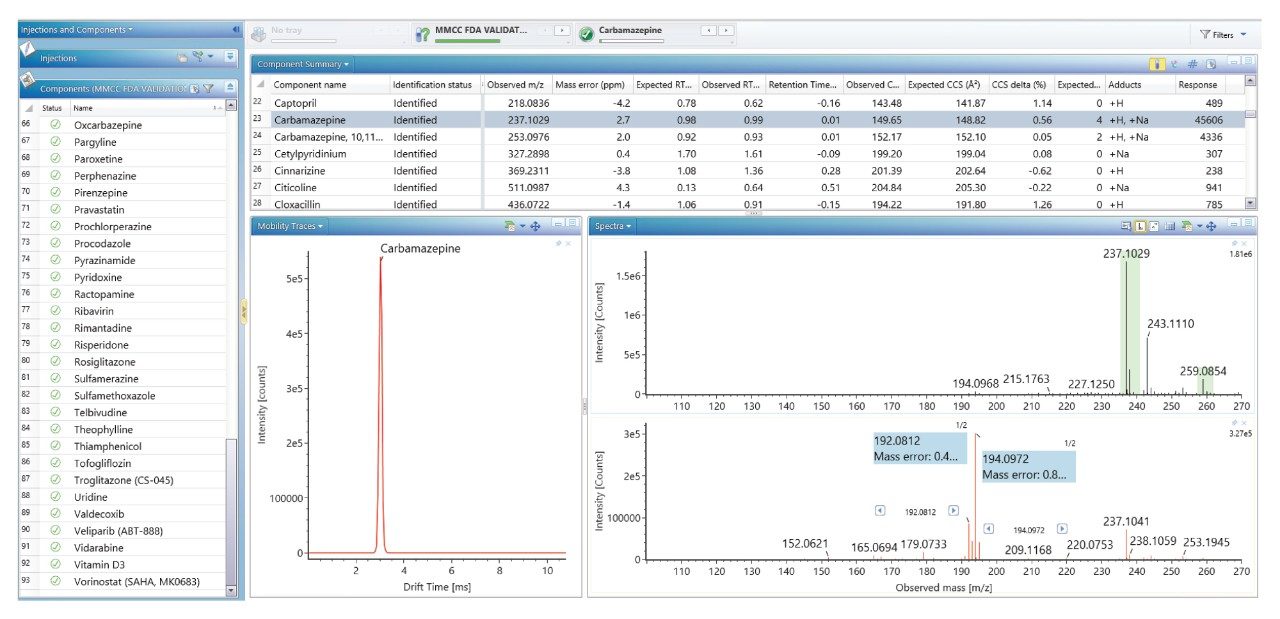
Using a previously described strategy for mass spectrometry library generation,2 a set of FDA-approved small molecule pharmaceuticals were characterized using rapid gradient microbore ultraperformance liquid chromatography ion mobility mass spectrometry (RGM-UPLC-IM-MS). The library generated can be used to facilitate tandem, ToF, or IM based analysis. The strategy employed provides retention time (tr), precursor ion, product ion, and collision cross section (CCS) data for the analytes characterised. A mass spectrometry library has previously been produced using a conventional UPLC method which had a total cycle time of 12 min, where a 2.1 mm × 100 mm column was used, with an applied eluent flow rate of 0.5 mL/min. Here an equivalent rapid gradient microbore UPLC-IM-MS library has been generated, using a rapid microbore metabolic profiling UPLC-MS method, where an eluent flow rate of 0.4 mL/min was employed with a 1 mm × 50 mm column, these conditions reduced the total analysis cycle time to 2.5 min. The conventional and rapid gradient UPLC-MS methods provided peak capacities of 150 and 50 respectively.3

High resolution mass spectrometers (HRMS), such as quadrupole time-of-flight (Q-Tof) mass analyzers, have become more prevalent as screening tools in clinical, forensic toxicology, and metabolite identification research areas.4,5 In non-targeted “full scan” data acquisition, thousands of detections can be made in a single analysis, which is subsequently followed by retrospective targeted data analysis.6 In many areas of research (for example testing for pesticides, mycotoxins, and natural plant toxins), there exists a drive towards higher sample throughput, time efficiency, and cost reduction, which has resulted in movement towards multiclass compound analysis.7 Such a goal, given the common challenge of sample complexity, also exists in metabolic phenotyping which is performed to understand the interactions between genotype, environment and lifestyle, at the molecular level. These investigations may comprise thousands of preclinical metabolism/toxicological, clinical, and epidemiological samples.3

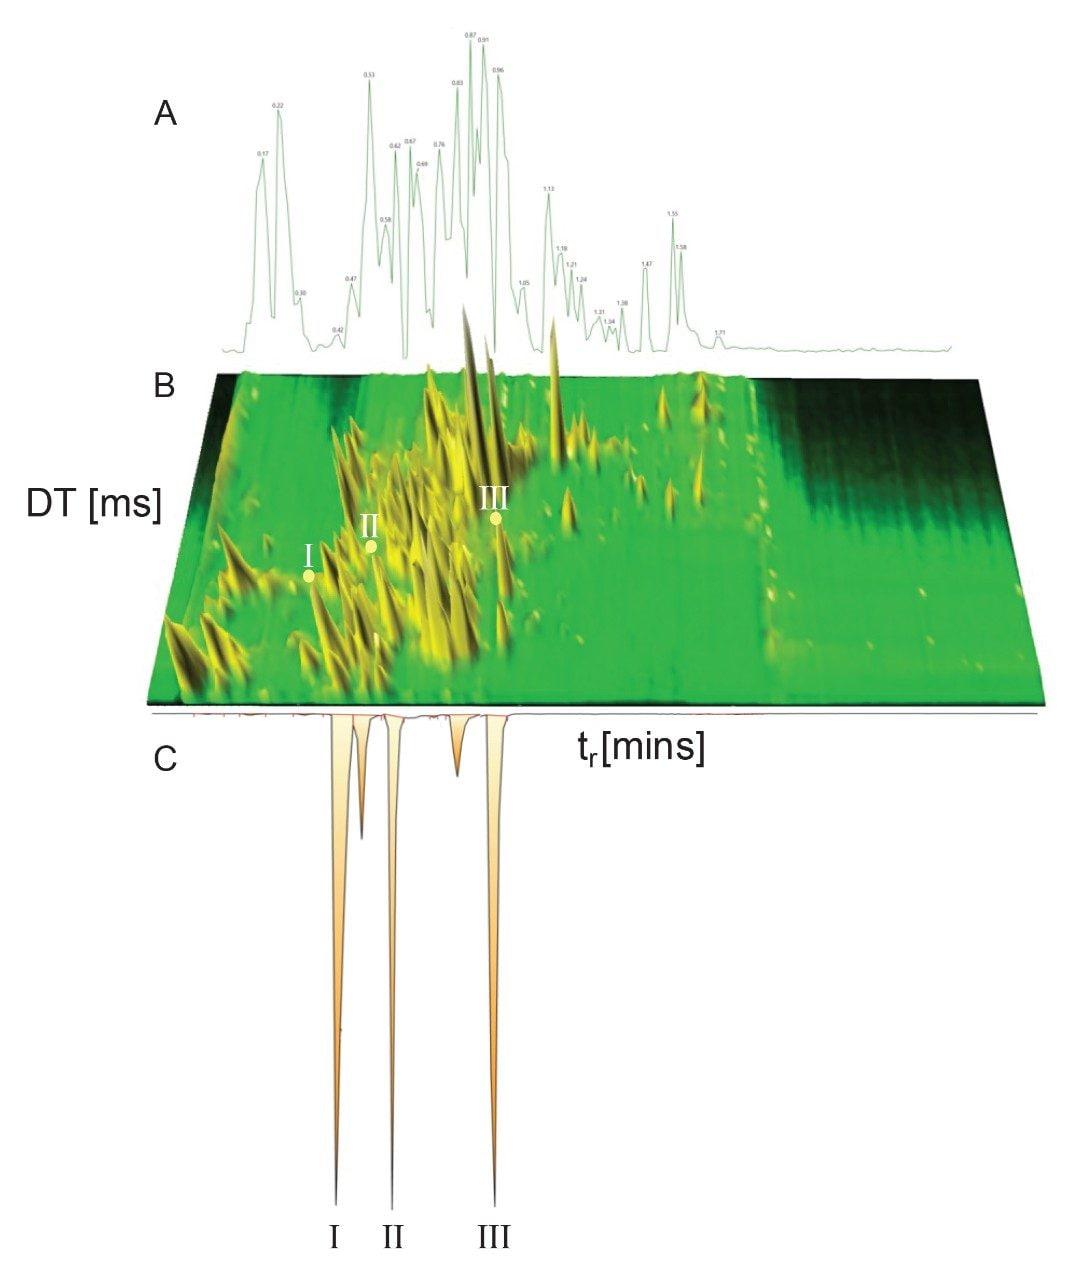
Dwivedi et al discussed the orthogonality of LC, MS, and IM, showing that peak capacity is increased between a factor of 2 to 10, depending on the MS and IM resolution.8 Combining the RGM-UPLC method with ion mobility mass spectrometry affords the opportunity to enhance peak capacity, specificity and analysis flexibility, while retaining the time efficiency of a strategy that provides a 5-fold increase in sample throughput.9,10 UPLC-IM comprises ion mobility (gas phase separation prior to MS analysis) coupled with UPLC (neutral species separation).11,12 The timescale of UPLC (seconds), IMS (milliseconds), and time-of-flight MS (microseconds) are compatible with the requirement of high throughput analysis of complex samples. Ion mobility separation of compounds results from gas phase ions being separated within a gas-filled travelling wave ion mobility (TWIM) RF ion guide of the mass spectrometer, prior to the mass analyzer. Mobility separation is obtained by driving packets of ions through an inert buffer gas (nitrogen) using a relatively weak electric field. The number of collisions between ions and the buffer gas cause drift time differences. The resultant separation is based on the application of repeating DC pulses along the RF ion guide; periodically ions are overtaken by the pulses or waves, where fewer mobile species are overtaken more frequently than higher mobility species. Hence the time to traverse the device is mobility dependent and is governed by factors such as the ion mass, charge, and shape. Ion mobility provides an added dimension of separation to that of LC (hydrophobicity) and MS (m/z), in addition to CCS (collision cross section), a complementary identification metric. The utility of CCS to increase identification specificity has been illustrated across a wide range of applications including metabolite identification, pesticide analysis, mycotoxin screening, medicinal plants speciation studies, and food additives analysis.10,13-17

We have used a library of data for a set of small molecule FDA-approved pharmaceuticals to perform a human urine drug screen of a healthy volunteer sample to identify administered pharmaceutical compounds and distinguish them from the endogenous compounds of the complex biological matrix. The feasibility of the approach has been assessed, via comparison of the application of conventional UPLC-IM-MS and RGM-UPLC-IM-MS libraries.

Experimental

Sample Description

Human urine sample diluted 10:1 (H2O)

Sample taken 6 hrs after medication was administered

Carbamazepine Dosage 2 x 200 mg tablets

Acetaminophen Dosage 2 x 500 mg tablets 

Method Conditions

LC Conditions

LC system:

Waters ACQUITY UPLC I-Class

Vials:

LCMS Certified Clear Glass 12 x 32 mm Screw Neck Total Recovery Vial, with Cap and Pre-slit PTFE/Silicone Septa, 1 mL Volume, p/n 600000671CV

Column:

ACQUITY UPLC HSS T3 C18 (50 mm x 1.0 mm, 1.8 µm) Column

Column temp:

40 °C

Sample temp:

4 °C

Injection volume:

4 µL

Flow rate:

0.4 mL/min

Mobile phase A:

Water (containing 0.1% formic acid v/v)

Mobile phase B:

Acetonitrile (containing 0.1% formic acid v/v)

Gradient

MS Conditions

MS system:

SYNAPT G2-Si

Ionization mode:

ESI+

Acquisition range:

m/z 50-1200

Acquisition rate:

10 spectra per second

Capillary voltage:

1.5kV

Desolvation temperature:

550 °C

Source temperature:

150 °C

Lockmass:

Leucine enkephalin (m/z 556.2766)

Acquisition mode:

HDMSE

Collision energy:

Collision energy ramp (15 to 25eV)

IMS parameters:

Default include: T-Wave Velocity Ramp = Start: 1000 m/s End: 300 m/s, T-Wave Pulse Height = 40V and a gas flow of helium 180 mL and nitrogen 90 mL (buffer gas) for the respective gas cells was used, giving an IM cell pressure of ~3.2 mBar

Calibration:

IMS/ToF Calibration Kit (p/n 186008113) (Waters Corp. UK)

Data Management

Chromatography software:

MassLynx v4.2 SCN 983

MS software:

MassLynx v4.2 SCN 983

Informatics:

UNIFI v1.94

Library average CCS values were determined using an in-house version of UNIFI v1.94

Results and Discussion

The screening library contains data for 1285 compounds, of which 1206 entries were in positive ion mode (comprised of 1082 [M+H]+ and 766 [M+Na]+ species). In negative ion mode the library contains 762 entries (comprised of 732 [M-H]- and 104 [M-H+HCOO]- species. (FDA Approved Drugs Profiling CCS Library).

Using a rapid gradient strategy has been shown to reduce peak capacity by ~66%.3 Utilizing ion mobility, a high throughput strategy can be employed, but with increased peak capacity (compared to conventional MS). Here we gauge the impact upon detection efficiency with that of a conventional UPLC-IM-MS library. Additionally, we assess the value of applying unconventionally wide retention time screening parameters, using a post-acquisition processing workflow.

This library-based screening approach provides a route to distinguishing xenobiotic exogenous species from the endogenous components of complex biological matrices such as urine. The complexity of a urine matrix is illustrated in Figure 1, where the extracted base peak ion chromatogram is comprised of 1000’s of major and minor components (10,482 candidate masses detected with an intensity >100 counts.)

Figure 1. Rapid microbore gradient UPLC-IM-MS separation obtained for human urine screening. A) Base peak ion chromatogram, and B) ion mobility drift time separation. C) Combined reconstructed extracted mass chromatograms for (I) acetaminophen, (II) caffeine, and (III) carbamazepine.

However, compared to conventional UPLC, the chromatographic peak capacity is decreased, nevertheless the extracted mass chromatogram shown in Figure 1 for acetaminophen, caffeine, and carbamazepine, illustrates that chromatographic integrity is retained. It can be seen from the ion mobility axis (DT[ms]) that 2D separation is observed for the combination of UPLC-IM, which provides enhanced peak capacity. This increased peak capacity facilitates generation of single component drift time and retention time aligned product ion spectra, enabling product ion spectra to be produced simultaneously for non-targeted analytes, along with retention time and collision cross sections.

The ion mobility separation, illustrating the combined peak capacity of UPLC-IM, is shown in Figure 1, in which chromatographically coeluting components are separated in the IM dimension. Illustration of the highly specific tr/DT precursor and product ion spectra are shown for the identified components, carbamazepine-10, 11-oxide in Figure 2, acetaminophen in Figure 3, and carbamazepine in Figure 4. Using typical non-targeted screening tolerances (tr (0.1 min) and mass accuracy (+/-5 ppm), ΔCCS (<2%), and product ion count (≥1)), 5 identifications were observed including carbamazepine. For carbamazepine, accurate mass measurement (2.7 ppm), retention time error (0.01 min), product ions (4) and ΔCCS (0.56%) were obtained. The summary of the impact of sequential application of post-acquisition processing workflow filtering parameters, to reduce false detections, applied within a retention time tolerance of 0.1 min are presented in Table 1. Ultimately using a rapid screening approach, only one false detection was observed and identified as tofogliflozin. Results obtained with the conventional UPLC-IM-MS approach indicate that the subject, for whom urinary screening has been performed, was administered acetaminophen and carbamazepine. The metabolite carbamazepine-10, 11-epoxide was also detected as well as the caffeine biotransformation product theophylline. 

Figure 2. Detection results (identified count 5) for screening against fast gradient FDA small molecule library, applied tr tolerance 0.1 min, and mass accuracy +/-5 ppm.
Figure 3. Post-acquisition processing workflow filtered detection results (identified count 225) for screening against FDA approved drug small molecule library, applied tr tolerance 2.0 min, mass accuracy +/-5 ppm.
Figure 4. Post-acquisition processing workflow filtered detection results (identified count 93) for screening against 1285 FDA approved drug small molecule library, applied tr tolerance 2.0 min, mass accuracy +/-5 ppm, and Δ CCS <2%.
Table 1. Sequential application of combined post-acquisition processing workflow filtering parameters to reduce false detections using an applied tr tolerance 0.1 min.

To further illustrate the analysis flexibility that can be obtained using cumulative specificity and the utility of combining accurate mass measurement, retention time, product ions, and CCS, the data processing parameters were adjusted to allow a wider retention time tolerance. Increasing the retention time tolerance to 0.5 min provides flexibility to overcome retention time shifts that can occur when analysing complex matrices,18 (thus avoiding potential false negative detections) as well as providing flexibility to use different chromatographic gradient elution methods. The summary of the impact of sequential application of combined post-acquisition processing workflow filtering parameters to reduce false detections applied with an increased retention time tolerance of 0.5 min are presented in Table 2. One additional detection (adenosine) was observed after increasing the retention time tolerance five-fold, although the detection response is low (578), the observed mass measurement error was 1.4 ppm, with one matching product ion and a retention time error of 0.12 min, it is probable endogenous adenosine has been identified.

Table 2. Sequential application of combined post-acquisition processing workflow filtering parameters to reduce false detections using an applied tr tolerance 0.5 min.
Table 3. Sequential application of combined post-acquisition processing workflow filtering parameters to reduce false detections using an applied tr tolerance 2.0 min.

The impact on the false positive detection rate of using a post-acquisition processing workflow are shown in Figures 3, 4, and 5. Figure 5 illustrates a workflow, that can be used to apply post-processing tolerance filtering parameters. Using a mass accuracy tolerance of +/-5 ppm and a 2.0 min retention time tolerance, 225 detections were observed (Figure 3). Incorporating CCS specificity reduces the detections to 93 with 132 false detections removed. Filtering based on identification of at least one product ion count reduces the number of observed detections to 7. It was seen that when the retention time tolerance was increased from 0.5 min to 2 min one additional detection was observed (theophylline), which was identified as a column breakthrough peak. The incorporation of CCS into mass spectrometry libraries and the use in non-targeted screening workflows affords the opportunity to increase specificity of identification using a multifactor authentication strategy, while simultaneously increasing the flexibility of the analysis strategy and enhancing sample throughput efficiency.

Figure 5. Post-acquisition processing workflow filtered detection results (identified count 7) for screening against FDA approved drug small molecule library, applied tr tolerance 2.0 min, mass accuracy +/- 5 ppm, Δ CCS <2%, and product ions ≥1.

Conclusion

A library of data obtained for a set of small molecule FDA approved pharmaceuticals (1285 ES+ and 756 ES-) was used to facilitate non-targeted screening of a healthy subject urine sample. The complex biological matrix present in human urine was screened using non-specific retention time tolerances and afforded comparable detection rates to a longer UPLC-IM-MS method. The incorporation of CCS into mass spectrometry libraries and the use in non-targeted screening workflows affords the opportunity to increase specificity of identification, while simultaneously increasing acquisition strategy flexibility. UPLC-IM library versatility has been illustrated, facilitating the potential of high throughput screening which can subsequently improve analysis time efficiency and provide cost savings. This also presents the opportunity to reduce solvent consumption and associated costs.

References

  1. Rainville PD, Wilson ID, Nicholson JK, Isaac G, Mullin L, Langridge JL, Plumb RS. Ion Mobility Spectrometry Combined with Ultra-Performance Liquid Chromatography/Mass Spectrometry for Metabolic Phenotyping of Urine: Effects of Column Length, Gradient Duration and Ion Mobility Spectrometry on Metabolite Detection. Analytica Chimica Acta. Volume 982, 22 August 2017, Pages 1–8.
  2. Goshawk J, Barknowitz G, McCullagh M. Workflow for Automatic MS Library Creation from Time-of-Flight Full-Spectra Data Processed in UNIFI. Waters Application Note 720006783EN, 2020 Feb.
  3. Gray N, Adesina-Georgiadis K, Chekmeneva E, Plumb RS, Wilson ID, Nicholson JK. Development of a Rapid Microbore Metabolic Profiling UltraPerformance Liquid Chromatography-Mass Spectrometry Approach for High-Throughput Phenotyping Studies. Anal. Chem. 2016, 88, 5742−575.
  4. Sundström M, Pelander A, Ojanperä I. Comparison Between Drug Screening by Immunoassay and Ultra-High Performance Liquid Chromatography/High-Resolution Time-Of-Flight Mass Spectrometry in Post-Mortem Urine. Drug Test. Anal. 2015; 7:420–427.
  5. Mollerup CB, Dalsgaard PW, Mardal M, Linnet, K. Targeted and Non-Targeted Drug Screening in Whole Blood by UHPLC-TOF-MS with Data-Independent Acquisition. Drug Test. Anal. 2016; DOI: 10.1002/dta.2120.
  6. López M, Fussell R, Stead S, Roberts D, McCullagh M, Rao R. Evaluation and Validation of an Accurate Mass Screening Method for the Analysis of Pesticides in Fruits and Vegetables Using Liquid Chromatography-Quadrupole Time-of-Flight-Mass Spectrometry with Automated Detection. Journal of Chromatography A, 1373, 2014, 40–50.
  7. Dzumana Z, Zachariasovaa M, Veprikovaa Z, Godulab M, Hajslovaa J. Multi-Analyte High Performance Liquid Chromatography Coupled to High Resolution Tandem Mass Spectrometry Method for Control of Pesticide Residues, Mycotoxins, and Pyrrolizidine Alkaloids. Anal. Chim. Acta. 2015; 863:29–40.
  8. Dwivedi P, Puzon G, Tam M, Langlais D, Jackson S, Kaplan K. Metabolic Profiling of Escherichia coli by Ion Mobility-Mass Spectrometry with MALDI Ion Source. J. Mass Spectrom. 2010, 45 (12), 1383−1393.
  9. Letertre M, Munjoma NC, Slade SE, Plumb RS, Swann J, Coen M, Nicholson JK, Wilson ID. Metabolic Phenotyping Using UPLC–MS and Rapid Microbore UPLC–IM–MS: Determination of the Effect of Different Dietary Regimes on the Urinary Metabolome of the Rat Chromatographia. Volume 83, Pages 853–861 (2020).
  10. McCullagh M, Douce D, Van Hoeck E, Goscinny S. Exploring the Complexity of Steviol Glycosides Analysis Using Ion Mobility Mass Spectrometry. Anal. Chem. 2018, 90, 4585–4595.
  11. Giles K, Pringle SD, Worthington KR, Little D, Wildgoose J, Bateman RH. Applications of a Travelling Wave-Based Radio-Frequency Only Stacked Ring Ion Guide. Rapid Commun. Mass Spectrom. 2004, 18, 2401.
  12. Pringle SD, Giles K, Wildgoose, J. An Investigation of the Mobility Separation of Some Peptide and Protein Ions Using a New Hybrid Quadrupole/Travelling Wave IMS/oa-ToF Instrument. International Journal of Mass Spectrometry. 2014, 26, 1–12.
  13. McCullagh M, Pereira C.AM, Yariwake JH. Use of Ion Mobility Mass Spectrometry to Enhance Cumulative Analytical Specificity and Separation to Profile 6‐C/8‐C glycosylflavone Critical Isomer Pairs and Known–Unknowns in Medicinal Plants. Phytochemical Analysis. 2019, 30(4), 1–13.
  14. Goscinny S, McCullagh M, Far F, De Pauw E, Eppe G. Towards the Use of Ion Mobility Mass Spectrometry Derived Collision Cross Section as a Screening Approach for Unambiguous Identification of Targeted Pesticides in Food. Rapid Commun. Mass Spectrom. 2019, 33(S2), 1–15.
  15. Nye LC, Williams, JP, Munjoma NC, Letertre, MPM, Coen M, Bouwmeester R, Nicholson, JK, Plumb RS, McCullagh M, Gethings L, Lai S, Langridge J, Vissers JPC, Wilson ID. A Comparison of Collision Cross Section Values Obtained via Ion Mobility Spectrometry Following Direct Infusion and an Evaluation of U(H)PLC-IM-MS for the Characterisation of Metabolites in Rat Urine. J Chromatogr A. 2019 Sep 27; 1602:386–396.
  16. McCullagh M, Goshawk J, Eatough D, Mortishire-Smith R, Pereira CAM, Yariwake JH, Vissers JPC. Profiling of the Known-Unknown Passiflora variant Complement by Liquid Chromatography - Ion Mobility - Mass Spectrometry. Vissers. Talanta 221, 2021, 121311.
  17. Righetti L, Dreolin N, Celma A, McCullagh M, Barknowitz G, Sancho JV, Dall’Asta C. Travelling Wave Ion Mobility-Derived Collision Cross Section for Mycotoxins: Investigating Interlaboratory and Inter-Platform Reproducibility.. J. Agric. Food Chem. 2020, Publication Date: September 1, 2020.
  18. Fang N, Shanggong Y, Ronis M, and Badger M. Matrix Effects Break the LC Behavior Rule for Analytes in LC-MS/MS Analysis of Biological Samples. Experimental Biology and Medicine 2015; 240: 488–497.

720007174, March 2021

Back To Top Back To Top