A Systematic Quick Method Development Approach to Optimize Protein Size Exclusion Chromatography
Abstract
Methods for size exclusion chromatography (SEC) must be robustly developed, with the goal of identifying conditions that mitigate undesired secondary interactions and thereby produce an entropically driven separation based on size. With proteins, there is a chance for both unfavorable electrostatic and hydrophobic interactions. The surfaces that are the basis of the new Premier Protein SEC column technology allow for broader usability of this separation technique. Nevertheless, it is always worthwhile to systematically develop new analytical methods. With this work, we provide a 23 Design of Experiment (DoE) approach that incorporates screening a low and high variable state for mobile phase buffer strength, co-solvent concentration, and column temperature. This cubic experimental design can be investigated with less than two hours of instrument run time and the results can be fit with a linear model using simple spreadsheet formula calculations. Examples for two monoclonal antibodies and an antibody drug conjugate are presented, and a corresponding spreadsheet template has been made available online to help others expedite their own method development work.
Benefits
- Fast, systematic approach to optimize SEC separations
- With the applied methodology, optimal conditions can be determined with only 8 experiments and two hours of experimental work
- Aggregate recovery (HMWs%), resolution (Rs) and peak width (w1/2) are monitored as response functions of a factorial experimental design
Introduction
Size exclusion chromatography (SEC) is a historical technique employed for the characterization of therapeutic proteins and considered a standard method (along with analytical ultracentrifugation (AUC) and dynamic light scattering (DLS)) for the routine qualitative and quantitative analysis of protein aggregates. One of the advantages of this technique is the use of mild, non-denaturing mobile phase conditions. With this type of application, there can, however, be challenges resulting from nonspecific interactions within the SEC Column. There can be undesired interactions between protein species and the packing material as well as the column hardware, so method parameters must be given special consideration.1 Some generic rules can be applied for method development, and the use of factorial design of experiments (DoEs) can be helpful in addressing nonspecific interactions.
In SEC, partitioning effects between the bulk mobile phase and the interior volume of the packing material is ideally driven by entropic processes without any physicochemical adsorption. However, in practice, this is rarely achieved. Large biomolecules (e.g. monoclonal antibody (mAb) based drugs) exhibit multifaceted surfaces with varying degrees of hydrophobicity and electrostatic properties. Therefore, potential for both hydrophobic and electrostatic secondary interactions with both the packing material and chromatographic hardware (e.g. column frit), can result in detrimental effects to peak recovery, peak shape, and method robustness. To alleviate these types of undesired secondary interactions, method parameters should be carefully optimized.
Two important considerations are (1) the use of inert column hardware and (2) the optimization of method parameters. With the latter, it is possible to fine tune method capabilities with the adjustment of salt and organic modifier concentrations in the mobile phase, column temperature, and flow rate.2,3 When it comes to SEC method development, the first step should be the selection of a suitable packing material. It is common practice to choose a packing material with an average pore diameter that is two to three times that of the intended analyte. For example, most mAbs will have an average radius of hydration of around 50 Å. Moreover, the radius of hydration of a mAb aggregate can be about 100 Å. Therefore, the most suitable average pore diameter for a mAb SEC separation is generally 200 to 300 Å. The elution volume of the different species and the selectivity between them are ideally determined only by the pore size and pore size distribution of the packing material. However, when nonspecific interactions occur, the solutes might be retained and elute as broader, asymmetrical peaks, compromising both separation resolution and aggregate quantitation.
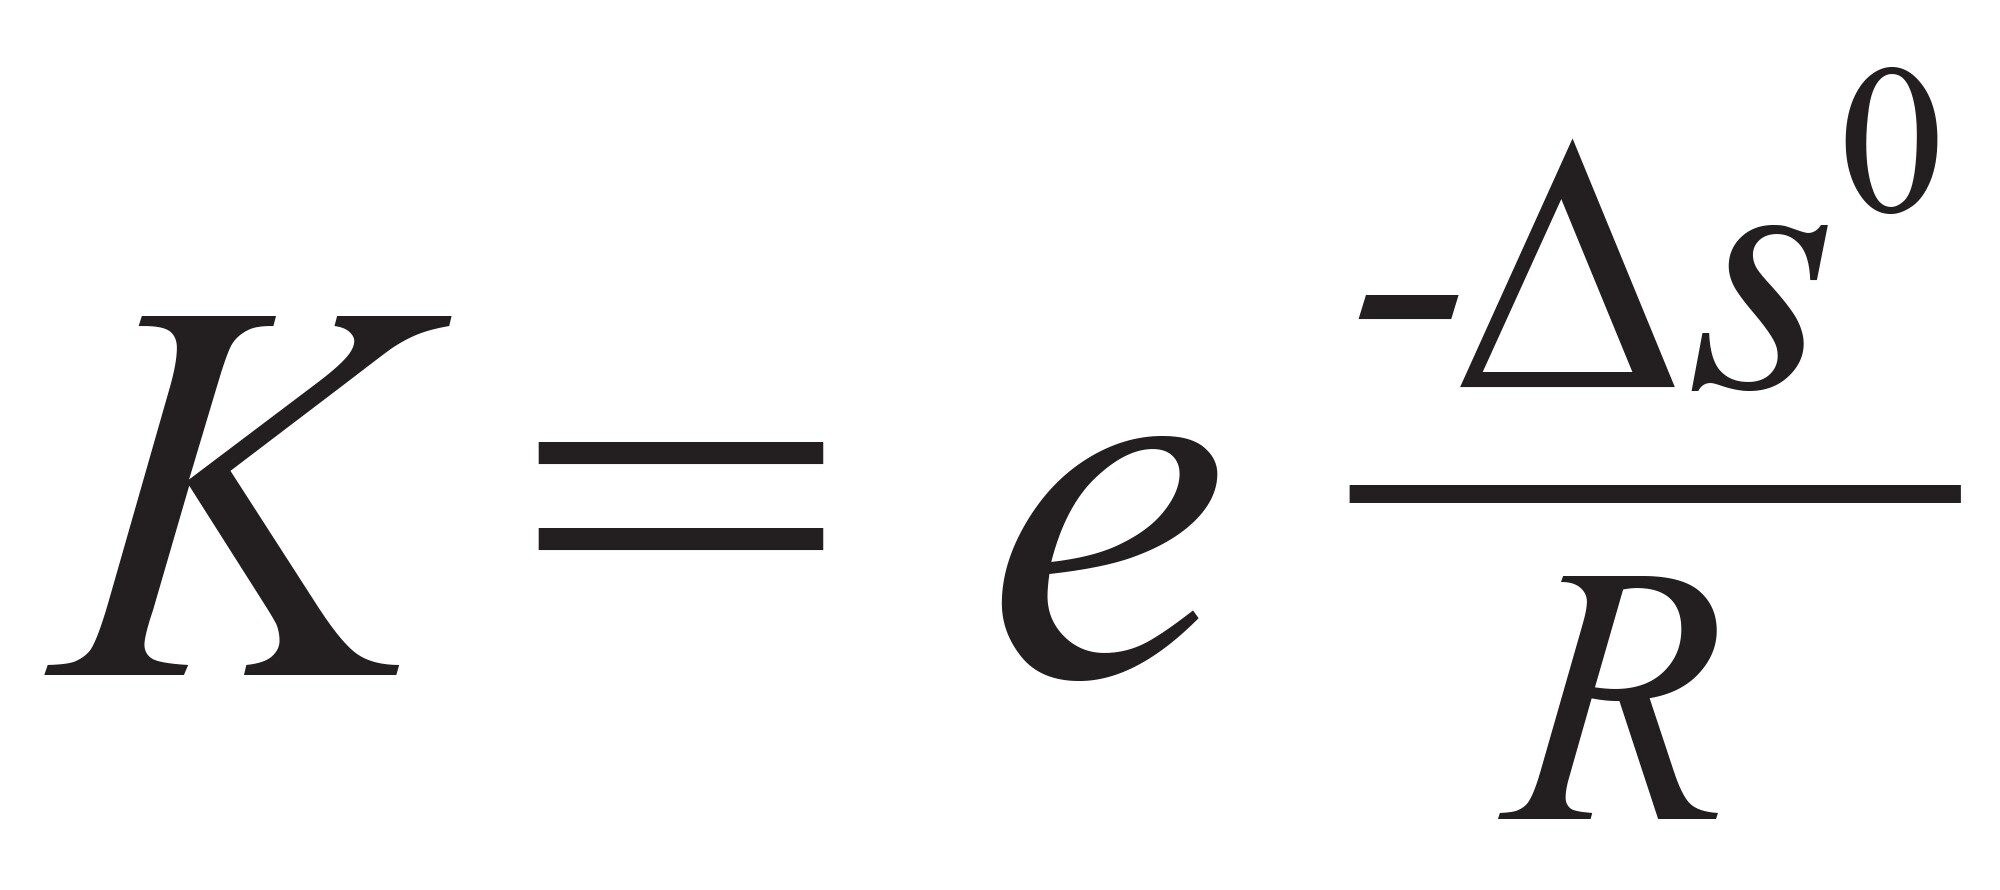
To reduce electrostatic interactions, it is common to increase the ionic strength or salt concentration of the mobile phase.4,5 Organic modifiers (e.g., methanol, ethanol, acetonitrile) can also be used to reduce the strength of any hydrophobic interactions, often improving peak shape with the addition of 5–10% organic modifier.6 Since SEC equilibrium relies on entropy, temperature has little to no effect on the equilibrium constant (K) and thus on the zone retention factor (k”). (Please note that traditional retention factor – k or k’ - cannot be applied to SEC. Instead, k” is used and it represents the ratio of probabilities of the sample staying in the stagnant mobile phase inside the pores or in the moving bulk mobile phase. In other words, k” refers to solute distribution between the internal pores and the interstitial volume). The equilibrium constant can be defined according to Eq 1.
 Eq. 1
Eq. 1
where ΔS0 is the entropy change during the chemical transition and R is the universal gas constant. When secondary interactions occur, their strength might depend on temperature and therefore temperature can be a useful variable (factor) to affect (improve) recovery and/or peak tailing. In practice, temperature can be an important factor to consider for method optimization, specifically method control and reproducibility.
SEC method development is often time consuming and regularly based on trial-and-error approaches. In this application note, we propose a simple DoE to study the effect of three factors (salt concentration, organic modifier concentration, and mobile phase temperature) and their influence on the quality of an SEC separation. A systematic approach is provided to quickly define optimal working conditions.
Proposed factors (xj) and their levels (+/-)
1) Mobile phase ionic strength, e.g. phosphate buffered saline (PBS): 1x PBS (x1(+1)) and twofold diluted (1/2x) PBS buffer (x1(-1)) - prepared according to a Cold Spring Harbor protocol.7 PBS today is a routinely used buffer for aqueous SEC separations. However, other buffers can also be used, like a commonly applied potassium-phosphate, sodium-phosphate, or ammonium-acetate composition. In which case, the suggested buffer concentration levels for a DoE would be 50 mM (x1(-1) and 150 mM x1(+1)).
With the help of this factor (x1), electrostatic interactions can be explored. Electrostatic secondary interactions tend to show up as decreased HMWs% in lower ionic strength mobile phases. Improvements in HMWs% or higher selectivity between monomer and dimer species at higher ionic strengths are indication of mitigating electrostatic interactions.
2) Concentration of organic modifier (such as MeOH, ACN, EtOH, iPrOH) in the mobile phase, e.g. 2% (x2(-1)) and 10% (x2(+1)).
With the help of this factor (x2), hydrophobic interactions can be explored. Hydrophobic interactions tend to be observed as decreased HMWs%, peak tailing or shifted elution times. If the addition of organic modifier leads to increases in HMWs%, sharpened peaks, or earlier elution times, there is likely to be a hydrophobic secondary interaction occurring under fully aqueous conditions.
3) Mobile phase temperature, e.g. 25 °C (x3(-1)) and 35 °C (x3(+1)), should be kept in a reasonable range to avoid denaturation.
With the help of this factor (x3), conformation and diffusivity of proteins and the solvation of packing material surfaces can be altered. In addition, the strength of unspecific interactions can be decreased to improve separation quality.
Different columns can be compared as well, considering them as categorical (qualitative) factors (xq,j).
Packing material chemistry, hardware type, average pore diameter, and pore-size distribution all impact the quality of SEC separations and the recovery of HMW species. Each of these can be considered as categorical (non-continuous) factors.
Proposed responses (yj) to monitor
In retentive chromatographic modes, it is solute retention that is often optimized. Various commercially available software packages assist retention modeling based on well-established semi-empirical retention models. But, in SEC, solutes are not retained, so modeling of retention and selectivity is not feasible. Instead of retention modeling, it would seem more practical to apply DoEs to explore the most important factor effects.
For SEC – in general – the three most important responses are:
1) Rs between monomer and HMWs (y1),
2) HMWs% (y2),
3) Width of the main peak (monomer) (y3)
Peak symmetry and the time to return to baseline are also often considered as responses. However, in most cases these correlate very well with HMWs% recovery and peak width since each of these responses are measures of nonspecific secondary interactions. If HMWs% values are high and/or peaks are sharp, peak symmetry should also be acceptable. Therefore, as a first step, we suggest studying only the above responses.
Proposed DoE
A 23 full factorial design (linear model) is suggested, but other designs can also be applied, including fractional or Plackett Burman designs or even a Box-Behnken design for a non-linear model. Figure 1 shows a schematic view of the proposed 23 design and the corresponding planning matrix.
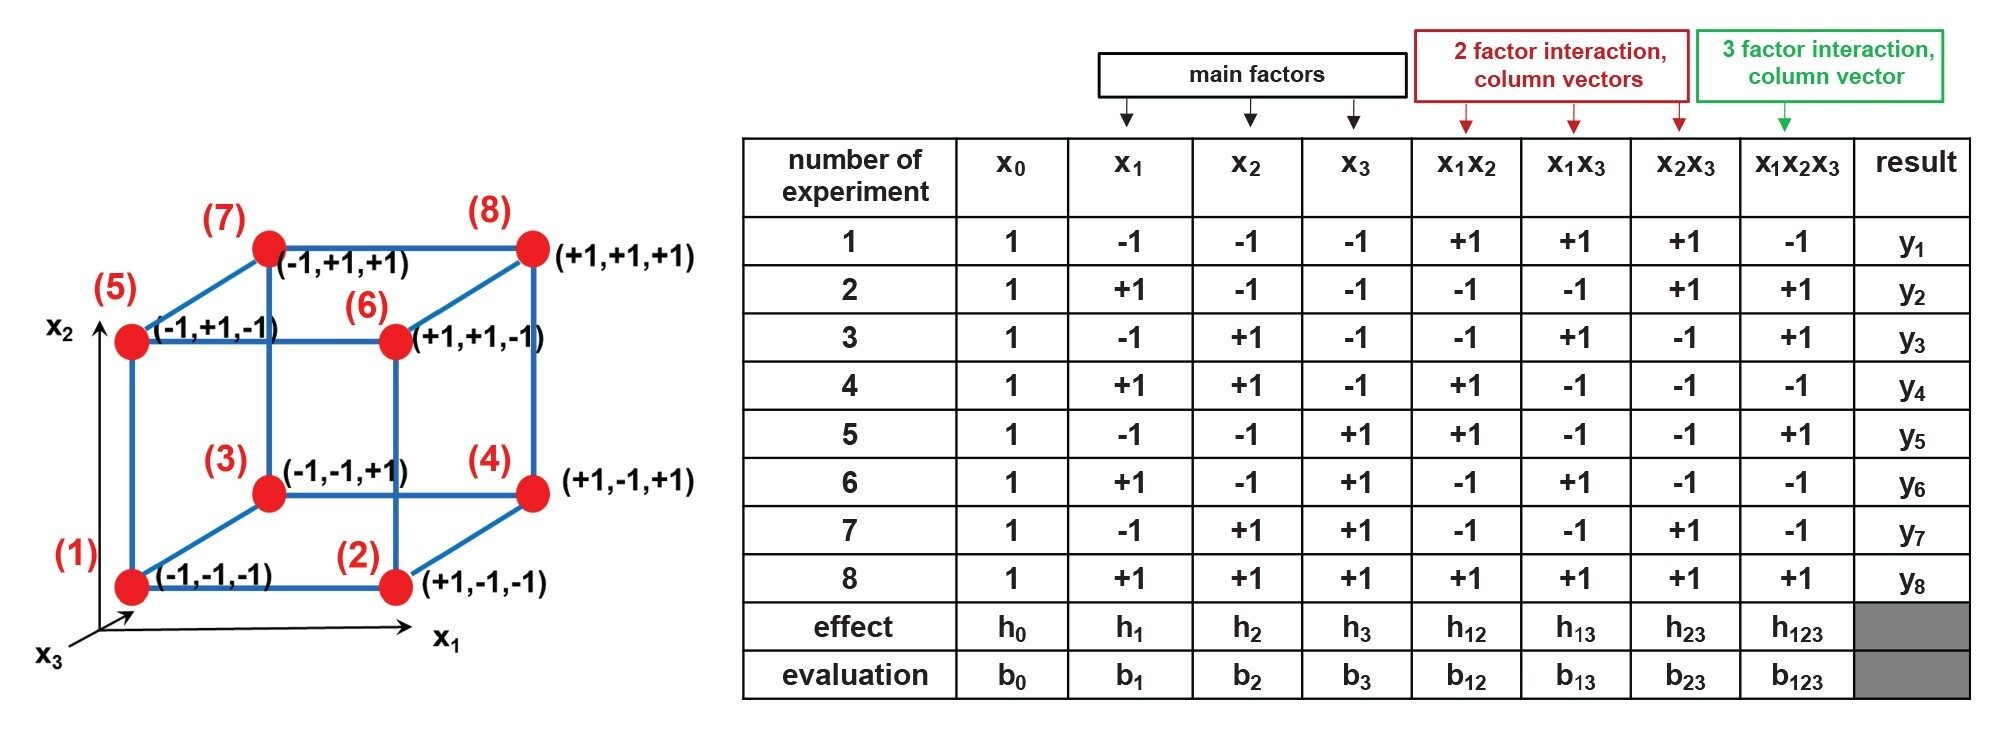 Figure 1. Schematic view of a 23 full factorial design (left) and the related planning matrix (right). x1–x3 are the selected factors, the red points (1–8) – in the vertices of the cube – show the conditions and corresponding factor levels (+1 or -1) of the eight experiments. y1–y8 are the experimentally measured responses and b0–b123 are the calculated model parameters.
Several commercially available software packages can directly calculate the model parameters and factor effects of a DoE. Here, we would encourage users to manually calculate the model and factor effects and that task can be done easily in Microsoft® Excel® or in any other spreadsheet software.
The effect (h) of factor j can be calculated as: Eq (2)
 Eq. 2
Eq. 2
Where is the average of the responses measured at the +1 levels of factor j and is the average of the responses measured at the -1 levels of factor j.
The model parameter (b) of factor j is: Eq (3)
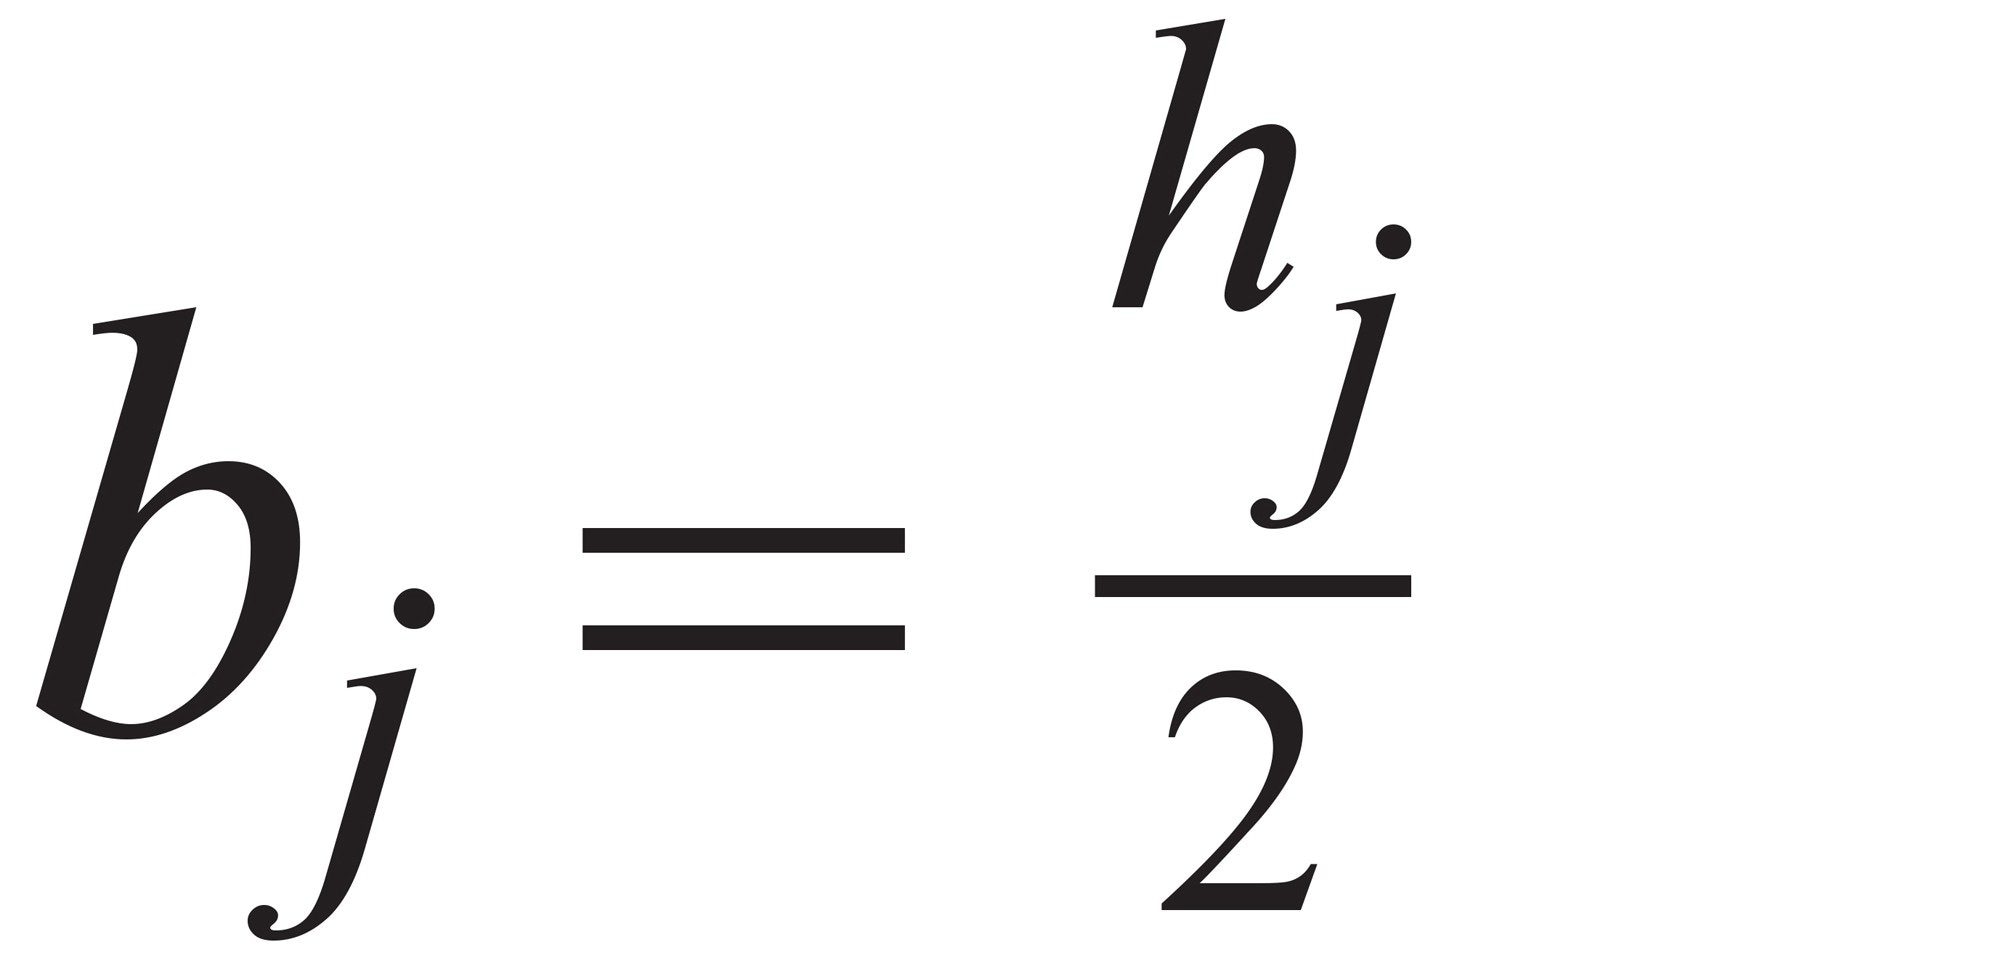 Eq. 3
Eq. 3
While the b0 parameter is the average of all measured responses: Eq (4)
 Eq. 4
Eq. 4
Then the following models can be written to estimate the response of the system at any conditions:
Only main interactions are considered (first order linear model): Eq (5)
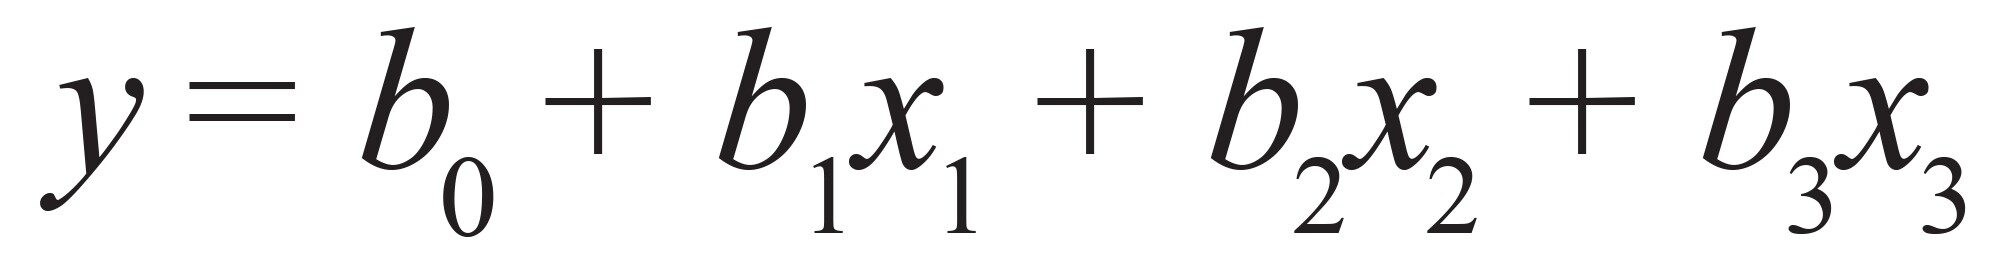 Eq. 5
Eq. 5
If factor interactions are considered (third order linear model): Eq (6)
 Eq. 6
Eq. 6
In the end, factor values can be transformed into factor levels. If zj is the corresponding set value of any xj factor, then Eq (7)
 Eq. 7
Eq. 7
where is the difference of one level of factor j and is the average value of factor j.
Consequently, the level of factor j can be calculated as: Eq (8)
 Eq. 8
Eq. 8
Finally, the effect of the factors can be visualized on Pareto charts and system response can be predicted for any combination of factor levels using Eq. 5 or Eq. 6. Blank Excel spreadsheets can be prepared quickly.
Experimental
Sample and mobile phase preparation:
Rituximab (Rituxan) was purchased from Biogen MA Inc. (Cambridge, MA, USA), Kadcyla (trastuzumab emtansine), and Avastin (bevacizumab) were purchased from Genentech Inc. (San Francisco, CA, USA). Samples were diluted to 1 mg/mL in water and directly injected without further preparation. HPLC grade water and methanol (MeOH) were obtained from Fisher Scientific (Dublin, Ireland). Components of Phosphate Buffered Saline (PBS) (potassium-chloride (KCl), sodium-chloride (NaCl), disodium hydrogen phosphate (Na2HPO4) and potassium dihydrogen phosphate (KH2PO4)) were purchased from Sigma-Aldrich (Buchs, Switzerland).
LC Conditions
|
LC system: |
ACQUITY™ H-Class Bio Plus (quaternary) |
|
Detection: |
UV detection at 280 nm |
|
Vials: |
Polypropylene Vials (p/n : 186002639) |
|
Column: |
XBridge™ Premier Protein SEC Column, 250 Å, 2.5 µm, 4.6 x 150 mm (p/n : 186009959) |
|
Column temperature. (factor 3, x3): |
25 °C (-1 level) and 35 °C (+1 level) |
|
Sample temperature: |
8 °C |
|
Injection volume: |
1.0 µL (sample) |
|
Flow rate: |
0.3 mL/min (analysis time set to 8 min) |
|
Mobile phase: |
pH 7.4 (1x PBS and 1/2x PBS) prepared according to a Cold Spring Harbor protocol [7] including 2% or 10% MeOH. |
|
(factor 1 (x1) and factor 2 (x2)): |
Levels of x1 factor: 1/2x strength PBS (dilution factor 2; -1 level), 1x standard recipe PBS (dilution factor 1; +1 level) Levels of x2 factor: 2% MeOH (-1 level), 10% MeOH (+1 level) |
The experimental conditions are shown in Figure 2 as a 23 factorial DoE.
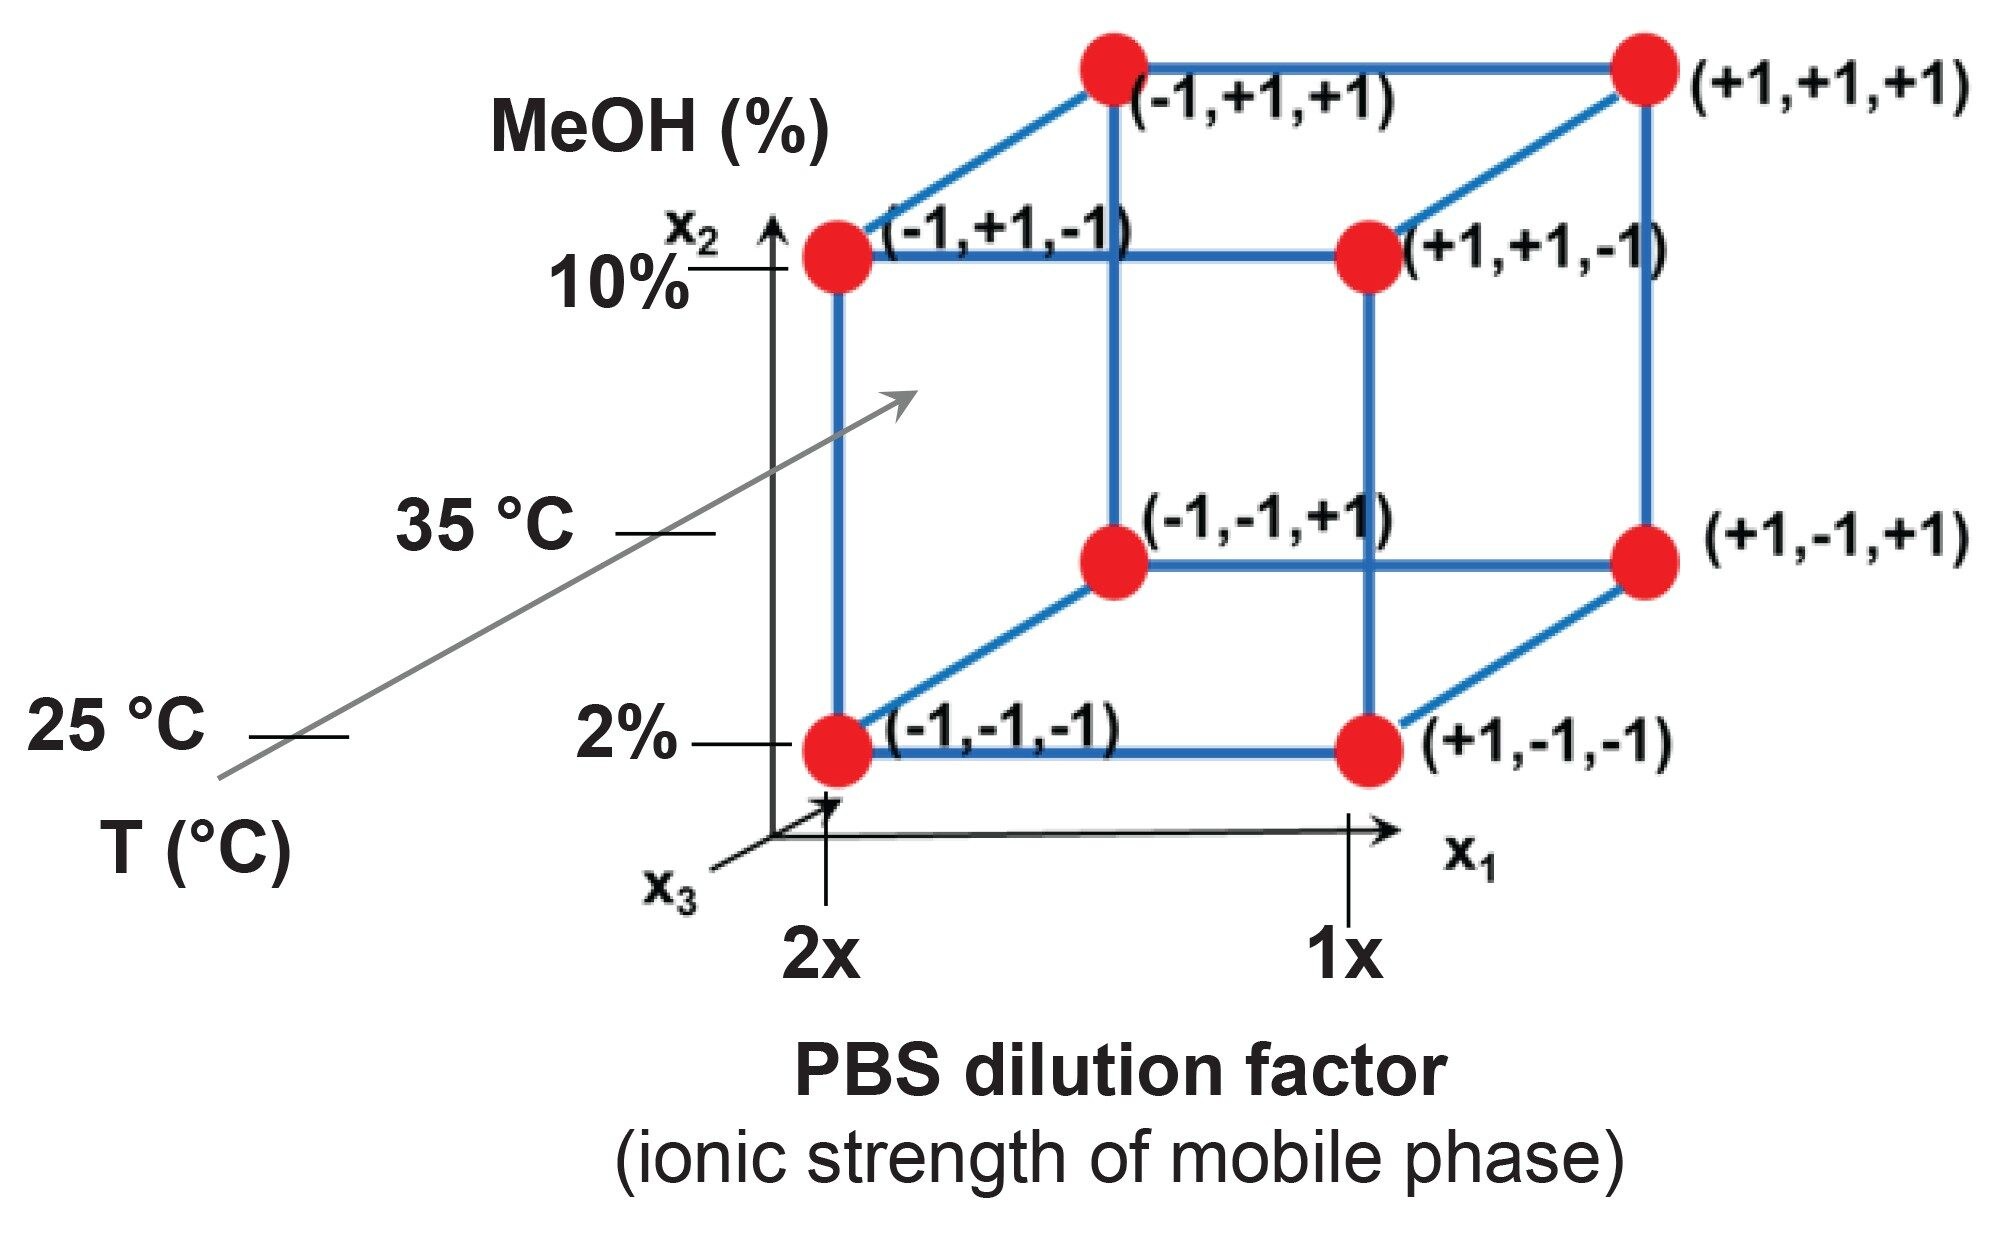 Figure 2. The eight experimental conditions set for the DoE to estimate the effect of mobile phase ionic strength (x1 factor, dilution factor of PBS buffer), mobile phase MeOH % (x2 factor) and mobile phase temperature (x3 factor).
Results and Discussion
Eight experiments were performed, and the following responses have been registered (for rituximab):
- Rs between monomer and HMWs (y1),
- HMWs% (y2),
- Width of the main peak (monomer) (y3)
The planning matrixes were filled for all three responses and factor effects were estimated. Figure 3 shows the matrix for y2 response (HMWs%) as a representative example.
 Figure 3. The DoE matrix for y2 response (observed HMWs%).
The factor effects and model parameters have been determined from the matrixes. As an example, for the y2 factor, the following models were obtained based on Eq. 5 and Eq 6:
If only the main interactions are considered (Eq. 5): Eq (9)
 Eq. 9
Eq. 9
If factor interactions are considered (Eq. 6): Eq (10)
 Eq. 10
With these model equations, the responses can be estimated for any combination of the method factors (within an acceptable range). For instance, the expected value of y2 factor (HMWs%) in the center point of the DoE (x1=0 [z1=1.5x PBS], x2=0 [z2=6% MeOH], and x3=0 [z3=30°C]) is predicted to be y2pred = 0.546% HMWs. Experimental verification has been performed and y2exp = 0.550% HMWs was obtained which corresponds to a -0.7% error of HMWs % prediction. (Conversion between factor levels and values can be achieved through Eq. 7 and 8.) Such a small deviation on the prediction of HMWs% indicates the appropriateness of the linear model.
It is very useful to plot the factor effects as Pareto charts. Figure 4 shows the obtained Pareto chart for y2 response. As can be seen, x1 factor (PBS concentration of the mobile phase) has the largest effect on observed HMWs%, suggesting the presence of some secondary electrostatic interactions between the HMWs species and the stationary phase (or column hardware). The MeOH% of mobile phase has minor impact on HMWs%, while the effect of temperature and factor interactions are negligible.
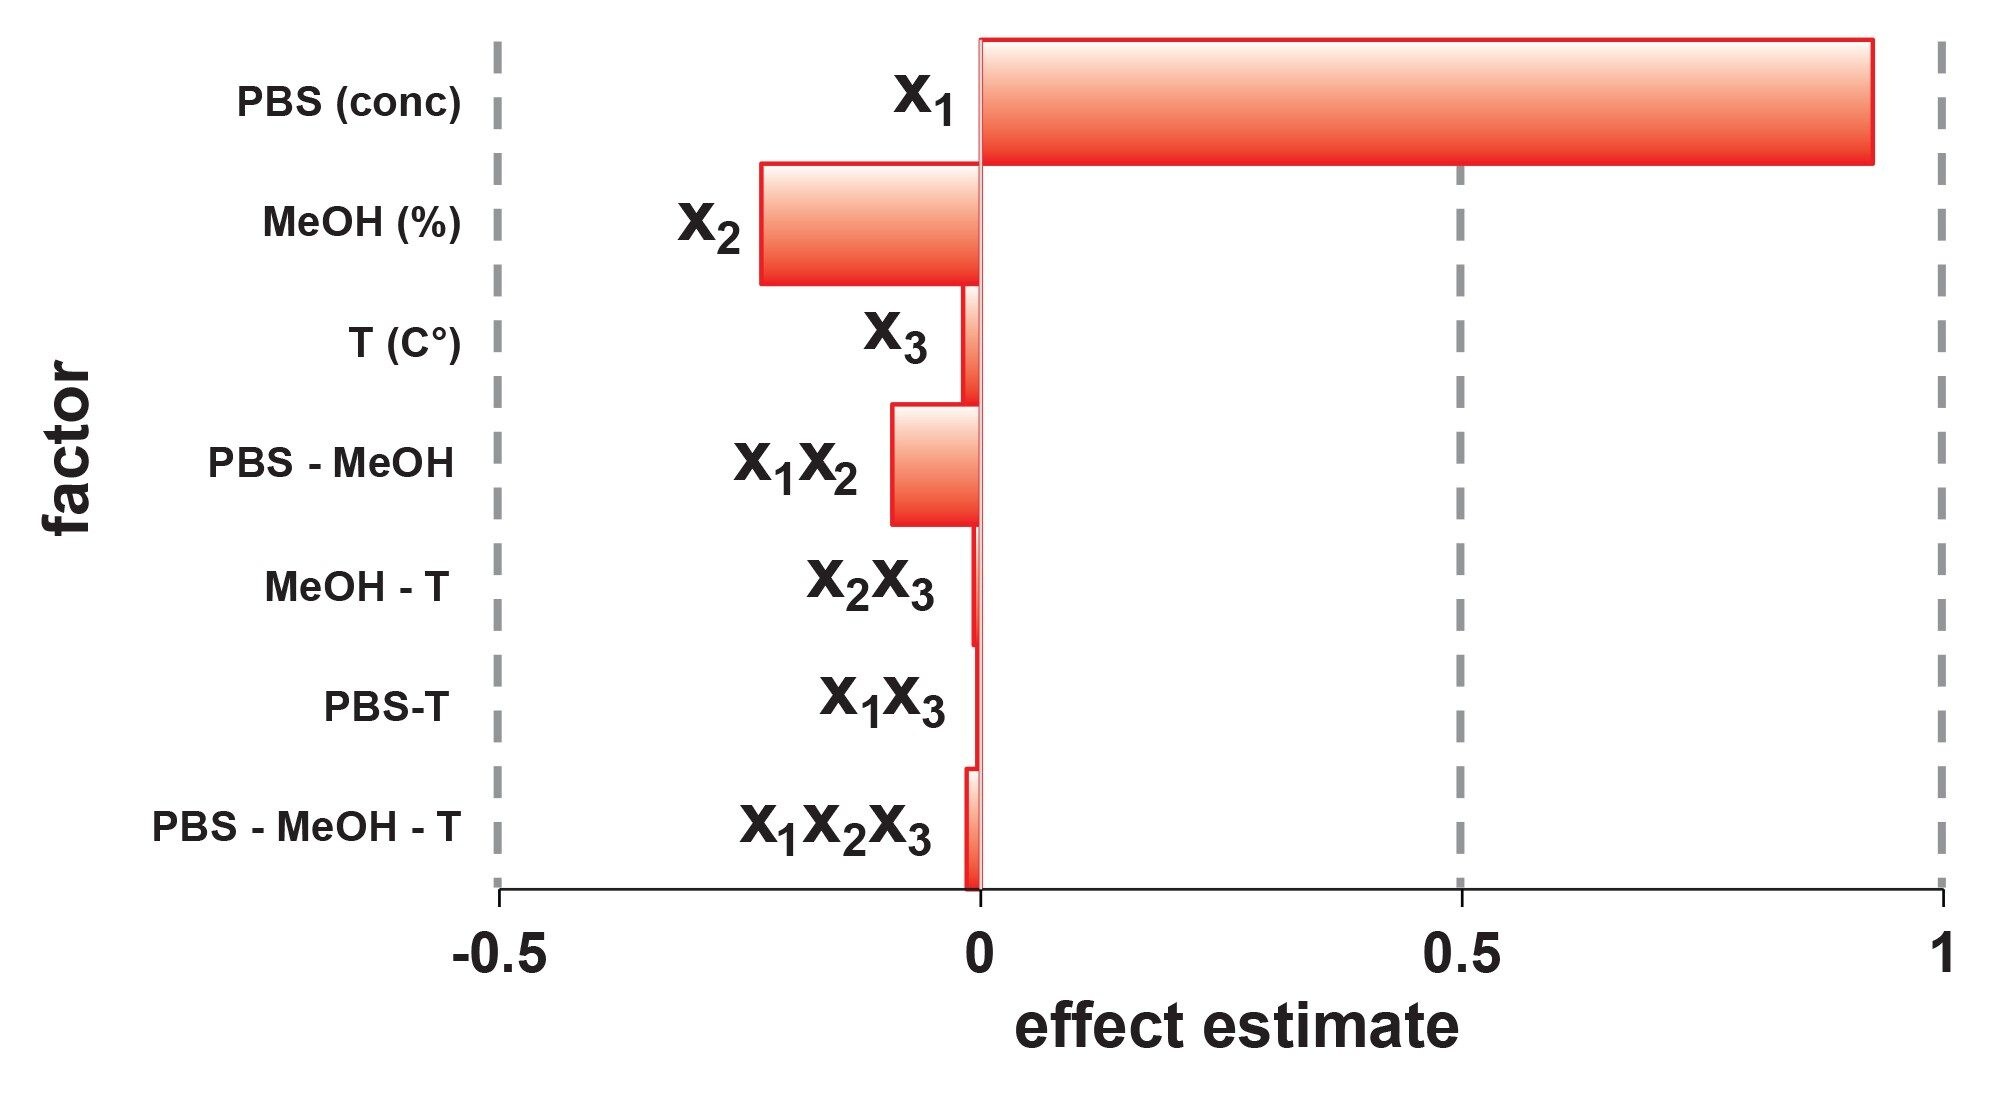
The same approach was used for y1 (Rs) and y3 (peak width) responses. Both responses were most affected by x1 factor (PBS concentration of the mobile phase) while y3 was also significantly impacted by mobile phase temperature. In the end, 1xPBS buffer, 0% MeOH and 35 °C were set for this SEC separation to obtain the highest recovery and sharpest peaks.
Figure 5 A shows the chromatogram obtained at the conditions corresponding to the selected working point (optimum) while Ffigure 5 B shows the worst-case condition (lowest HMWs% recovery and least symmetrical main peak).
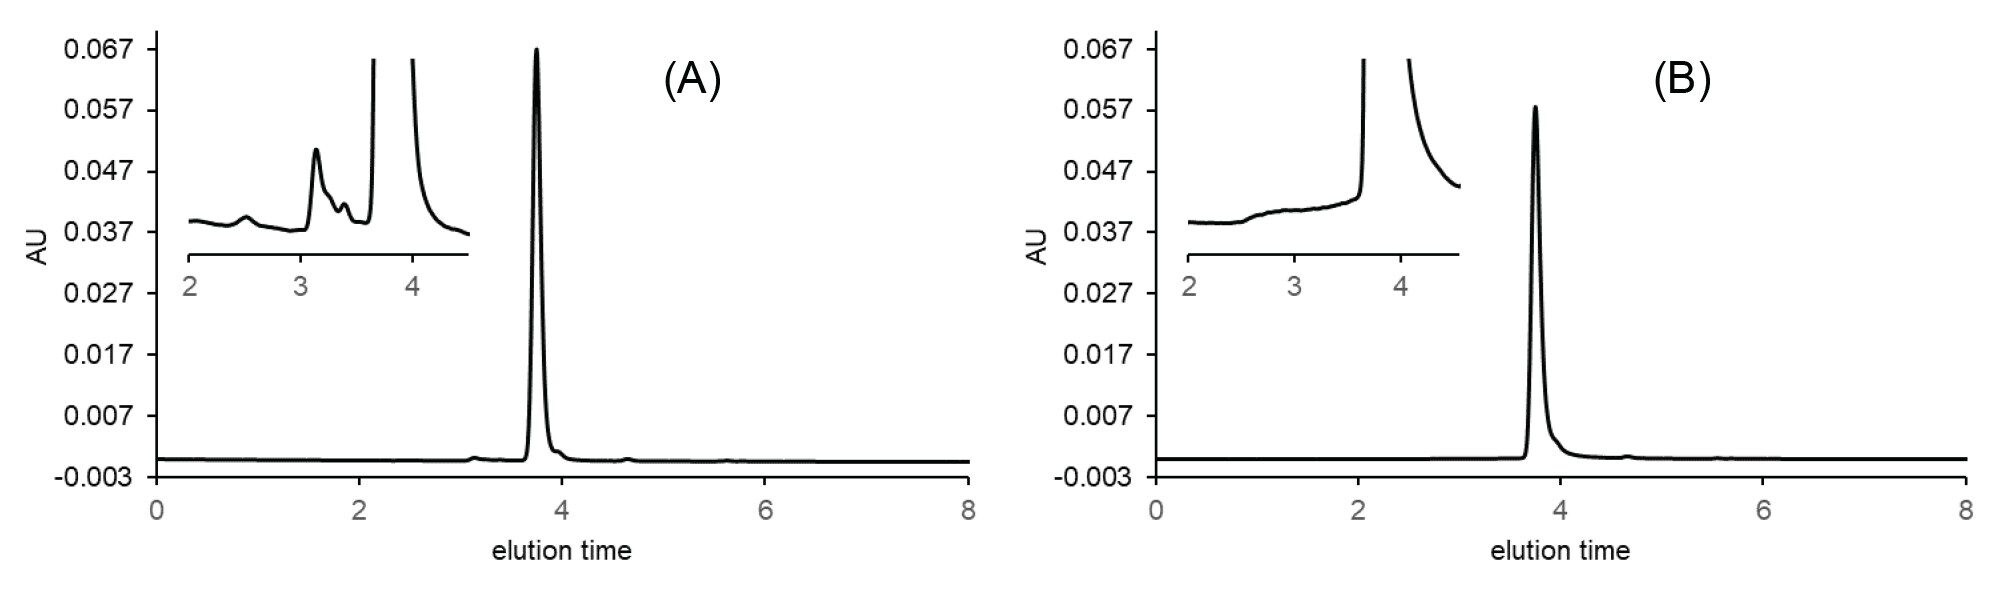 Figure 5. Experimentally measured SEC chromatograms of rituximab sample: optimal condition (A) and worst condition (B) as obtained with a XBridge Premier Protein SEC 250 Å 2.5 µm 4.6 x 150 mm Column.
After finding the optimal working point, flow rate can be adjusted in pursuit of a faster analysis time. On a 4.6 mm i.d. SEC Column, a 0.3 mL/min flow rate is a good compromise between analysis time and efficiency, thus explaining its use for the initial DoE experiments. Nevertheless, if resolution between the peaks of interest and sensitivity are high enough, faster flow rates can be considered. Flow rate only impacts the kinetic performance of an SEC separation and the sensitivity of optical peak detection. Due to the nature of SEC, lower efficiency is expected at higher flow rates. On the contrary, if during the initial DoE experiments, the resolution has not reached an acceptable value, then flow rate can be decreased to improve the resolution. Figure 6 shows the acceleration of a rituximab SEC separation using a flow rate of 0.7 mL/min. The resolution between the HMWs species and main peak (monomer) is still acceptable and the observed amount of HMWs% was unchanged compared to the result from a 0.3 mL/min flow rate.
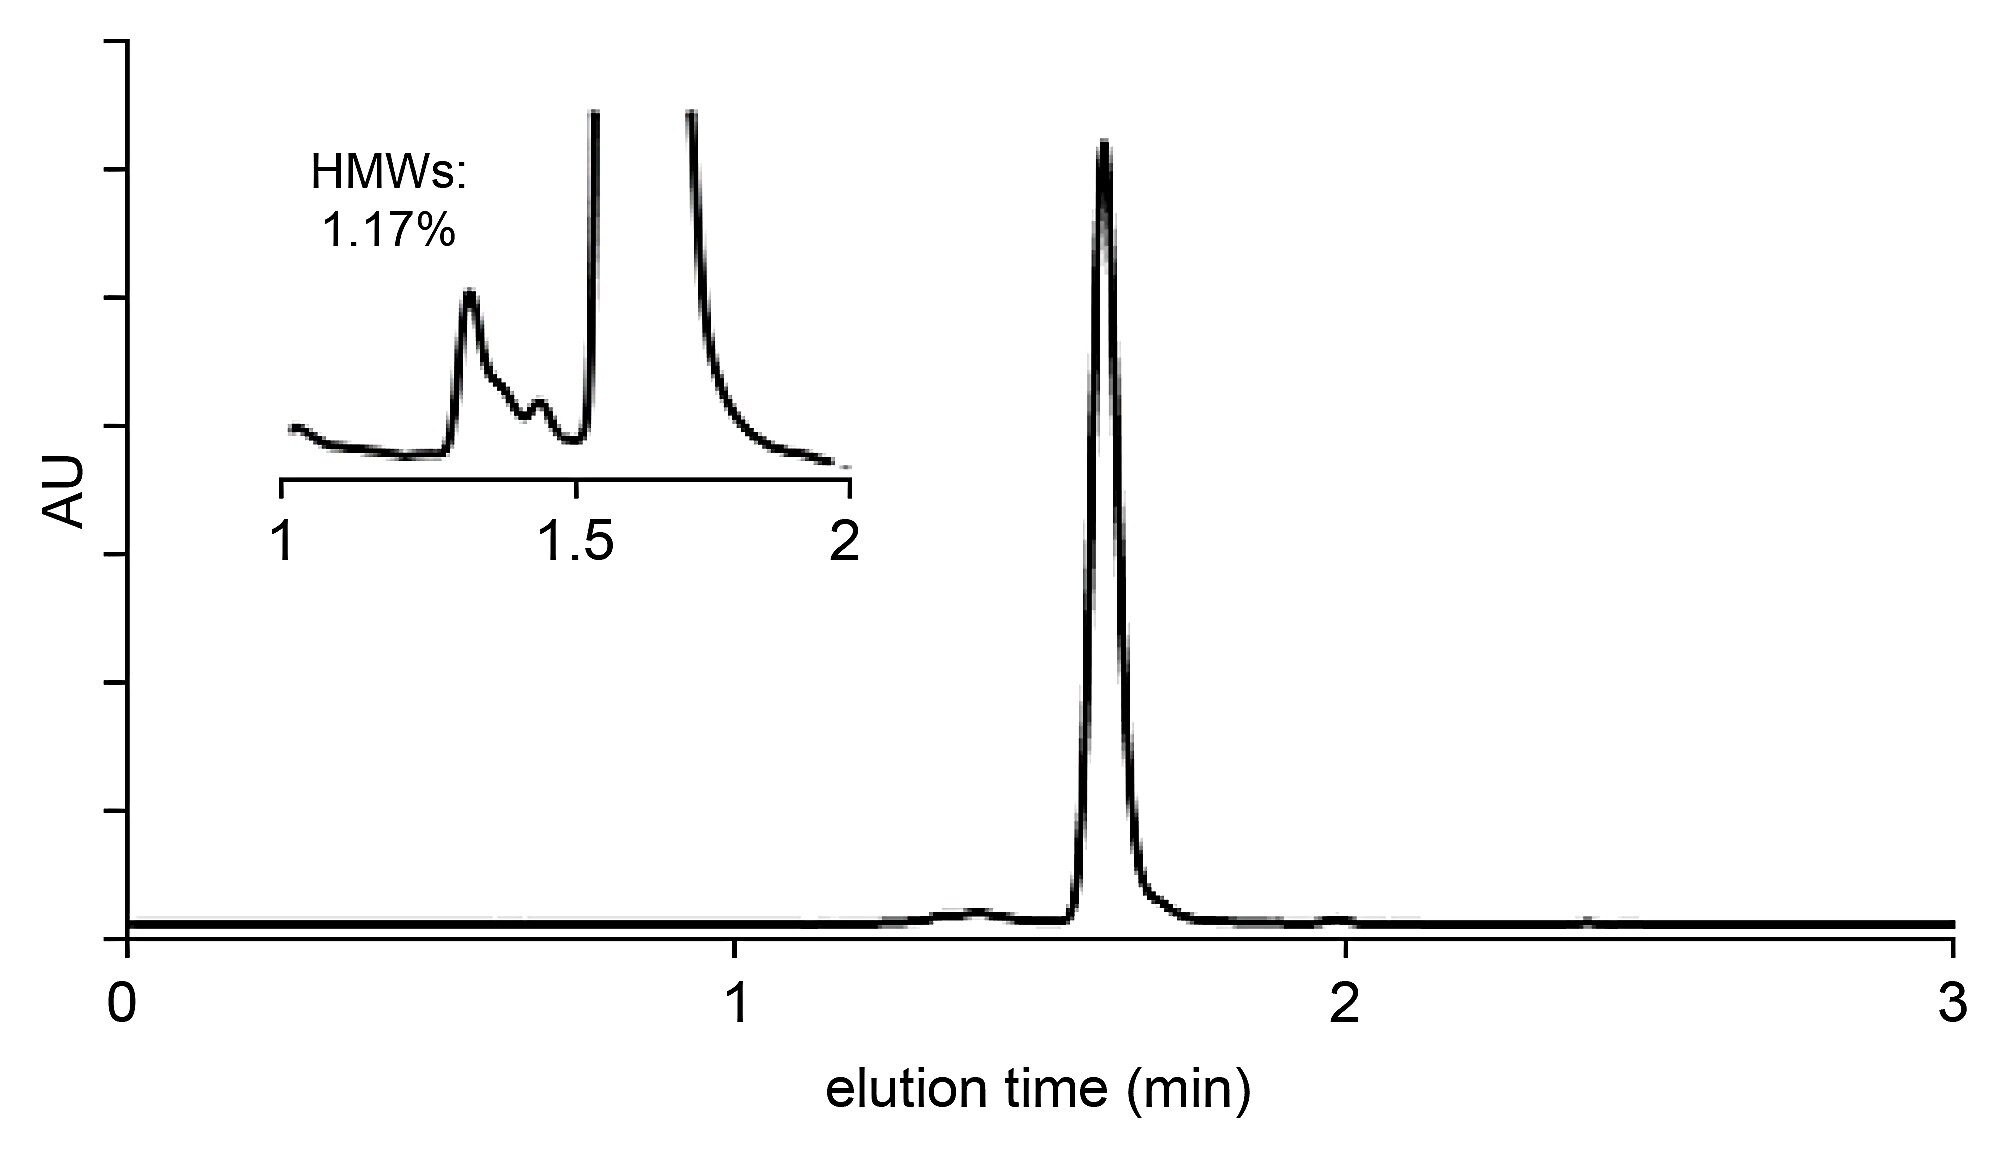 Figure 6. Example of a fast SEC separation (rituximab) as performed on an XBridge Premier Protein SEC 250 Å 2.5 µm 4.6 x 150 mm column. Mobile phase: 1x PBS, pH 7.4, flow rate F = 0.7 mL/min, temperature T = 35 °C, injected volume 1 μL, detection: 280 nm (UV).
The same DoE optimization was applied for the antibody-drug-conjugate trastuzumab emtansine and for the mAb bevacizumab. After finding the working point, the flow rate was increased to 0.7 mL/min. The final chromatograms are shown on Figure 7.
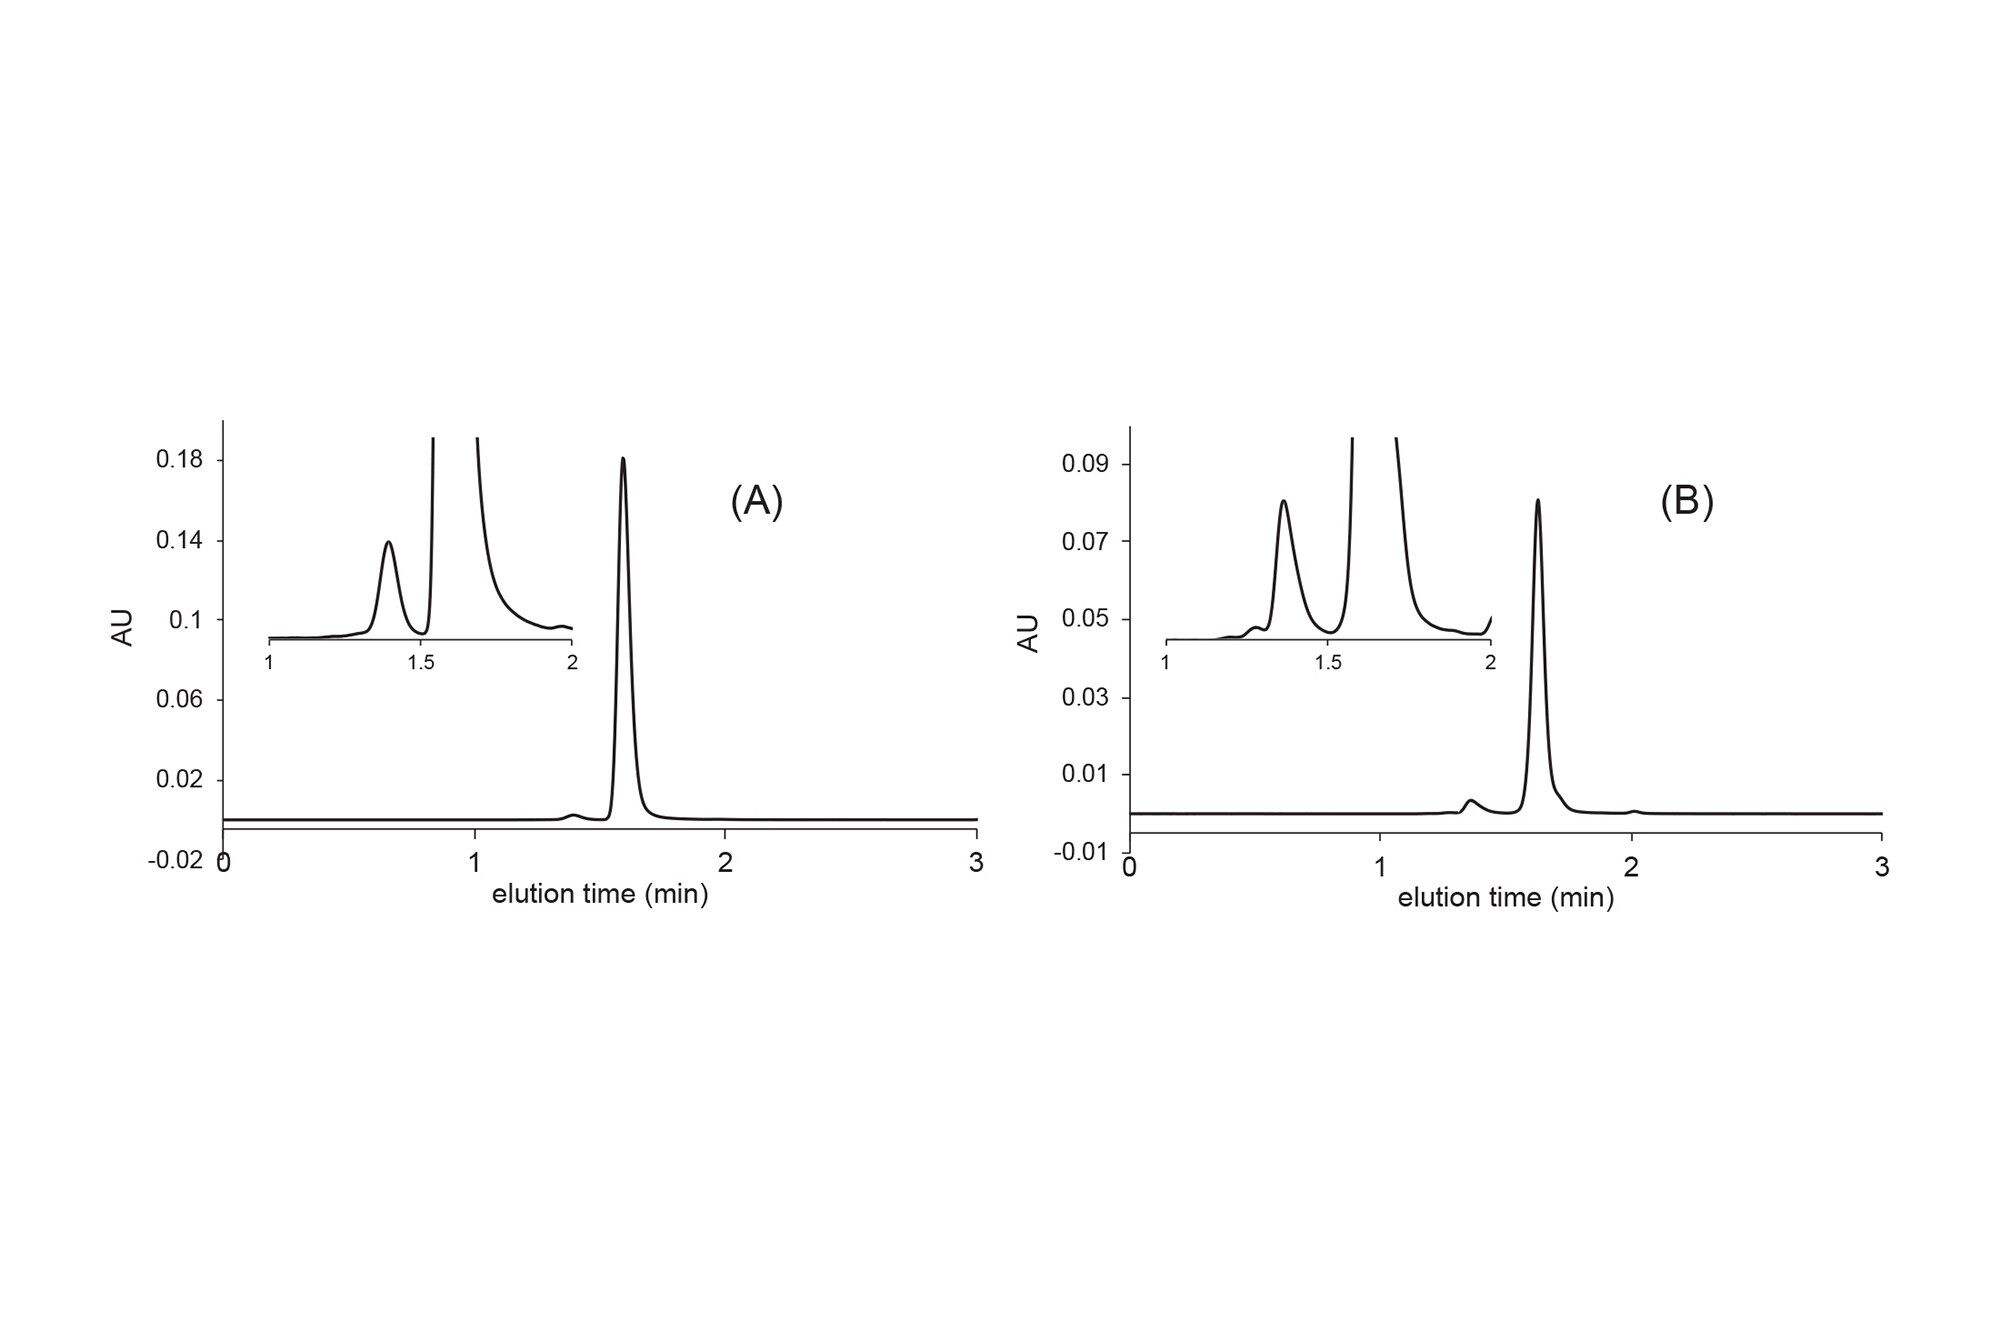 Figure 7. Fast SEC analysis of trastuzumab emtansine (A) and bevacizumab (B) as performed on an XBridge Premier Protein SEC 250 Å 2.5 µm 4.6 x 150 mm column. Mobile phase: 1x PBS, pH 7.4, flow rate F = 0.7 mL/min, temperature T = 25 °C, injected volume 1 μL, detection: 280 nm (UV).
Conclusion
A systematic and fast method development approach is proposed to optimize SEC separations of therapeutic proteins. In SEC, there is meant to be no analyte retention so common retention modeling approaches do not apply. Instead of the often-used semi-empirical retention models, we have proposed a 23 full factorial DoE approach to study the effects of the most relevant factors for the separation, such as mobile phase ionic strength (x1), mobile phase organic modifier concentration (x2) and mobile phase/column temperature (x3). Responses were carefully selected, and it was proposed that the most meaningful ones are Rs between monomer and HMWs (y1), observed HMWs% (y2) and the width of the main peak (monomer) (y3). By studying the mentioned factors and responses, both electrostatic and hydrophobic secondary interactions can be explored, understood, and ultimately mitigated.
In the end, by simple linear models, the responses can be predicted for any combination of factor levels and the optimal working point can be identified.
By applying a low adsorption column technology in a 4.6 x 150 mm configuration and packed with 2.5 µm particles, this rapid method development procedure can be completed within a few hours. In addition, using the equations described in this application note, and the publicly available spreadsheet template, users can easily recreate and design their own DoE based method development strategies. The spreadsheet template can be downloaded from here.
References
- P. Hong, S. Koza, E.S.P. Bouvier, A Review, Size Exclusion Chromatography for the Analysis of Protein Biotherapeutics and Their Aggregates, J. Liq. Chromatogr. Relat. Technol. 35 (2012) 2923–2950. https://doi.org/10.1080/10826076.2012.743724.
- S. Fekete, L. Kizekai, Y.T. Sarisozen, N. Lawrence, S. Shiner, M. Lauber, Investigating the Secondary Interactions of Packing Materials for Size-Exclusion Chromatography of Therapeutic Proteins, J. Chromatogr. A, 1676 (2022) 463262. https://doi.org/10.1016/j.chroma.2022.463262.
- S. Fekete, A. Beck, J.L. Veuthey, D. Guillarme, Theory and Practice of Size Exclusion Chromatography for the Analysis of Protein Aggregates, J. Pharm. Biomed. Anal. 101 (2014) 161–173. http://dx.doi.org/10.1016/j.jpba.2014.04.011.
- R.D. Ricker, L.A. Sandoval, Fast, Reproducible Size-Exclusion Chromatography of Biological Macromolecules, J. Chromatogr. A 743 (1996) 43–50. https://doi.org/10.1016/0021-9673(96)00283-X.
- M. Kamberi, P. Chung, R. DeVas, L. Li, Z. Li, X. Ma, S. Fields, C.M. Riley, Analysis of Non-covalent Aggregation of Synthetic hPTH (1–34) By Size-Exclusion Chromatography and the Importance of Suppression of Non-specific Interactions for a Precise Quantitation, J. Chromatogr. B 810 (2004) 151–155. https://doi.org/10.1016/j.jchromb.2004.07.026.
- A.M. Striegel, W.W. Yau, J.J. Kirkland, D.D. Bly, Modern Size Exclusion Liquid Chromatography, John Wiley and Sons Inc., Hoboken, New Jersey, 2009.
- Cold Spring Harbour Laboratory Press (2006), Phosphate Buffered Saline (PBS), Recipe, https://doi.org/10.1101/pdb.rec8247.
Featured Products
720007790, November 2022