• Note d'application

Quantification of Homopolymer in a Copolymer Product: Comparison of HPLC With ELSD and UV Detection

Quantification of Homopolymer in a Copolymer Product: Comparison of HPLC With ELSD and UV Detection

  • Jinchuan Yang
  • Alice J. Di Gioia
  • Waters Corporation

Abstract

This application note illustrates the HPLC separation of PS in styrene- co-isobutylene, and the quantification of PS in the copolymer products. UV and ELS detectors are used and the data from both detectors are compared.

Introduction

During the synthesis of copolymers, homopolymers are often formed as by-products. These are considered impurities in the copolymers because of the significantly different chemical and physical properties. It is necessary to monitor the homopolymer content to ensure that the requisite properties of the copolymer product are retained. Copolymers of styrene and isobutylene are used as coating materials for certain medical devices including drug eluting stents.1,2 In this example, the presence of polystyrene (PS) in styrene/isobutylene copolymer must be monitored. 

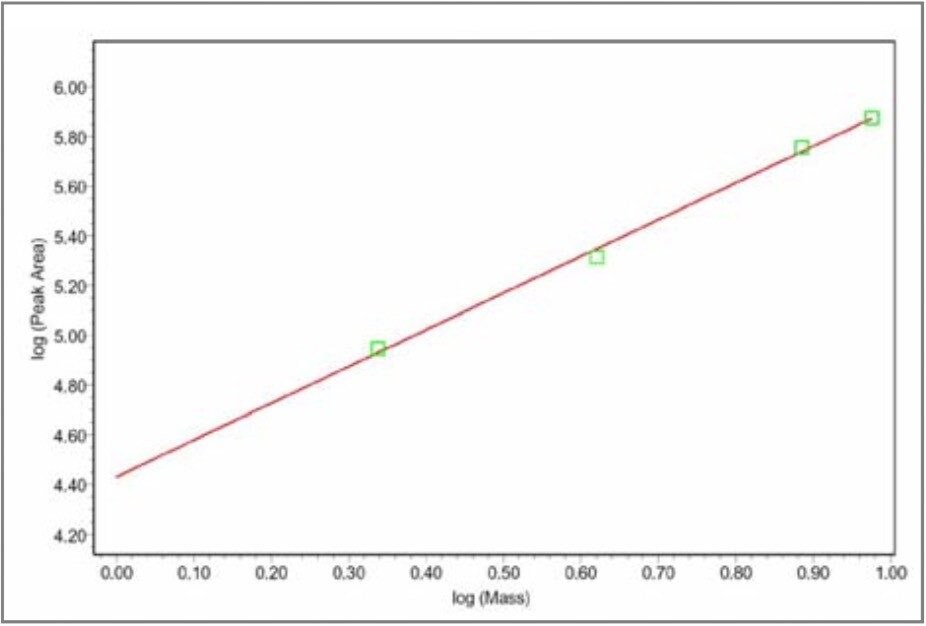
Gradient elution chromatography with a reverse-phase column is useful in measuring PS content in styrene-coisobutylene as dissimilar polymer chemical compositions allow for the separation of homopolymer from copolymer. PS has a strong UV absorption at approximately 260 nm so that a UV detector can be used. An evaporative light scattering detector (ELSD) is also suitable and has the advantage of showing minimum baseline variation with mobile phase composition change as in gradient elution, compared with UV detection. However, the ELS response does not change linearly with sample concentration or mass load, making it important to establish a calibration curve to thoroughly characterize the relationship of the ELSD response to sample quantity.

This application note illustrates the HPLC separation of PS in styrene- co-isobutylene, and the quantification of PS in the copolymer products. UV and ELS detectors are used and the data from both detectors are compared.

Experimental

Method Conditions

System:

Alliance HPLC System 2695XE, 2420 ELS Detector, 2996 PDA

Software:

Empower Software

Column:

Nova-Pak 4 μm, C18 3.9 mm x 150 mm, 60 Å

Column temp.:

30 °C

Injection volume:

5 μL

ELSD settings:

Drift tube temperature 50 °C, Nitrogen supply 60 psi, Nebulizer heating level 80%, ELSD gain = 1

Sample prep:

Copolymers A, B and C were dissolved in THF at a nominal concentration of 10 mg/mL. PS standards concentrations ranged from 0.4 to 1.9 mg/mL

HPLC Measurements: Samples and standards were run using the conditions in Table 1. With these measurement conditions, it was necessary to inject a THF blank after each sample injection to remove residual sample from the column.

Table 1. Gradient elution program for HPLC analyses.

Results and Discussion

To quantify PS, a good separation of homopolymer and copolymer is needed. Three copolymer samples were analyzed with gradient elution using a Nova-Pak Column. The ELS chromatograms showing a separation of homopolymer from copolymer are in Figure 1. The peaks at approximately 16 minutes are the PS homopolymers; the peaks starting at approximately 19 minutes are the copolymers.

Figure 1. ELS Chromatograms of copolymer products A, B, and C. 

PS standards at various concentrations were chromatographed to generate calibration points for both ELS and UV detection. Figure 2 is an overlay of the ELS chromatograms of the PS standards. To obtain the calibration curve with highest square of correlation coefficient (R2), three types of curve fits were performed for the ELS data. The first is log-log or power law fit, the second is a linear or 1st order polynomial fit, and the third is a quadratic or 2nd order polynomial fit.

Figure 2. Overlay of ELS Chromatograms for PS homopolymer standards at various concentrations. 

The R2 value for the log-log fit and the quadratic fit are 0.9969 and 0.9972, respectively, while the R2 value for the linear fit is 0.9914. These values indicate that logarithmic and quadratic curve fits are better than the linear curve fit. The calibration curves using the quadratic fit and logarithmic fit are in Figures 3 and 4.

Figure 3. Calibration curve (Quadratic fit) for ELS detector response to PS content. Equation Y = 4.06 x 103 X2 + 4.57 x 10⁴ X – 3.82 x 10⁴; R2 = 0.9972, where Y is peak area, X is mass in μg. 
Figure 4. Calibration curve (log-log fit) for ELS detector response to PS content. Equation: Log(Y) = 4.4307 + 1.4785 log(X); R2 = 0.9969, where Y is peak area, X is PS mass in μg. 

The UV chromatograms at 260 nm are in Figure 5. In addition to the PS (16 minutes) and copolymer (19 minutes) peaks, the tiny peaks before 5 minutes are most likely solvent impurities. The baseline in the UV chromatogram shifts due to the changing absorption with the change in the mobile phase composition during the gradient. Figure 6 shows the linear calibration curve from these chromatograms.

Figure 5. UV detection: Chromatogram overlay of copolymer products A, B, and C with PS calibrants; chromatogram extracted at 260 nm. 
Figure 6. Calibration curves for UV (260 nm) detection (peak area) response to PS content (mass). Equation: Y = 3.808 x 10⁵ X + 7.97 x 10⁴; R2 = 0.9998, where Y is peak area, X is PS mass in μg. 

Using the calibration curves from both ELS and UV detectors, the PS content in each copolymer sample A, B, and C was calculated and expressed as weight percentage of PS in the total sample weight. The total sample weight is calculated from the sample concentration and injection volume. For the ELS results, only the log-log and quadratic curves were used in the calculations. Since the UV detector shows excellent linearity in its calibration, and is well established (Beer’s Law), the UV results for the PS content are treated as the “true” values. ELS results from both types of calibration curves (logarithmic and quadratic) are compared with the UV results. Table 2 shows the results for both detectors. The ELS calibration curves yield results that are very similar to the UV data; an exception is the quadratic calibration curve that has a large error for sample A (13.4% deviation). Overall, the logarithmic calibration curve yields better results than the quadratic calibration curve.

Table 2. Quantitation results for copolymer samples and comparison of results from different calibration curves.

Three injections of THF blank samples were made to establish system noise and the peak areas were determined in the same manner as PS. The limit of detection was calculated using 3 to 1 signal to noise ratio. The limit of detection is 0.450 μg for ELS (logarithmic calibration curve) and 0.204 μg for UV, respectively.

Polymer molecular weight can affect ELS response and, consequently, the calibration curve, particularly when the sample is in the low molecular weight range. An ideal calibration should use standards with the same molecular weight distribution as in the copolymer samples. In this study, a narrow molecular weight distribution PS standard (molecular weight of 102,000 Dalton) was used as the PS calibrant. For this study, the assumption was made that the molecular weights of the homopolymer in copolymer samples and PS standards are close enough to ignore the effect of molecular weight on ELS response. However, for extensive quantification work, a more detailed investigation of the molecular weight effect on the ELS response is recommended.

Conclusion

PS homopolymer can be easily separated from styrene isobutylene copolymer by gradient elution chromatography on a reverse-phase column. Both ELS and UV chromatograms were used to quantify and compare the PS homopolymer content in copolymer products. The ELSD results were better fit by either a quadratic or a logarithmic curve than a linear curve fit. However, the logarithmic calibration curve provided the most accurate results compared with the results from UV data. UV detection gives excellent linear response to PS standards with a detection limit lower than that from ELS detection. However, the baseline in a UV chromatogram is susceptible to the mobile phase chemical composition when the mobile phase contains UV chromophores. That is to say, a gradient elution program typically upsets the baseline. This can be a concern when non-linear gradient mobile phase elution is needed for a separation with quantification of components.

References

  1. Jian-Zhong Chen, Shrirang V. Ranade, Xiang- Qun Xie. NMR Characterization of Paclitaxel/Poly (styrene-isobutylene-styrene) Formulations. International Journal of Pharmaceutics, Volume 305, Issues 1–2, 23 November 2005, Pages 129–144.
  2. Chemical and Engineering News, April 18, 2005, Vol. 83, Number 16, pp. 45–47, “Polymer Exploited for Drug Delivery.”

720001560, March 2006

Haut de la page Haut de la page