• Note d'application

Impurity Evaluation of Heparin Sodium by Anion Exchange Chromatography

Impurity Evaluation of Heparin Sodium by Anion Exchange Chromatography

  • Catalin E. Doneanu
  • Weibin Chen
  • John C. Gebler
  • Waters Corporation

Abstract

The combination of the Alliance Bioseparation module with the Spherisorb SAX Column is an ideal system for the separation and quantification of heparin and OSCS. It enables rapid, sensitive, and high-resolution separations, and generates data for the evaluation and determination of heparin purity. The wide linear dynamic range in conjunction with the superior separation of the system makes it well suited for quantitative impurity analysis. OSCS at 1% of heparin concentration is readily detected by the system. The result demonstrates that the system is well poised to be applied to determine whether OSCS exists as an adulterant to the heparin API.

Introduction

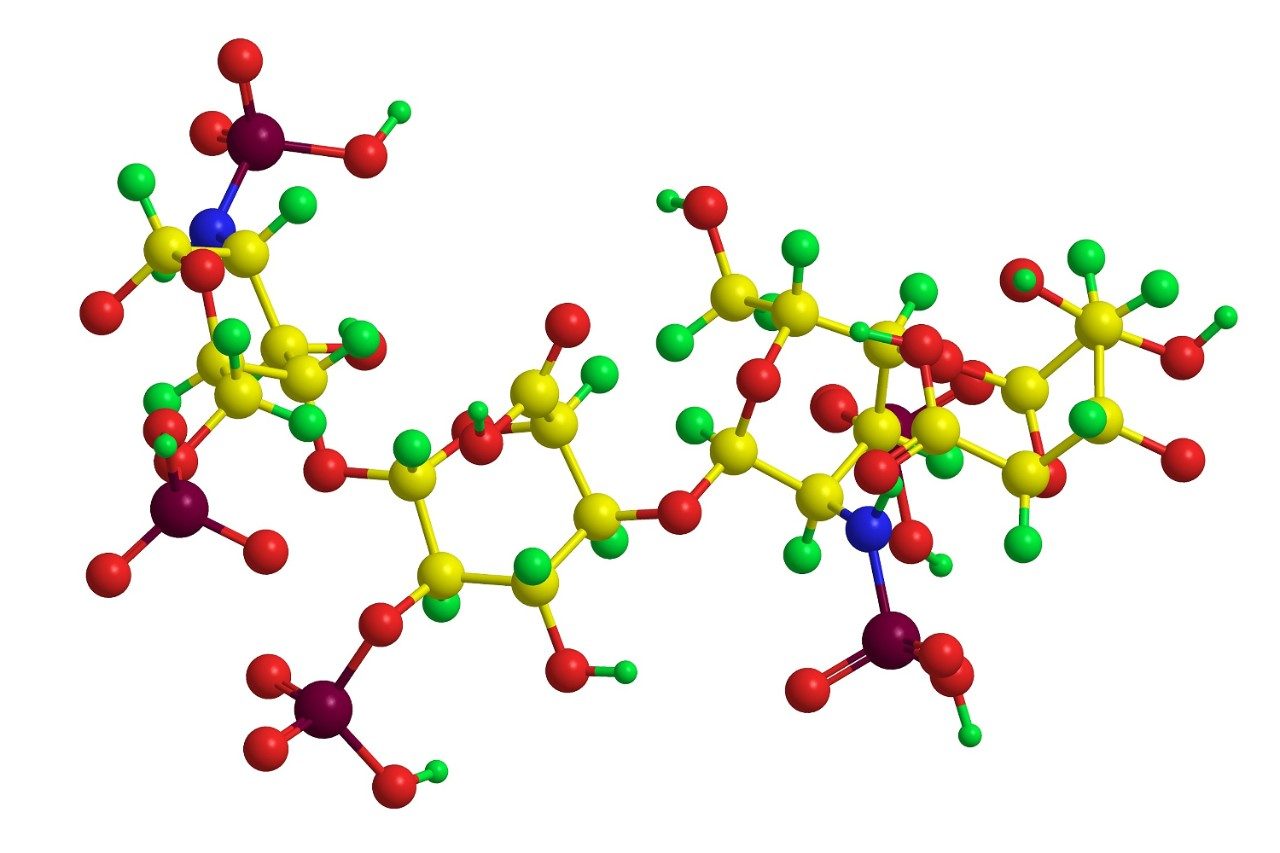
Heparin is a blood thinning drug that is primarily used to prevent the development of blood clots. Heparin and its derivative, low-molecular-weight heparin (LMWH), have been widely used as anticoagulant drugs for decades during surgery and kidney dialysis. Heparin belongs to the group of linear polysaccharides called gly-cosaminoglycan (GAG), and consists of alternating glucosamine and hexuronic acid residues. Heparin has tremendous heterogeneity, due to N-acetylation, various sulphation patterns and chain lengths,  making analytical characterizations extremely challenging.

Raw heparin material is extracted from mammalian tissues, such as pig intestines. The heparin material requires many treatment and purifica-tion steps before it can be used in a drug formula. Stringent quality control in the purification steps is essential to ensure the quality of heparin as a final active pharmaceutical ingredient (API) of the drug.

Recent incidents, including severe allergic reactions and several deaths have been attributed to heparin adulteration, resulting in a massive recall of heparin drugs by the manufacturer.1 Oversulfated chondroitin sulfate (OSCS) is a contaminant in heparin associated with the adverse clinical events.2 

Because heparin is a drug commonly used in clinics, these adverse events have created a worldwide crisis and a call for an analytical method that can readily monitor the purity of heparin API before formulation of the drug.

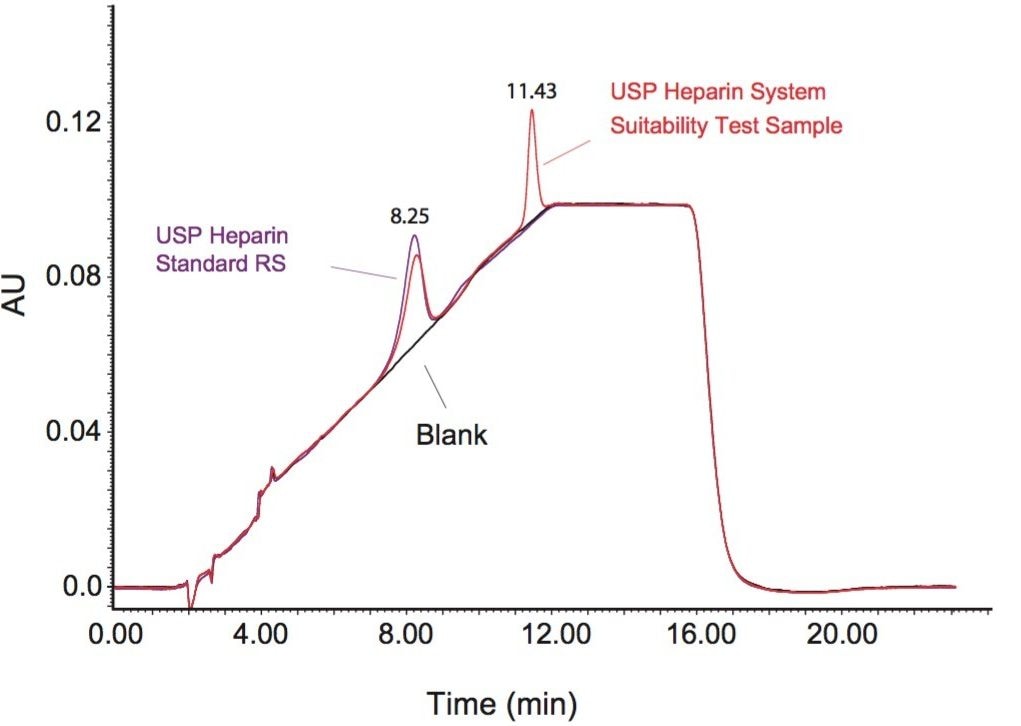
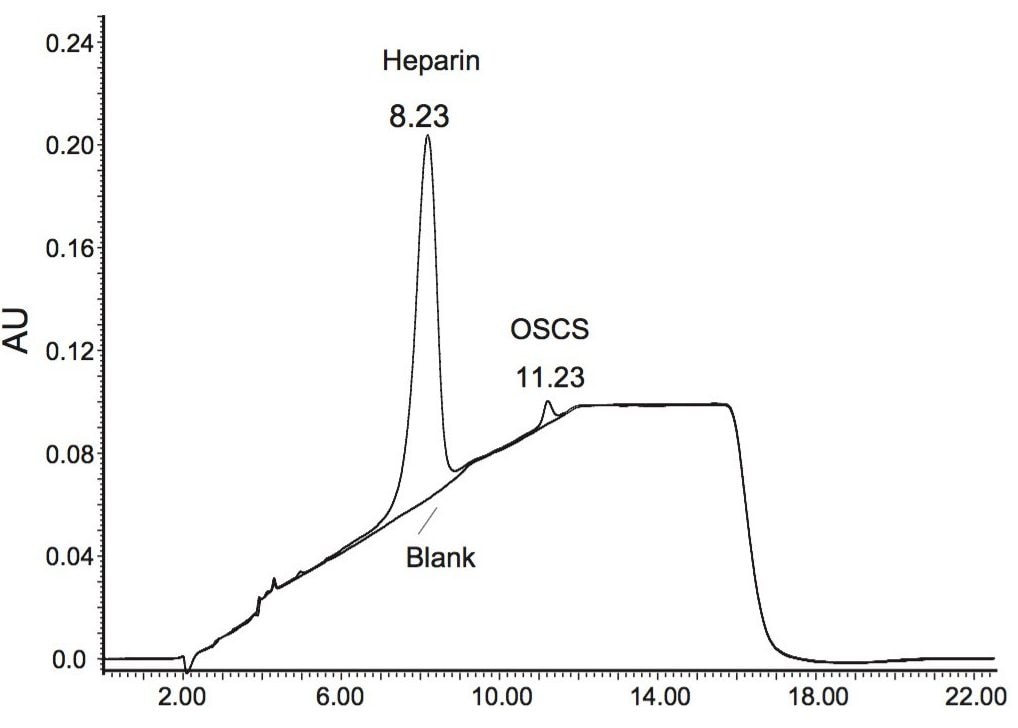
This application note presents a simple method to separate and quantify oversulfated chondroitin sulfate (OSCS) in the presence of heparin. The method uses anion exchange chromatography to achieve complete resolution between heparin and OSCS, and UV absorption to quantify the concentrations of heparin and OSCS. The results dem-onstrate the method not only generates reproducible, fast separations (10 minutes) but also detect OSCS at a concentration of less than 1% of overall content. The ability to quickly and unambiguously analyze the purity of heparin drugs can improve and accelerate the quality control of raw API materials in pharmaceutical industry. The sensitive testing method can be used to screen for heparin quality and OSCS adulteration in order to protect patient health.

Experimental

Sample preparation

Heparin Sodium Identification RS (part no. 1304038) and Heparin Sodium System Suitability RS (part no. 1304049) were purchased from U.S. Pharmacopeia. The Heparin Sodium System Suitability RS is a mixture that contains approximately 80% Heparin and 20% OSCS.

Stock solutions (10 mg/mL) of Heparin Sodium standard or Heparin Sodium System Suitability standard were prepared by reconstituting the samples in Milli-Q water. Samples with diluted concentrations were prepared by diluting the stock solutions to the desired concen-tration using Milli-Q water.

LC conditions

LC system:

Alliance HPLC Bioseparation (Alliance HPLC Bio) System

Column:

Spherisorb 5 μm SAX Column, 4.0 x 250 mm

Column temp:

40 °C

Flow rate:

0.5 mL/min

Mobile phase:

Eluent A: 50 mM NaH2PO4 (pH 2.5)

Eluent B: 50 mM NaH2PO4+ 2.0 M NaCIO4 (pH 2.5)

Gradient:

10% to 90% B in 10 min

Sample inj. vol:

25 μL

UV Detector

Detector:

2998 Photodiode Array (PDA) Detector

Wavelength:

190 nm to 400 nm

Sampling rate:

2 pts/s

Resolution:

1.2 nm

Results and Discussion

Bioseparations using ion exchange chromatography typically involve the use of harsh salts and extreme pH conditions. To develop a robust and high-resolution anion exchange chromatography separation method for routine heparin analysis, a Waters Alliance HPLC Bioseparation (Alliance HPLC Bio) System, featuring a titanium/polymeric flow path was chosen to ensure high-precision, reproducible delivery of mobile phases with high salt concentrations.

Figure 1 shows an overlay elution profile for the Heparin Sodium System Suitability RS and the Heparin Sodium Identification RS from U.S. Pharmacopeia. The extracted chromatogram for the system suitability sample (at 202 nm wavelength) showed two distinct peaks with retention times of 8.25 and 11.43 minutes, while the heparin sodium standard sample only gave one chromatographic peak at 8.25 minutes. Comparison between the two chromatographic traces indicates that heparin is eluted first at 8.25 minutes, followed by OSCS at 11.43 minutes. This figure shows that strong anion exchange (SAX) chromatography can be used to rapidly separate heparin from OSCS with a 10-minute linear gradient.

The chromatographic repeatability of the separation from run to run was investigated using a 1.0 mg/mL solution of Heparin Sodium System Suitability RS. To determine the reproducibility of the separation, the retention times at the peak top for corresponding heparin and OSCS peaks were collected for 10 consecutive injections, and the retention time variations were calculated. Figure 2 shows an example of the overlay of UV chromatograms obtained from four injections of the sample. The retention time RSD (relative standard deviations) values for heparin and OSCS were 0.08% and 0.05%, respectively.

Capillary electrophoresis (CE) was previously employed to separate heparin and OSCS. The electropherogram generated from the same system suitability test sample is different from Figure 1. Only limited separation was achieved between heparin and OSCS during CE separation,3 and the elution order of heparin and OSCS was also reversed in the electropherogram with over-sulfated chondroitin sulfate migrating faster than heparin sodium in the CE analysis. The retention time difference of heparin and OSCS between the two different separation techniques confirms that the SAX separation of heparin and OSCS is based on the negative charge density on the linear polysaccharide chain. Structurally, OSCS bears at least one extra sulfate group for every disaccharide repeat unit compared to heparin.

Figure 1. UV chromatograms (202 nm) of USP heparin standard RS (in purple) and USP heparin system suitability test sample RS (in red) using Spherisorb 5 μm SAX 4.0 x 250 mm. 25 μg of the materials were injected onto the column for each analysis.
Figure 2. Overlay of UV chromatograms (202 nm) of four replicate injections of USP heparin system suitability test sample RS, showing the reproducibility of the separation by Spherisorb 5 μm SAX 4.0 x 250 mm. 25 μg of the materials was injected onto the column for each injection.

One of the basic requirements for developing analytical methods for quality control purposes lies in quantitative impurity analysis. The method should entail simultaneous analysis of a large amount of the parent compound and a low level of impurity. On the basis of successful separation of heparin and OSCS by SAX, the linear dynamic range of the method was investigated. A stock solution of the system suitability sample was prepared (10.0 mg/mL), and samples with a series of concentrations from 5.0 mg/mL to 0.1 mg/mL were prepared by sequential dilution of the stock solution. These solution standards were injected onto the SAX column in triplicate at an injection volume of 25 μL. Figure 3 shows the calibration curves generated from these injections. The calibration curves were generated by plotting the integrated respective peak areas of heparin and OSCS against the total concentrations of the two components. As shown in Figure 3, the calibration curves were linear over two orders of magnitude with R2 values in excess of 0.999.

To test the applicability of the SAX method in impurity analysis, a heparin sample containing roughly 1% of OSCS was created by mixing the solution of heparin sodium standard (at 10.0 mg/mL) and the solution of heparin sodium system suitability RS (1.0 mg/mL) at a pre-calculated ratio. The calculation was based on the presumption that OSCS accounts for 20% of the total concentration in the solution of the heparin sodium system suitability RS. Figure 4 shows the chromatogram obtained from the mixture, where a small well-defined chromatographic peak for OSCS was observed. Integration of the chromatographic peaks for heparin and OSCS yielded peak areas of 87, 294, and 1889 respectively. Based on the calibration plot in Figure 3, the concentration of heparin and OSCS was calculated at 4.610 mg/mL and 0.048 mg/mL. This indicates that heparin was 96.5-fold more concentrated than OSCS in the synthetic mixture, implying that the method indeed can readily detect and quantify the concentration of OSCS with only 1% of heparin concentration.

Figure 3. Calibration curves of heparin and oversulfated chondroitin sulfate (OSCS) over the concentration range from 0.1 mg/mL to 10 mg/mL. The concentrations are given as the sum concentration of the two components.
Figure 4. UV chromatograms showing the separation between heparin and oversulfated chondroitin sulfate (OSCS) where the concentration of OSCS is approximately 1% of heparin concentration. A UV trace of blank injection was also plotted in the graph to show the integrated peak areas of heparin and OSCS.

Conclusion

The combination of the Alliance Bioseparation (AllianceBIO) System with the Spherisorb SAX Column is an ideal solution for the separation and quantification of heparin and OSCS. This method yields rapid, sensitive, and high-resolution separations, and generates quality data for the evaluation and determination of heparin purity. The wide linear dynamic range, in conjunction with the superior separation of the system, make it well-suited for quantitative impurity analysis. OSCS at 1% of heparin concentration is readily detected by the system. The results demonstrate that this system is a suitable method to determine whether OSCS exists as an adulterant to the heparin API .

References

  1. Kemsley, J. Chemical & Engineering News. 2008, 86, 46-47.
  2. Guerrini, M, Beccati, D, Shriver, Z, Naggi, A, Viswanathan, K, Bisio, A, Capila, I, Lansing, J C, Guglieri, S, Fraser, B, Al-Hakim, A, Gunay, N S, Zhang, Z, Robinson, L, Buhse, L, Nasr, M, Woodcock, J, Langer, R,Venkataraman, G, Linhardt, R J, Casu, B, Torri G, Sasisekharan, R. Nature Biotechnology. 2008, 26, 669 – 675.
  3. http://www.usp.org/pdf/EN/hottopics/heparinPresentation.pdf

Featured Products

720002862, November 2008

Haut de la page Haut de la page