• Note d'application

Analysis of Tricyclic Antidepressants in Human Urine Using UltraPerformance Convergence Chromatography (UPC2)

Analysis of Tricyclic Antidepressants in Human Urine Using UltraPerformance Convergence Chromatography (UPC2)

  • Erin E. Chambers
  • Kenneth J. Fountain
  • Waters Corporation

Abstract

UPC2 technology was successfully implemented for the analysis and quantification of TCAs in human urine. Automated screening of key parameters provided excellent separation and intensities for the panel of four TCA drugs used in this study. 

Benefits

  • Environmentally sustainable (green) chemistry
  • Rapid analysis times
  • Quantitative accuracy
  • Orthogonality to reversed phase
  • Compatibility with SPE eluate for direct injection

Introduction

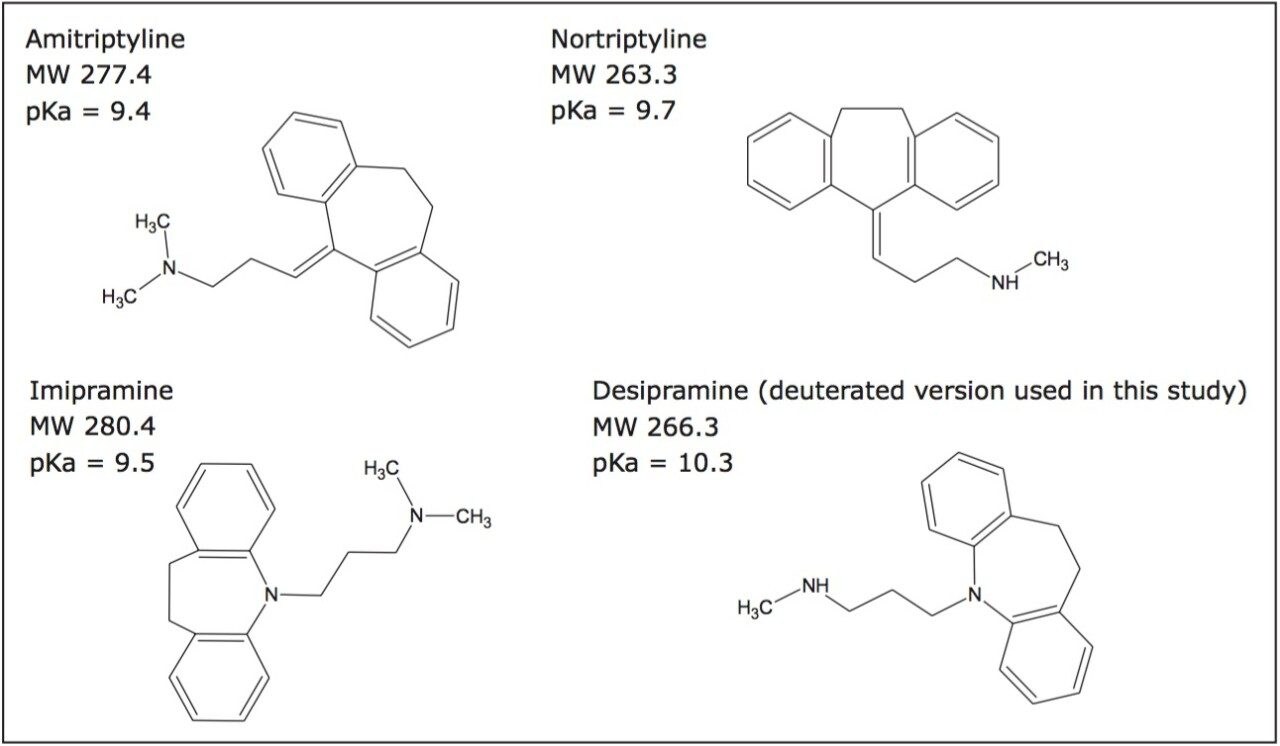
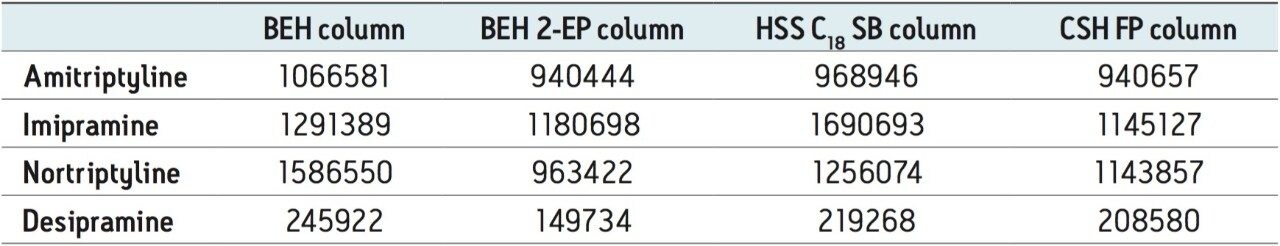
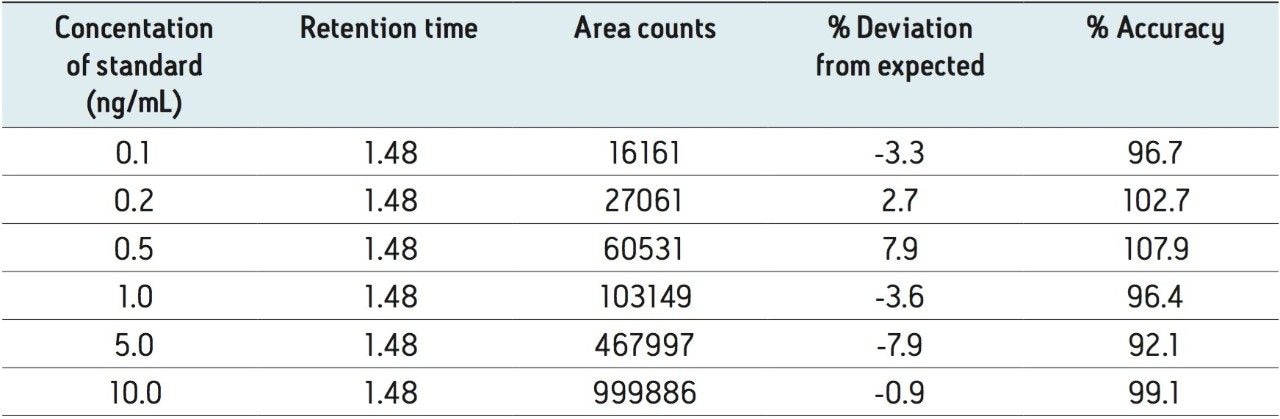
Although tricyclic antidepressants (TCAs) are an older class of drug, they remain pharmacologically relevant. For example, inadequate response to other classes of antidepressants in dosed subjects remains common, ensuring the continued viability of TCAs. Furthermore, the fact that they are significantly less expensive than some of the newer antidepressants warrants their use in outpatient clinics. Historically, TCAs have been analyzed using GC,1 UV,2 or LC-MS.3 UPC2 technology is particularly attractive for bioanalytical assays due to its compatibility with the organic extracts produced by the most common sample preparation techniques utilized in this area, such as protein precipitation (PPT), liquid-liquid extraction (LLE), and solid phase extraction (SPE). The non-aqueous solvent system does not require evaporation and reconstitution of organic extracts prior to injection in the manner often necessary in reversed phase chromatography. Characterized by the use of an environmentally sustainable, renewable primary solvent (CO2), orthogonality to reversed phase chromatography, and availability of diverse stationary phases, UPC2 provides the benefits of reduced solvent consumption and cost, increased bioanalytical method selectivity, and flexibility in method development. Therefore, a proof of concept study was performed to determine the applicability of UPC2 separations to the analysis of TCAs in human urine, as a representative methodology. Structures for the specific TCAs used in the study are shown in Figure 1. While method development approaches for GC and LC are well defined and routinely used, method development for UPC2 separations is a newer area of research. This application highlights certain key UPC2 parameters and suggests appropriate screening options. For example, column chemistry, pH, and injection solvent were systematically and automatically screened using a column manager and a four-solvent switching system. Once a column, mobile phase, and injection solvent were chosen, the gradient was optimized, and extracted urine samples were analyzed using the best conditions from the screening experiments. Lower limits of quantification (LLOQs) of 0.1 ng/mL in urine were easily achieved for each of the antidepressants tested, and met the FDA criteria for LLOQ determination for bioanalytical methods. In addition, abbreviated standard curves (without internal standard) were linear and accurate within +/- 1% to 8%.

Figure 1. Structures of tricyclic antidepressant analytes.

Experimental

UPC2 conditions

System:

ACQUITY UPC2

Column:

ACQUITY UPC2 BEH 2.1 x 50 mm, 1.7 μm

Mobile phase A:

CO2

Mobile phase B:

0.2% NH4OH in methanol

Wash solvents:

60:40 acetonitrile/ isopropanol + 2% formic acid

Separation mode:

2% to 40% B over 2.0 min; held at 30% for 1 min

Flow rate:

1.4 mL/min

CCM back pressure:

1750 psi

Column temp.:

40 °C

Sample temp.:

10 °C

Injection volume:

2.0 μL

Run time:

3.0 min

Make-up flow:

0.25 mL/min 0.2% NH4OH in isopropanol

Collection plates:

Waters 1 mL ACQUITY collection plates

MS conditions

Mass spectrometer:

Xevo TQ-S

Ionization mode:

ESI positive

Capillary voltage:

1.0 kV

Collision energy:

Optimized by component (see Table 1)

Cone voltage:

Optimized by component (see Table 1)

Data management

Chromatography software:

MassLynx

Quantification software:

TargetLynx

Optimization software:

IntelliStart

Table 1. MS conditions for the panel of four antidepressants.

Sample description

Urine samples were prepared using Oasis WCX 96-well μElution plates. Briefly, 200 μL of sample was mixed with 200 μL 4% H3PO4. The wells of the extraction plate were conditioned with 200 μL of methanol, followed by equilibration with 200 μL of water. The diluted sample (400 μL) was loaded onto the plate. Samples were then washed with 200 μL of 10 mM ammonium acetate, pH 6, followed by 200 μL methanol. TCAs were eluted with two 25 μL aliquots (later combined) of 60:40 ACN/MeOH containing 2% formic acid. 2 μL of the resulting solution was directly injected onto the ACQUITY UPC2 System.

Stock and working solutions were prepared in methanol. Urine samples containing a panel of five antidepressants were prepared by adding 20 μL of a combined working solution (1 μg/mL each) of the compounds to 2 mL of urine. In this manner, a 10 ng/mL urine sample was created. All subsequent sample concentrations were prepared by serial dilution of the high standard with control human urine. For this proof of concept study, urine samples were prepared and extracted at the following final concentrations: 0.1, 0.2, 0.5, 1.0, 5.0, and 10.0 ng/mL. Blank urine was also extracted in order to determine the lower limit of quantification (LLOQ.)

Results and Discussion

Mixed-mode SPE has previously been shown to be the most selective type of sample preparation used in bioanalysis.4 It relies on dual orthogonal retention mechanisms which separate analytes and endogenous interferences. Therefore, it was the first choice in this analysis. A mixed-mode weak cation exchanger was employed for the following two reasons: the analytes are basic and are expected to retain by ion exchange, and the final elution for this particular sorbent is acidic in nature. Screening of injection solvents revealed that an acidic injection solvent provided the best peak shape and sensitivity (data not shown). Therefore, Oasis WCX was the natural choice. The generic extraction method was modified slightly to ensure complete retention of all analytes by ion exchange. SPE recovery from human urine was 92% to 104% for all analytes in the final elution, with an RSD of 3% to 6%. SPE eluates were injected directly without further dilution or evaporation, simplifying the overall workflow while improving throughput.

Systematic chromatographic screening

The method development process systematically screened columns, modifiers, and modifier additives to achieve the best separation. Four UPC2 columns were screened including: ACQUITY UPC2 BEH, BEH 2-EP, HSS C18 SB, and CSH Fluoro-Phenyl. All columns were 2.1 x 50 mm, 1.7 μm particle size. The three mobile phase B solvents used were methanol, methanol with 0.2% formic acid, and methanol with 0.2% NH4OH. The screening process was performed with a generic 2% to 45% B gradient over 3 min, holding at 45% for 1.5 min. The methanol with ammonium hydroxide provided the best overall peak shape, sensitivity, and resolution for each of the columns. A comparison of the four stationary phases using this high pH mobile phase is depicted in Figure 2. All columns give similar elution order with the exception of the HSS SB column. However, peak widths are significantly wider on this column, which reduces the signal-to-noise ratio, and can impact detection of low level samples. The broad peak widths are perhaps due to increased secondary interactions with the stationary phase. Although not included in this work, testing with additional classes of compounds on the ACQUITY UPC2 System has shown that this may be ameliorated through the use of a buffered mobile phase modifier such as 20 to 40 mM ammonium formate. The primary goal of the chromatography in this study was not to achieve absolute baseline separation of the analytes, but to obtain the best peak shape and maximize sensitivity; thus, peak areas were examined for each column. Table 2 summarizes the area counts for the analytes on each of the columns under high pH modifier conditions.

Figure 2: Effect of stationary phase where mobile phase B = 0.2% NH4OH in MeOH.
Table 2. Summary of area counts for the analytes using four different columns.

Peak areas for amitriptyline and imipramine did not change significantly across the various columns screened, while areas for desipramine and nortriptyline were markedly affected by stationary phase chemistry. For example, area counts for desipramine were 11% to 40% higher on the BEH column than the others. Similarly, areas for nortriptyline were 21% to 40% higher on the BEH column. Although separation was slightly better overall on the BEH 2-EP column, the increased signal intensity on the BEH column made it the best option for low level quantitative analysis of the TCAs. Furthermore, peak widths on the BEH column were <2 s wide at base, on average, improving signal to noise for low concentration samples.

On all columns, the maximum system pressure observed was less than 4200 psi, operating well within the pressure limitations of the system while allowing the flexibility to increase flow rate, if desired, to further reduce the chromatographic run time.

In addition to the stationary phase, various modifiers were also evaluated. Figure 3 shows the effect of the mobile phase B modifier choice for the ACQUITY UPC2 BEH column. Other columns showed a similar trend. The best resolution and peak shape were always obtained using the NH4OH additive. Methanol alone typically resulted in the broadest peaks, latest elution time, and worst separation. Using formic acid as the modifier resulted in increased retention, less resolution, and broader peaks relative to NH4OH.

Figure 3: Effect of various mobile phase B modifiers using the BEH column.

In order to reduce the run time and improve sample throughput, the screening gradient was compressed. There was no negative impact on peak shape, resolution, or sensitivity. The final cycle time was 3 min.

Sensitivity, linearity, and quantitative accuracy

A limited study was performed to assess accuracy and linearity of the method. Abbreviated standard curves (without internal standards) were prepared in control human urine from 0.1 to 10.0 ng/mL. Using the final method described in the experimental section, curves were linear using 1/x weighting and resulted in R2 values of >0.998. Average deviation from expected concentrations for standard curve points were <8%. Table 3 contains representative standard curve statistics for amitriptyline. An LLOQ of 0.1 ng/mL for all analytes was easily achieved. Signal-to-noise ratios at this level were 334, 292, 590, and 66:1 for amitriptyline, imipramine, nortriptyline, and desipramine D3, respectively. Each signal was much higher than 5x the level in the blank extracted urine sample, meeting typical FDA criteria for LLOQ determination. Representative extracted ion chromatograms for 0.1 ng/mL desipramine D3 and blank urine are shown in Figure 4.

Table 3. Representative standard curve statistics for amitriptyline extracted from human urine.
Figure 4. Extracted blank urine (bottom chromatogram) and urine containing 0.1 ng/mL desipramine D3 (top chromatogram).

Conclusion

UPC2 technology was successfully implemented for the analysis and quantification of TCAs in human urine. Automated screening of key parameters provided excellent separation and intensities for the panel of four TCA drugs used in this study. Minor adjustments of the screening gradient were made to give a total cycle time of 3 min. Urine samples were extracted using Oasis WCX in 96-well μElution format. Recoveries for the TCAs ranged from 92% to 104% from human urine. Abbreviated standard curves were prepared from 0.1 to 10.0 ng/mL and were found to be linear with an average accuracy of 99% for the points on the standard curve. An LLOQ of 0.1ng/mL was easily achieved for all analytes, readily accommodating the needs of a bioanalytical study.

Overall, we have shown the utility and benefits of a novel separation technology, UPC2, in the important application area of bioanalysis. The use of a green primary mobile phase, the ability to directly inject samples without dilution or evaporation, and the recognized orthogonality (to reversed phase) of this approach make it very attractive for quantitative analysis of drugs in biological matrices.

References

  1. (a) Baker GB, Coutts RT, Holt A. Derivatization with acetic anhydride: Applications to the analysis of biogenic amines and psychiatric drugs by gas chromatography and mass spectrometry. Journal of Pharmacological and Toxicological Methods. 1994; 31(3): 141-148. (b) Pujadas M, Pichini S, Civit E, Santamariña E, Perez K, de la Torre R. A simple and reliable procedure for the determination of psychoactive drugs in oral fluid by gas chromatography-mass spectrometry. Journal of Pharmaceutical and Biomedical Analysis. 2007; 44 (2): 594-601.
  2. (a) Cantú M, Toso D, Lacerda C, Lanças F, Carrilho E, Queiroz M. Optimization of solid-phase microextraction procedures for the determination of tricyclic antidepressants and anticonvulsants in plasma samples by liquid chromatography. Analytical and Bioanalytical Chemistry. 2006; 386 (2): 256-263. (b) Frahnert C, Rao ML, Grasmäder K. Analysis of eighteen antidepressants, four atypical antipsychotics and active metabolites in serum by liquid chromatography: a simple tool for therapeutic drug monitoring. Journal of Chromatography B. 2003; 794 (1):35-47. (c) Hostette AL, Stowe ZN, Cox M, Ritchie JC. A Novel System for the Determination of Antidepressant Concentrations in Human Breast Milk. Therapeutic Drug Monitoring. 2004; 26(1): 47-52. (d) Malfará WR, Bertucci C, Costa Queiroz ME, Dreossi Carvalho SA, de Lourdes Pires Bianchi M, Cesarino EJ, Crippa JA, Costa Queiroz RH. Reliable HPLC method for therapeutic drug monitoring of frequently prescribed tricyclic and nontricyclic antidepressants. Journal of Pharmaceutical and Biomedical Analysis. 2007; 44(4): 955-962. (e) Ruiz-Angel MJ, Carda-Broch S, Simó-Alfonso EF, Alvarez-Coque MC. Optimized procedures for the reversed-phase liquid chromatographic analysis of formulations containing tricyclic antidepressants. Journal of Pharmaceutical and Biomedical Analysis. 2003; 32(1): 71-84. (f) Theurillat R, Thormann W. Monitoring of tricyclic antidepressants in human serum and plasma by HPLC: characterization of a simple, laboratory developed method via external quality assessment. Journal of Pharmaceutical and Biomedical Analysis. 1998; 18(4-5): 751-760.
  3. (a) Santos-Neto AJ, Bergquist, Lanças FM, Sjöberg PJ. Simultaneous analysis of five antidepressant drugs using direct injection of biofluids in a capillary restricted-access media-liquid chromatography–tandem mass spectrometry system. Journal of Chromatography A. 2008; 1189(1-2):514-522. (b) Sauvage FL, Gaulier JM, Lachâtre G, Marquet P. A Fully Automated Turbulent- Flow Liquid Chromatography-Tandem Mass Spectrometry Technique for Monitoring Antidepressants in Human Serum. Therapeutic Drug Monitoring. 2006; 28(1): 123-130. (c) Shinozuka T, Terada M, Tanaka E. Solid-phase extraction and analysis of 20 antidepressant drugs in human plasma by LC/MS with SSI method. Forensic Science International. 2006; 162(1-3): 108-112. (d) Titier K, Castaing N, Le-Déodic M, Le-bars D, Moore N, Molimard M. Quantification of Tricyclic Antidepressants and Monoamine Oxidase Inhibitors by High-Performance Liquid Chromatography-Tandem Mass Spectrometry in Whole Blood. Journal of Analytical Toxicology. 2007; 31(4): 200-207.
  4. Chambers E, Wagrowski-Diehl DM, Lu Z, MazzeoJR. Systematic and comprehensive strategy for reducing matrix effects in LC/MS/MS analyses. Journal of Chromatography B. 2007; 852(1-2): 22-34.

720004565, January 2013

Haut de la page Haut de la page