Data Independent HDMSE High Throughput Drug Library Screening Using the DESI XS Source
Abstract
Desorption electrospray ionization (DESI) coupled to an ion mobility separation (IMS) capable mass spectrometer has been utilized for the rapid analysis of small molecule pharmaceuticals, demonstrating its potential as a library screening tool. A total of 96 FDA approved small molecule pharmaceuticals were ionized directly off a Teflon spotted microscope slide using a DESI Inlet. Analysis was performed on a SYNAPT XS Mass Spectrometer operating in positive HDMSE mode (high and low fragmentation energy channel monitoring with IMS active), with sample throughput of less than 3 seconds (11 samples/30 second cycle time).
Using this approach 84% of the compounds investigated were detected and successfully matched against an LC generated library. Identity for each standard was confirmed by comparing precursor mass, fragment ion data and analytically derived collision cross section (CCS) values within a UNIFI Database. Correlation between the LC and DESI Inlet Method was excellent, demonstrating the applicability of DESI as a library generation tool in addition to its suitability for screening applications.
Benefits
- Rapid, high throughput acquisitions
- CCS library matching against LC acquired data
- Rapid data processing using MassLynx, HDI or imported into UNIFI
- Easily tailored, screening libraries available
- Simple sample preparation – potentially automatable
Introduction
Developing a rapid, information rich method of sample analysis allows for decisions to be made quickly and with confidence. While LC-MS provides a reliable and reproducible approach to sample analysis and component identification there are occasions where the throughput of LC-MS is insufficient, or the high resolving power of the chromatography system is unnecessary. For these occasions: such as library screening or confirmation of synthesis in medicinal chemistry, direct injection MS analysis is often suitable to address the challenge at hand. However, even with direct injection throughput is limited to the LC autosampler speed, often in the 20–40 second time scale.
DESI MS enables the analysis of samples directly from a surface, such as a glass slide, and has been successfully employed as a mass spectrometry imaging tool for the direct analysis of compounds from surfaces such as: human and animal tissues, plants, tablets, or TLC plates. As sample analysis using the DESI Inlet does not require autosampler loading it reduces sample-to-sample “injection” times to 1–2 seconds facilitating the opportunity for rapid screening of samples.
Advancements of DESI Technology in recent years have significantly improved the useability and sensitivity of the source particularly facilitated by the development of a new high‑performance sprayer (HPS).1 The combination of the DESI XS Source and its enhancements means it is now possible to achieve significantly improved ionisation efficiencies compared to previous models. A consequence of this is that analysis can be performed at much greater scan speeds whilst maintaining a high signal strength.2 Coupled with an improved user-friendly set-up, access to this technology has been simplified for non-expert scientists, while still retaining minimal sample preparation. The enhancements to the DESI XS Source have improved usability, performance, and speed; thus opening up the applicability of this technology for high throughput screening applications of the sort described here for library analysis.
Experimental
A selection of FDA approved pharmaceutical compounds were purchased and prepared to a concentration of ~100–250 µg/mL in a suitable solvent (typically a methanol or Water:methanol solution). For analysis 3 µL of each standard was pipetted onto a Teflon spot bound to a glass microscope slide (Waters p/n: 700012809) and placed in a vacuum desiccator until completely dry. Figure 1 shows the slide with the image area highlighted as a red line.
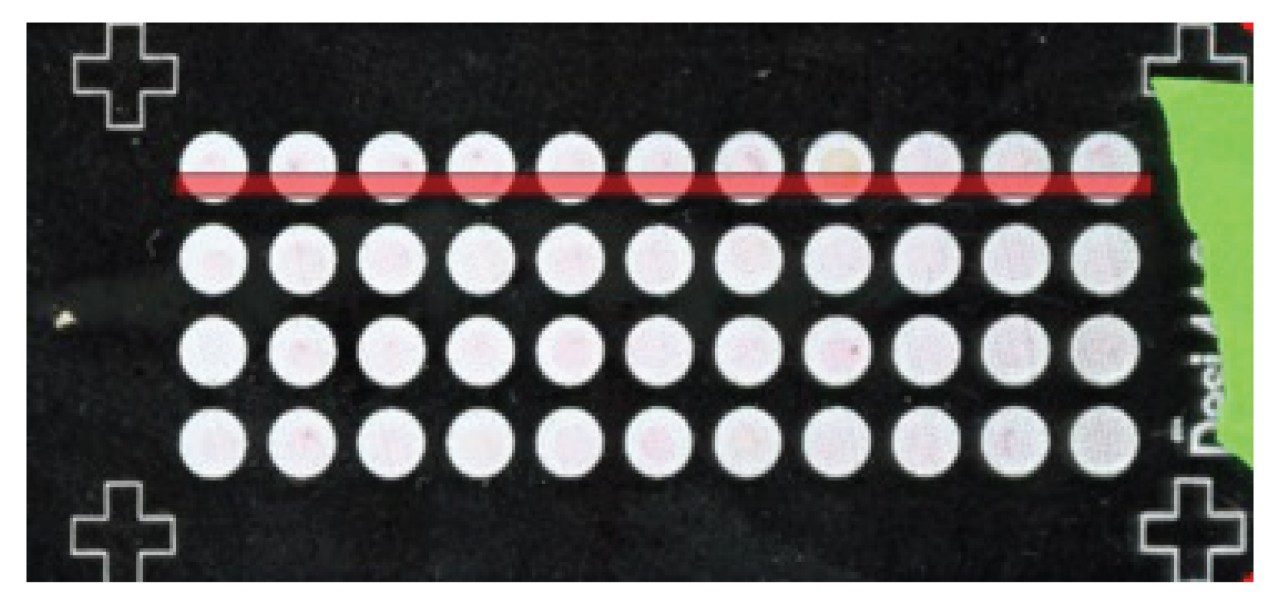 Figure 1. A scan of the slide with a red box indicating analysis area.
The slide was analyzed directly using a SYNAPT XS fitted with a DESI XS Source. The data were acquired using a single pass over the slide, this produced a TIC comparable to that observed from an LC analysis (Figure 2).
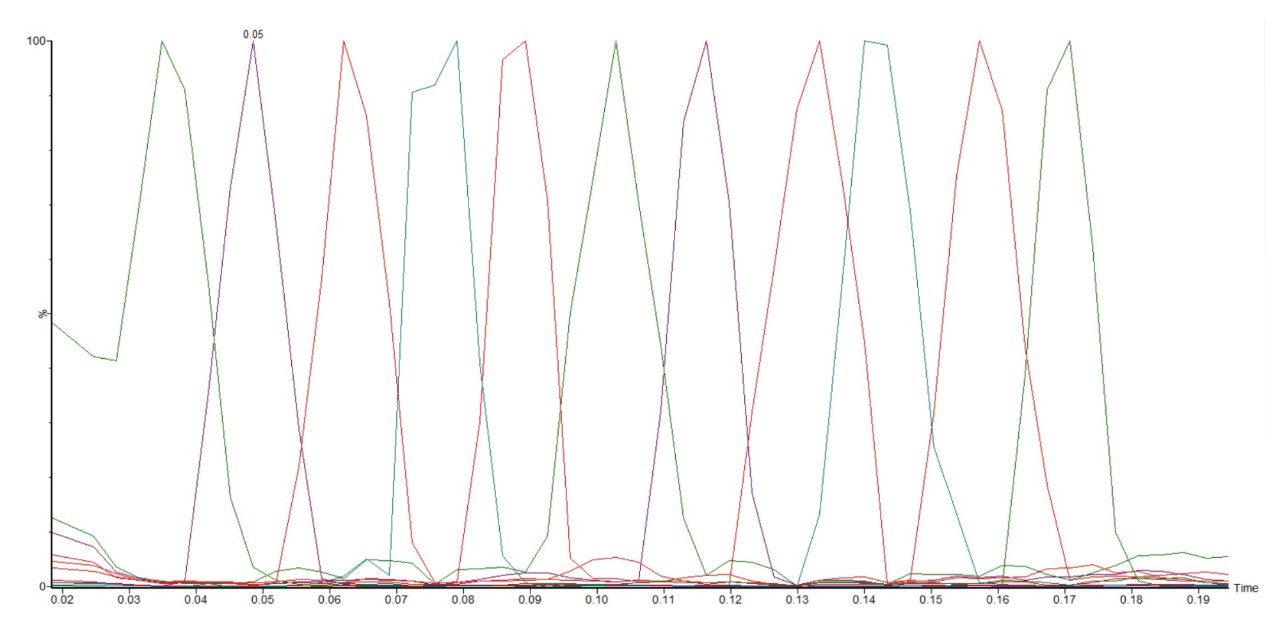 Figure 2. MassLynx XIC overlay showing a single line of FDA compounds acquired using this method. Compounds in order are: Reserpine, propranolol, atenolol, metaprolol, rosuvastatin, simvastatin, glipizide, levofloxacin, moxifloxacin, otnzapine, and terfendadine.
Analysis Conditions
|
Source: |
DESI XS |
|
Instrument: |
SYNAPT XS |
|
Acquisition mode: |
Positive HDMSE |
|
Solvent: |
98:2 Methanol:water, 0.1% formic acid |
|
Capillary voltage: |
1.1 kV |
|
Cone voltage: |
60 V |
|
Gas flow: |
15 psi |
|
Source temperature: |
150 °C |
|
Transfer line temperature: |
Ambient |
|
Scan speed: |
10 scans per second |
|
Pixel size: |
500 µm |
|
Acquisition range: |
100–1200 Da |
|
Software: |
HDI v1.6 MassLynx v4.2 UNIFI v1.9.2 |
Results and Discussion
This assay was performed on a SYNAPT XS fitted with a commercially available DESI XS Source using the Waters high-performance sprayer and a standard non-heated inlet capillary. A total of 96 compounds were analyzed for detection confirmation and CCS (collision cross section calculated from drift time through an ion mobility cell) and the data were compared to an LC generated database. These compounds ranged in class including but not limited to: betablockers, muscle relaxants, anti-inflammatories, synthetic hormones, antibiotics, and anti‑depressants.
The data generated demonstrates that pure pharmaceutical standards can be screened rapidly using the DESI XS Technology. A total of 11 individual standards can be analyzed in a 20 second analysis giving a ~2 second analysis time per sample. Cycle time between rows is approximately 10 seconds giving an overall run time of ~2 minutes per 44 microscope slide sample array and less than 3 seconds per sample for large cohort analysis.
The data in Figure 2 shows an XIC overlay of one 11 spot pass (the displayed data was not normalized with linked axis and the signal intensity does vary with compound). The data presented in Figure 2 demonstrates the speed in which this analysis can be performed using the DESI XS Source. The analysis time can be increased if desired to give longer scan times, thus improved signal intensity can be obtained for: less concentrated/poorly ionizable compounds, more complex samples, or should an operator wish for a greater baseline separation between the samples being investigated.
The mass spectrum illustrated in Figure 3 shows the data obtained for propranolol (m/z 260.3 Da) demonstrating the clarity and strength of the signal achievable using this inlet method. It can also be seen that as a soft ionisation source the DESI XS produces little fragmentation during ionisation giving the operator cleaner spectra with the option of using high energy fragmentation should fragmentation be desired for improved identification confidence.
 Figure 3. An example spectra from a spot of pure propranolol, demonstrating excellent signal strength and an easily processed spectra.
The acquired DESI Data was transferred to the UNIFI Informatics Platform for processing, from the data it was possible to positively identify 73 (76%) of the of the 96 compounds analysed (when searched against an LC generated database). A small number of additional m/z values corresponding to the analysed compounds were also revealed when the data was manually evaluated, giving an 84% (81 compounds) successful ionisation rate for the 96 compounds investigated within this study. Four of the compounds discovered through this manual investigation were: vitamin E, methacholine chloride, mafenide hydrochloride, and leoprolide acetate, these compounds were not identified through LC analysis and therefore were not present in the UNIFI Database. When the same 96 compounds were analysed by LC an 88% (85 compounds) identification rate was observed and identified against the same LC-generated UNIFI Library.
The DESI XS was able to confidently demonstrate comparable data to that achieved by LC analysis for all compounds ionised and identified by both sources. Figure 4 displays a typical review pane from UNIFI clearly indicating the compound identified (in this case moxifloxacin). The table section gives identification status, with details on observed mass and CCS values giving user confidence in the proposed library match. Other available column options include, but are not limited to, response strength, and adduct information. The lower display shows the identified signal, alongside the high and low energy spectra for the peak identified. Analytically derrived or theoretical fragmentation (from a MOL file) can be performed for which the high energy spectrum precursor and fragment ions can be visually matched with the low energy spectrum displayed above the high energy spectrum. The blue markers indicate a feature of the high energy spectrum is a positively identified fragment, these can be expanded to show proposed corresponding chemical structure (as displayed).
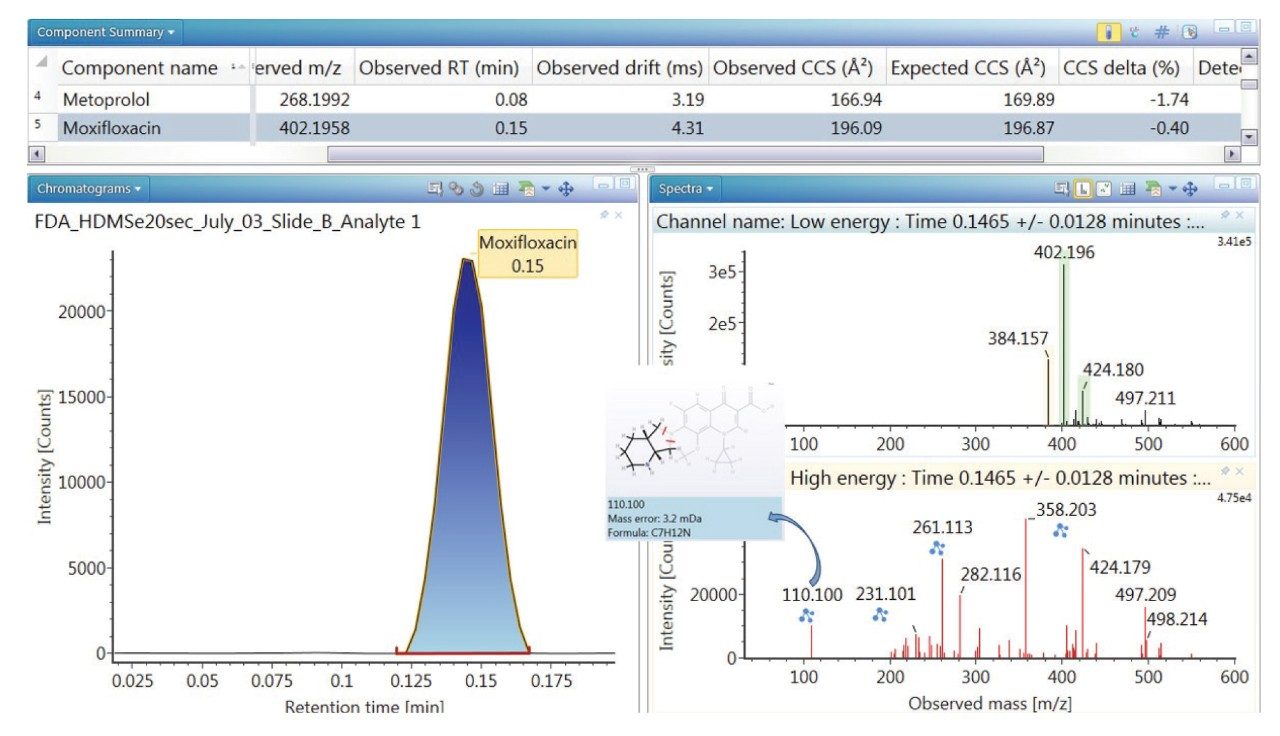 Figure 4. An example UNIFI Review Pane, showing the HDMSE analysis and identification of moxifloxacin.
The UNIFI processing is also able to tabulate “unidentified” components. Unidentified compounds can be filtered into or out of the processing session, depending upon whether the focus is on confirmation of known constituents or for degradation, complex formation, or binding studies.
Database identification for the compounds analysed by DESI were not only matched against accurate mass and fragmentation pattern but also against analytically derived CCS values obtained via LC analysis. These data show excellent alignment between LC derived CCS values and DESI acquired CCS values, demonstrating that CCS values obtained by one method can be utilized to screen and identify compounds ionized using the alternative inlet. These results illustrate the potential for DESI to be used for not only library screening applications, but also for library generation purposes. A graph showing the compatibility between LC vs DESI derived CCS values for the compounds analyzed within this study is illustrated in Figure 5, the data demonstrates a >0.997 CCS correlation between the two source types.
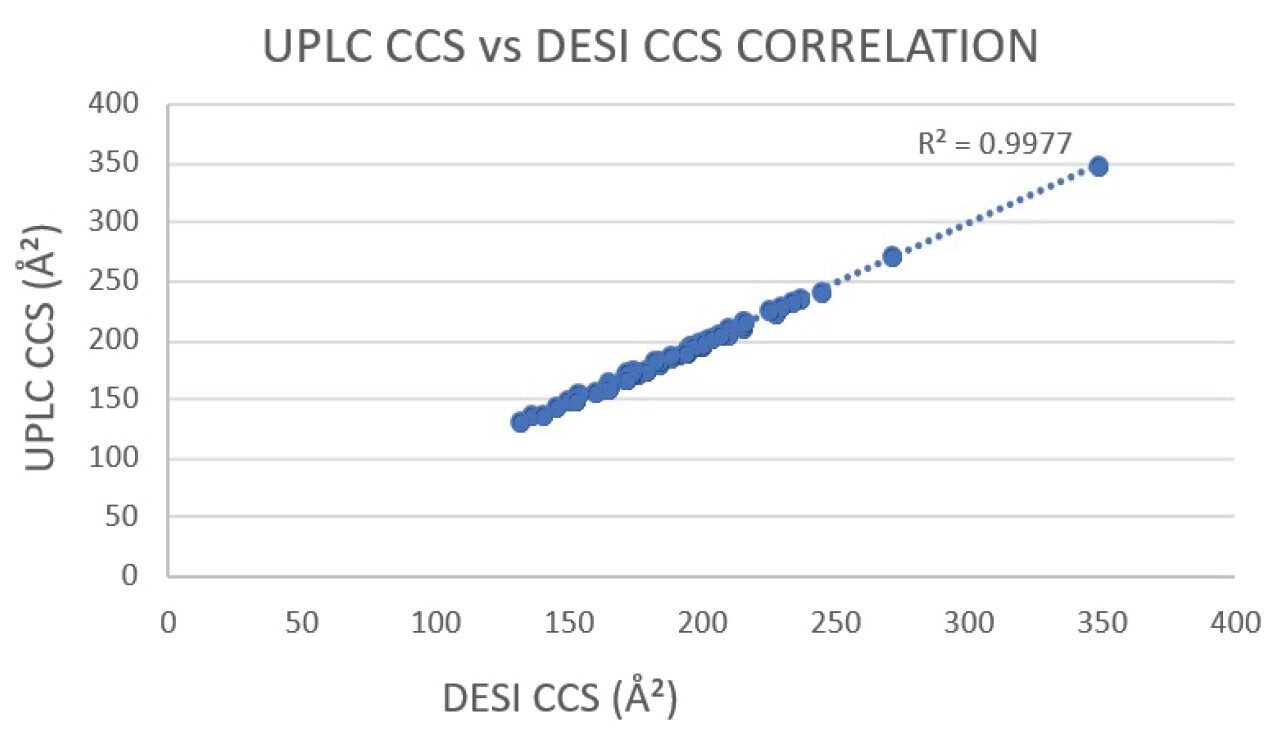 Figure 5. Correlation between CCS values obtained by DESI and those obtained by LC-MS analysis, for each compound analysed.
Conclusion
The combination of SYNAPT XS and DESI XS simplifies and streamlines processes associated with large scale library screening. This application note demonstrates the utility and speed aided by advances in DESI Technology, enabling the creation of a complete, and easy to use workflow coupled to the rapid and accurate compound identification using a UNIFI Drug Library and Processing Tools. Combining traditional MS analysis with the benefit of accurate compound specific CCS information, proven to correlate with LC derived values, the DESI XS Inlet represents a key player for both library generation and screening.
References
- Waters Brochure 720007236EN: A Combination of High Sensitivity and High Mass Resolution Imaging at Speed, With DESI XS on the SYNAPT XS HDMS.
- Nicolás M. Morato, R. Graham Cooks, Inter-Platform Assessment of Performance of High-Throughput Desorption Electrospray Ionization Mass Spectrometry, Talanta Open, Volume 4, 2021, 100046, ISSN 2666–8319.
720007363, September 2021