• Note d'application

Quantitative Analysis of Polysorbate 20/80 in Protein-Based Biopharmaceuticals Using A One-Pot RPLC-MS Based Platform Method

Quantitative Analysis of Polysorbate 20/80 in Protein-Based Biopharmaceuticals Using A One-Pot RPLC-MS Based Platform Method

  • Robert E. Birdsall
  • David Dao
  • Brooke M. Koshel
  • Ying Qing Yu
  • Aude Smeets
  • Michel Gerodez
  • Xavier Taillieu
  • Waters Corporation
  • GlaxoSmithKline

Abstract

A high throughput LC-MS platform method has been developed for the quantitation of Polysorbate 20/80 in protein solutions using readily available materials and reagents. This method is based on the hydrolysis of the fatty acid sorbitan ester followed by a rapid methylation of the free fatty acid(s). A one-pot sample preparation was used to carry out sample preparation to facilitate ease of deployment and amenability to formulation, development, and QC environments. Using a high-throughput reversed phase separation, a fatty acid methyl ester (FAME) profile was achieved in less than 10 minutes on a Waters ACQUITY UPLC H-Class PLUS configured with an ACQUITY QDa Mass Detector in-line for increased specificity and sensitivity. This study demonstrates an LC-MS-based hydrolysis method can be successfully deployed to detect polysorbate constituents at sub-ppm levels using a single quad mass spectrometer. The platform-like nature of the method facilitates ease of deployment and flexibility in the analysis of polysorbate 20 or polysorbate 80 containing drug products.

Benefits

  • Deployable and scalable method for the quantitation determination of Polysorbate 20 and Polysorbate 80 in Biopharmaceutical products 
  • MS-based detection for increased sensitivity and specificity 
  • Minimal sample preparation enables straightforward method transfer

Introduction

Polyoxymethylene sorbitan monooleate (PS-80) and polyoxymethylene sorbitan monolaurate (PS-20) are common surfactants used in the manufacturing and formulation of biopharmaceuticals. As surfactants they are critical components that aid in minimizing protein denaturing, aggregation and adsorptive losses to surfaces.1 As a stabilizing excipient, knowledge of their composition and stability is necessary to determine shelf-life and safety of drug products used in clinical settings. This is of critical importance as degradation of polysorbate caused by oxidative and/or hydrolytic processes has been linked to reduced efficacy of polysorbate containing drug products.1–2 More recently, enzymatic activity from residual host cell proteins such as lipase/esterase have been identified as an additional degradation pathway of polysorbate further increasing the risk to patient safety.3 To this end, characterization, identification, and quantitation of such excipients must be performed to demonstrate drug products containing polysorbate are safe and efficacious in their formulated state.   

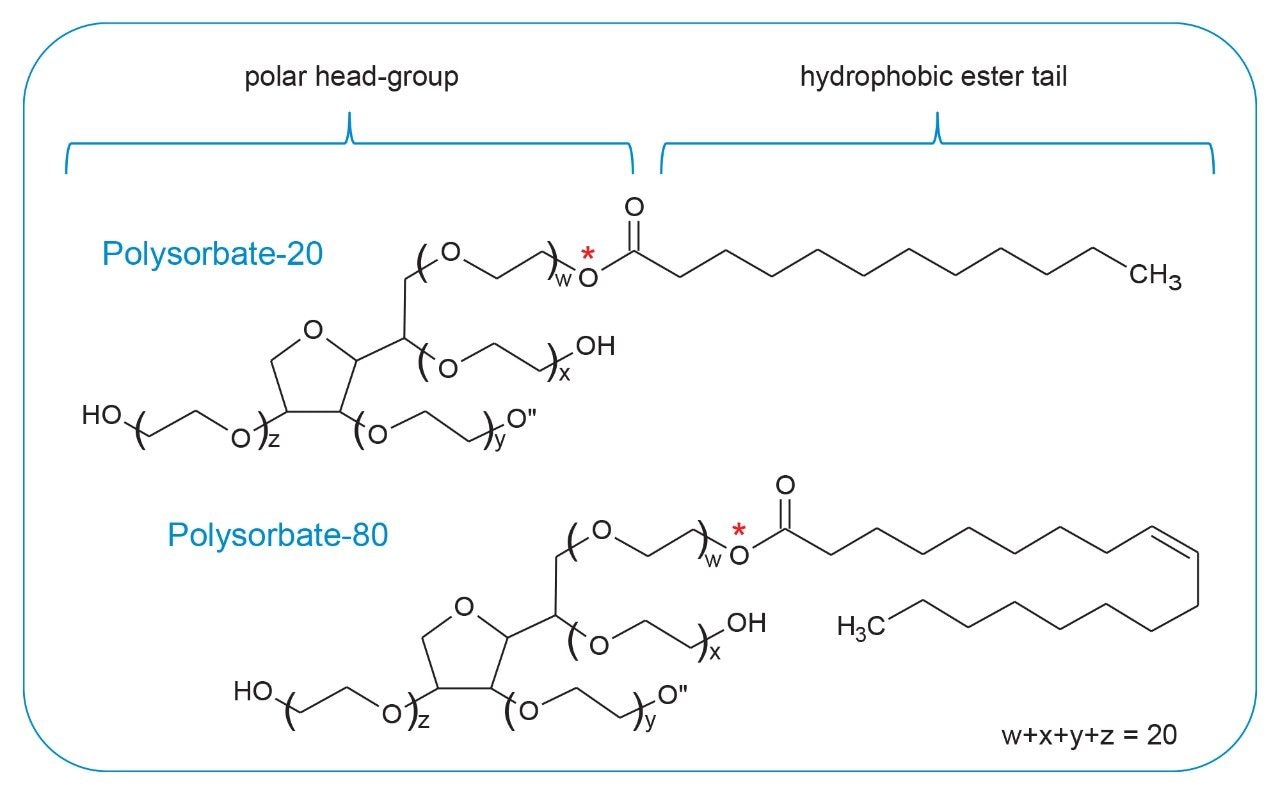
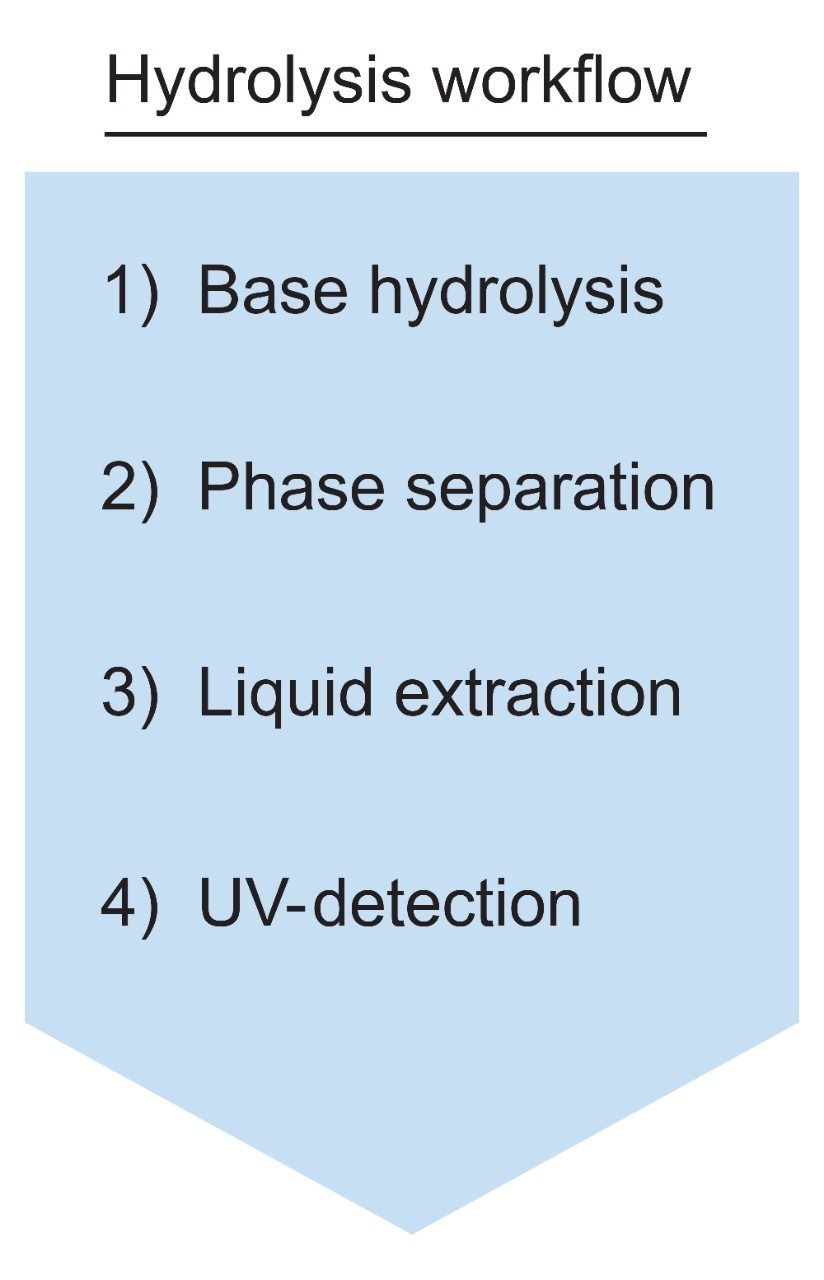
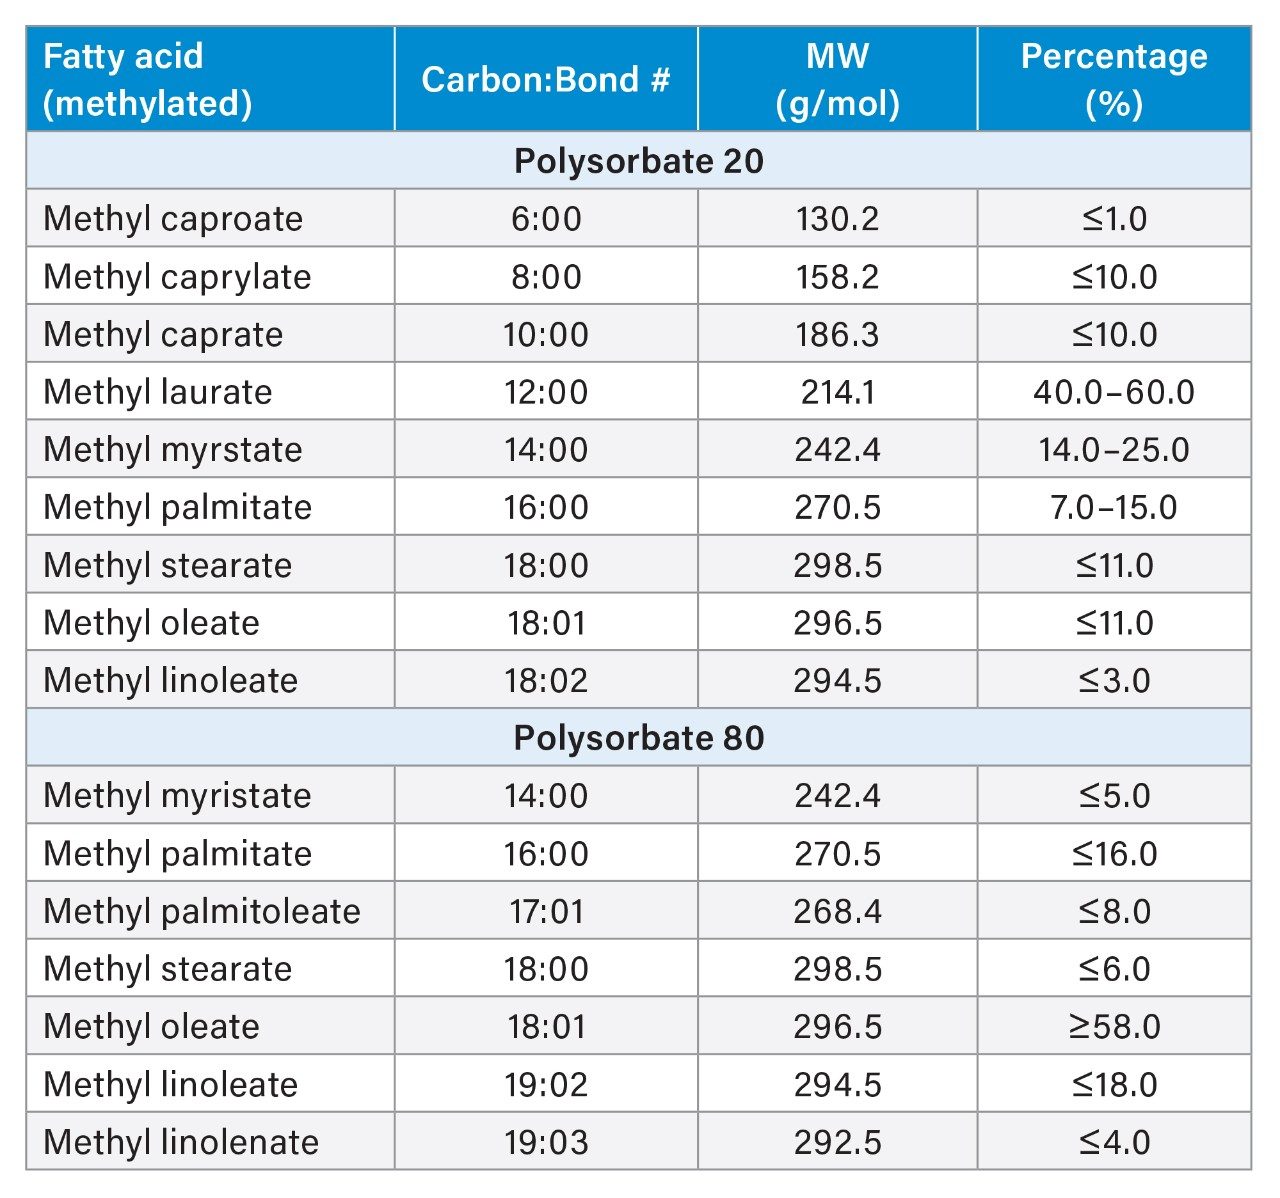
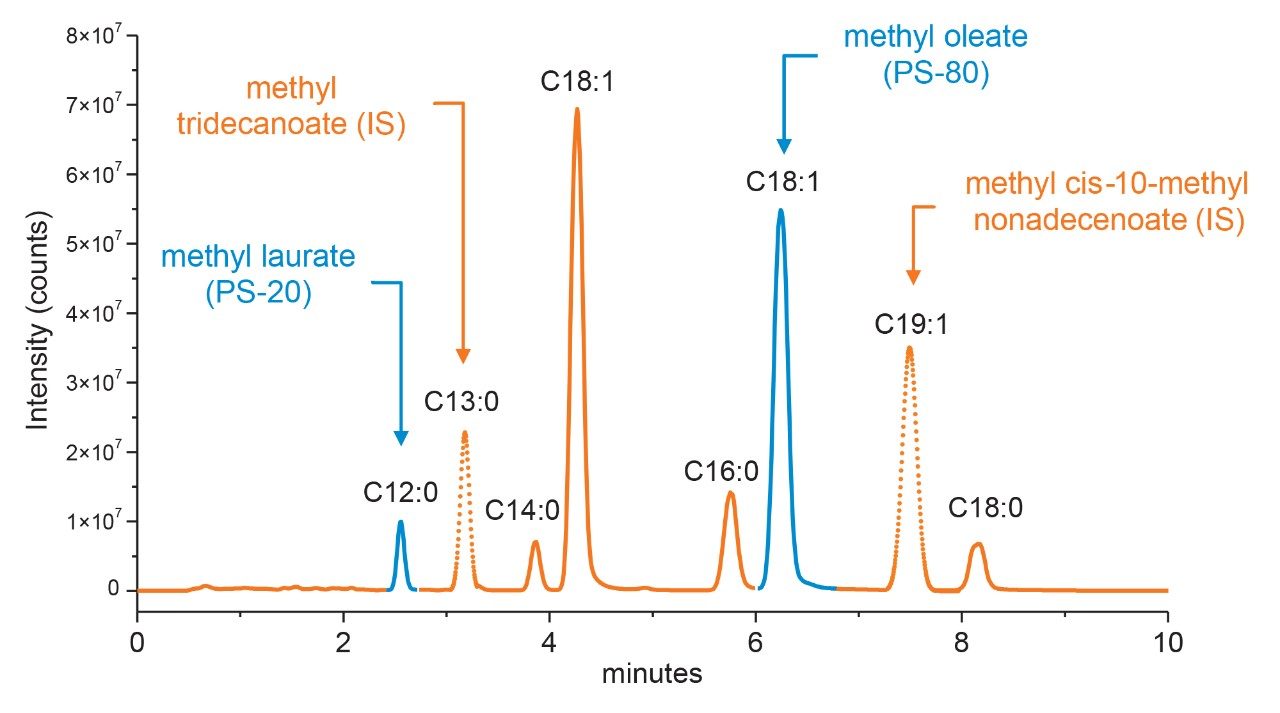
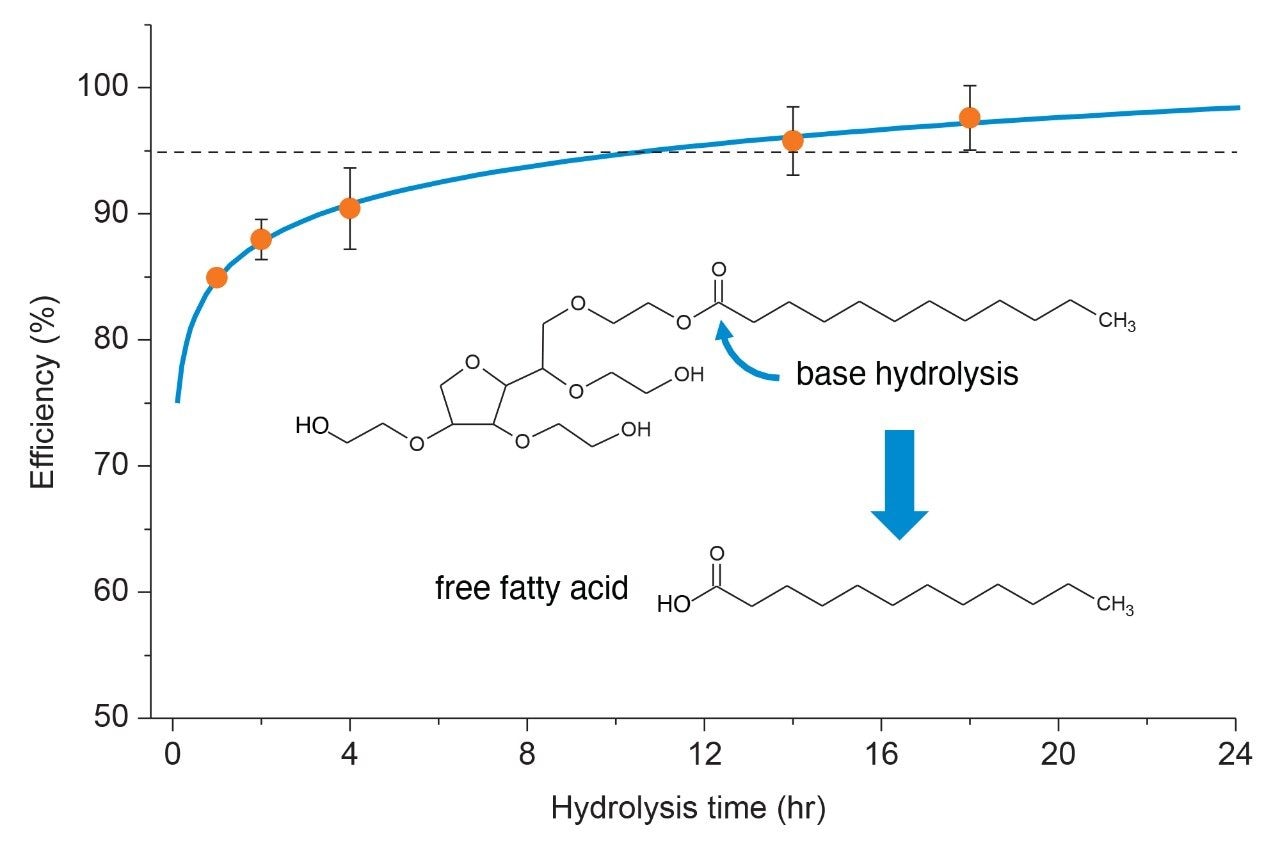
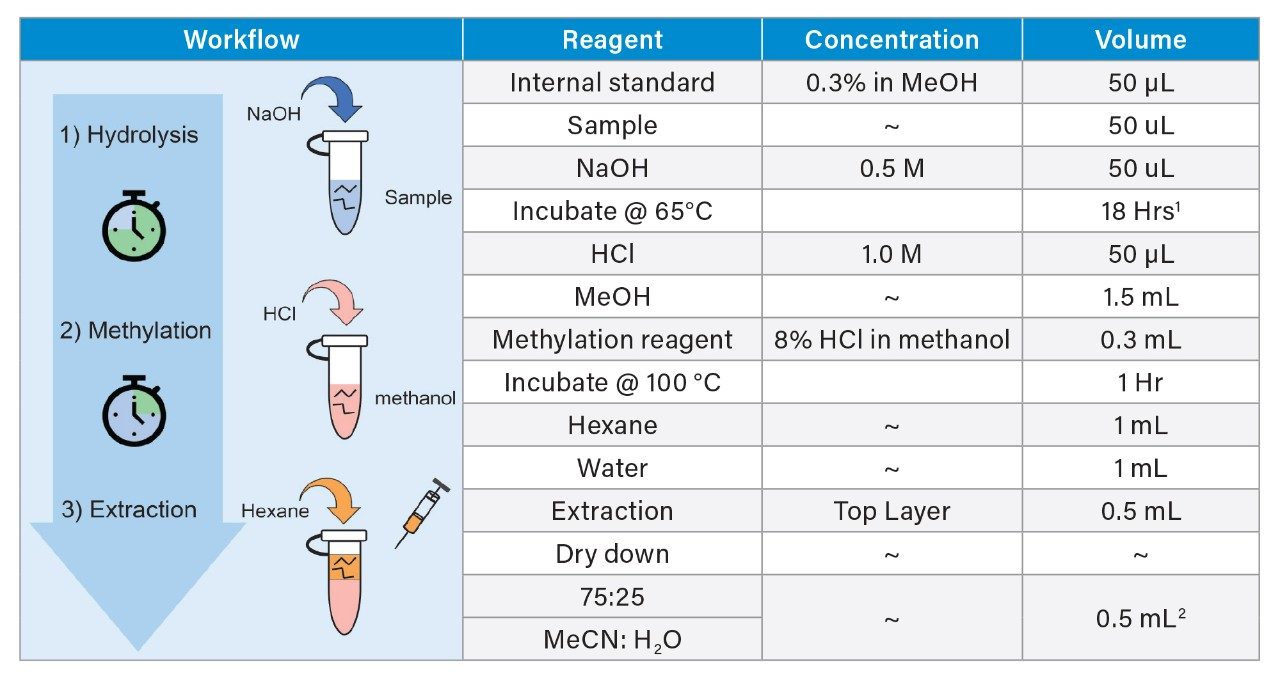
Polysorbate, which is comprised of a polar head-group and hydrophobic tail as shown in Figure 1, is non-volatile in nature and has negligible UV-activity. These unique properties have led to the use of alternative detection techniques such as evaporative light scattering detection (ELSD) and charged aerosol detection (CAD) in the analysis of polysorbate at an intact level.4–5 These methods however, when deployed on HPLC systems, suffer from long elution times (upwards of 40 minutes), as well as complex sample preparations utilizing hazardous materials and reagents. Furthermore, while ELSD and CAD detectors have proven to be useful in the analysis of intact polysorbate, they often lack the fidelity to detect subtle changes in polysorbate concentration and are limited to ppm-levels of detection. Recently, we published a method for the analysis of polysorbate 80 based on common practices found in literature that was shown to be efficient and sensitive.6 In this method, as depicted by the workflow shown in Figure 2, it was demonstrated that sub-ppm levels of detection could be achieved using UV-based detection for the hydrophobic fatty acid tail (oleic acid) following a base hydrolysis of the polysorbate 80 at the ester linkage noted by the asterisks in Figure 1. This method, which used isocratic conditions, relies in part on the notion that the polysorbate raw material is relatively pure with respect to composition and the free fatty acid of interest is UV-active. In practice, as shown in Table 1, polysorbate can be comprised of multiple fatty acid esters conjugated to the base sorbitan molecule each of which can have varying levels of UV-activity based on the structure (saturated vs. unsaturated) of the associated alkyl tail. This is further compounded by the fact that the fatty acid profile of the polysorbate types can span a broad range in concentration increasing the challenge to developing a platform-like UV-based method that can provide sufficient detector response for target constituents of polysorbate in biopharmaceutical samples. Given this, a method that offers increased specificity and sensitivity towards polysorbate and one that can be universally deployed in the analysis of PS-20 and PS-80 containing drug products is highly desirable.

Figure 1.  Structure of polysorbate. Polysorbate is comprised of a hydrophobic fatty acid (lauric acid, PS-20 / oleic acid, PS-80) conjugated to a hydrophilic sorbitan molecule through an ester linkage. The sum of polyoxyethylene units (w+x+y+z) should equal 20.
Figure 2. Analysis Workflow. Cartoon depiction of hydrolysis workflow in the analysis of polysorbate 80.
Table 1. USP monographs for PS-20 and PS-80 indicating regulatory acceptance levels of fatty acid composition of polysorbate 20 and polysorbate 80. *adapted from United States Pharmacopeia website (usp.org).

Experimental

LC Conditions

LC system:

ACQUITY UPLC H-Class PLUS Bio System

Detection:

ACQUITY UPLC TUV w/ 5 mm Titanium flow cell,

Absorption Wavelength: 200 nm

Vials:

Waters TruView

Column(s):

ACQUITY UPLC BEH C8 Column, 130 Å, 1.7 µm, 2.1 mm x 100 mm

Column temp.:

30 °C

Sample temp.:

25 °C

Injection volume:

10 µL

Flow rate:

0.2 mL/min

Mobile phase A:

H2O, 0.1% FA

Mobile phase B:

MeCN, 0.1% FA

Gradient Table

MS Conditions

MS system:

ACQUITY QDa Detector

Ionization mode:

Positive

Acquisition range:

100 m/z–600 m/z

Capillary voltage:

1.5 kV

Cone voltage:

15 V

PS-80 Methyl Ester

ACQUITY QDa SIR (m/z)

Methyl Myristate

243.4

Methyl Palmitate

271.45

Methyl Stearate

299.51

Methyl Oleate

297.5

Methyl Arachidate

327.6

Methyl Eicosenoate

325.5

Methyl Behenate

355.6

Methyl Lignocerate

383.7

PS-20 Methyl Ester

ACQUITY QDa SIR (m/z)

Methyl Caproate

131.18

Methyl Caprylate

159.24

Methyl Caprate

187.29

Methyl Laurate

215.14

Methyl Myristate

243.4

Methyl Palmitate

271.5

Methyl Stearate

299.5

Methyl Oleate

297.5

Methyl Linoleate

295.5

Data Management

Chromatography software:

Empower 3 FR4

Results and Discussion

Using our previous study’s method as a starting point, a new MS-based platform method was developed to determine conditions that were both sensitive and specific to target analytes, while being scalable and deployable in nature for broader applicability across an organization in the analysis and quantitation of PS-20 or PS-80.6 Chromatographic profile, hydrolysis efficiency, detector sensitivity, assay linearity, and extraction efficiency were considered as criterion in the development of the method with results discussed as follows.

Chromatographic Profile

Optimization of chromatography is often an iterative process where peaks of target analytes are evaluated under various conditions to ensure the target peaks are well-resolved from neighboring peaks to minimize co-elution and increase assay accuracy. For MS-based methods this is compounded by matrix effects which can reduce assay sensitivity through ion suppression and increase spectral complexity. With this knowledge, separation conditions were evaluated to determine if a single method could be used that is able to resolve the dominant fatty acid by composition (Table 1) for each polysorbate type with resolution of any co-eluting peaks. Using Table 1 as guidance, a panel of commercially available fatty acid methyl esters were prepared in neat solvents and optimized under gradient conditions with detection performed using the SIR functionality of the ACQUITY QDa Mass Detector to demonstrate proof-of-principle. Result of the optimized conditions are shown in Figure 3. As part of the optimization process it was determined that a column with a C8 (P/N: 186002877) stationary phase was necessary to provide sufficient retentivity of the fatty acids while maintaining good peak shape in terms of tailing for late eluting species. In addition, the increased retentivity of the C8 column allowed for conditions that were more efficient in terms of throughput. In this case, an 18-min gradient from 75% B to 100% B was determined to be sufficient in terms of resolving power with a modest throughput increase compared to existing HPLC-based ELSD or CAD methods. It should be noted that the total run time can be further optimized if desired as the panel of methylated fatty acids used represent a sub-set of possible analytes to monitor based on Table 1. More importantly, as shown in Figure 3, the dominant fatty acids associated with each polysorbate (blue trace) were well resolved from each other as well as neighboring peaks (orange trace) while allowing sufficient gradient space to accommodate internal standards (dotted trace) when using the optimized conditions. Given the favorable results observed, this gradient will serve as the basis of the platform method moving forward. 

Figure 3. Fatty acid chromatographic profile. Overlay of RPLC-MS chromatograms of methylated fatty acids commonly found in polysorbate acquired using an optimized reversed phase gradient with SIR detection performed with a ACQUITY QDa Mass Detector.

Hydrolysis Efficiency

Hydrolysis techniques are not uncommon in the analysis of polysorbate. While it is used more frequently in GC-MS based analyses to acquire profile composition information it can also provide quantitative information like intact mass analysis methods in the assessment of polysorbate concentration in drug products. Furthermore, hydrolysis techniques may be necessary when sample matrix or constituents interfere or increase MS spectral complexity at an intact level. In this case, hydrolysis of protein matrices to base amino acids occur in parallel during the hydrolysis step, thus reducing their potential to interfere in the analysis of polysorbate. To evaluate hydrolysis efficiency, a time study was performed over the course of 24-hours to determine optimum conditions to cleave >95% for quantitative purposes. Briefly, individual aliquots of a stock solution containing USP grade polysorbate (Sigma Aldrich P/N: 1547925-2G, CAS: 9005-64-5) underwent base hydrolysis in 0.5 M NaOH with increasing time intervals at 65 °C in an Eppendorf 5 mL Conical tube. Care was taken to seal the vial to minimize evaporative losses which could adversely impact results. Solutions were then acidified followed by liquid-liquid extraction using hexane to isolate the cleaved fatty acids, which were then separated using the optimized gradient under RPLC conditions. Peaks of interest were integrated, and peak area was plotted as function of time. As shown in Figure 4, using polysorbate 20 as an example, at least 15 hours was required to cleave >95% of the dominant fatty acid in either PS-20 (lauric acid) or PS-80 (oleic acid). This is in agreement with work performed by Hewitt et al. wherein they observed similar behavior in cleavage efficiencies in forced degradation studies of polysorbate.4 For this study, an 18-hr hydrolysis was determined to be an optimal hydrolysis time to accommodate a degree of variability while allowing for >95% hydrolysis of the fatty acid. It should be noted that faster hydrolysis times may be used for qualitative assessment of samples or as a diagnostic tool.

Figure 4. Hydrolysis efficiency. Results of a 24-hour time study of a base hydrolysis of polysorbate 20 in 0.500 M NaOH at 60 °C.

MS Sensitivity

As previously shown in our own work as well as literature, free fatty acids can be readily ionized for detection with mass spectrometers as an end-point detector.6 However as shown in Table 1, polysorbate composition can vary in the type of fatty acid as well as degree of saturation which can impact ionization efficiency. Given this, detection mode (negative vs. positive) as well as structure (methylated vs. non-methylated) was evaluated for the dominant fatty acid (lauric acid vs. oleic acid) of each polysorbate type during the optimization process. Not entirely unexpected, saturated fatty acids as in the case of lauric acid (PS-20) did not ionize as well as oleic acid (PS-80) with up to an order of magnitude in difference when comparing spectral intensity in both positive and negative mode (data not shown). Interestingly, while negative mode is often preferred in the analysis of free fatty acids to minimize water loss and improve detector response, the overall intensity profile did not show marked improvement when using negative mode in this particular study.2 This may be in part due to using a non-optimized method for negative mode acquisition. Given these observations, alternative methods to improve MS-response were evaluated. Recently, Ichihara et al. proposed an amenable methanolysis/methylation process that could be performed in 1-hour as a possible means to increase MS-response.7 Given the short reaction time relative to the hydrolysis requirements of the current method, a 1-hour methanolysis/methylation step following the hydrolysis was adapted from Ichihara and colleagues. Briefly, a methylation reagent was added to the sample vial following hydrolysis (methanol in the presence of 8% HCl) with attention paid to minimizing head space in the sample vial to reduce condensation effects. Results were evaluated in terms of minimizing in-source water loss and increasing detector response in positive MS mode. As shown in Figure 5, the methylated fatty acid (methyl laurate) was observed to increase 10-fold in MS-response compared to the non-methylated fatty acid (lauric acid) when using positive mode for detection. This is in part attributed to reduction of the in-source water loss, which was detected at significantly reduced levels in the methylated fatty acid (methylated <5% vs. non-methylated ≥50%) and increased proton affinity of carbonyl group relative to a carboxylic acid group in the gas-phase. Given the marked improvement in sensitivity observed with the methylated fatty acid and minimal sample preparation required, a 1-hour methylation step using methanol was added to the optimized method following the hydrolysis step.

Figure 5. MS-response. Overlay of RPLC-MS chromatograms of lauric acid and methyl laurate using a reversed phase gradient with SIR detection performed with a ACQUITY QDa Mass Detector. Samples were prepared at equivalent concentrations based on weight and normalized to methyl laurate.

Extraction Efficiency

In addition to increased MS-response, methylation of the free fatty acid reduces the need to introduce salt solutions to induce a phase separation during the liquid extraction step as proposed in our previous method. This in return simplifies the sample preparation and reduces introduction of extraneous salts that could otherwise suppress MS ionization efficiency and reduce overall assay sensitivity. A draw study was performed using a neat standard to determine extraction efficiency of the methylated fatty acid. Briefly, a stock solution of methyl laurate and methyl oleate were prepared at a low (50 ppm), medium (250 ppm), and high (500 ppm) concentration levels. Equal volume aliquots were spiked into a sample solution that accurately reflected the compositional profile of the sample matrix after methylation sans protein hydrolysis byproducts (amino acids). A 1.0 mL aliquot of hexane and H2O was then added to the sample, briefly vortexed to mix, and centrifuged to separate the bottom aqueous layer (salts/amino acids) and top organic (methylated fatty acid) layer for extraction using a 3 mL blunt-tip Hamilton syringe (1725 RNR, GA 22/51 mm/pst 3). Extracted samples were transferred to independent vials, dried down, and reconstituted in 75:25 MeCN:H2O. This process was repeated two additional times using the same spike-in sample. Using the RPLC-MS method, extractions were injected with blank injections performed in between to monitor carry-over. Chromatograms were integrated using the same processing method and total peak area across the extractions was used to determine recovery%. As shown in Figure 6, 99.2% of the methyl laurate (PS-20) spiked in at a high concentration level was recovered in the first extraction with the remaining methyl laurate extracted in the 2nd extraction step with no observable carry-over between injections. Similar extraction efficiencies were observed across concentrations for both methyl laurate and methyl oleate (data not shown).These results indicate the fatty acid methyl esters discreetly partition into the organic phase with high efficiency where only a portion or aliquot of the organic phase is needed for analysis, greatly simplifying the extraction process for the optimized method.

Figure 6. Extraction efficiency. Stack plot of RPLC-MS chromatograms of 3 extractions of methyl laurate spiked-in 75:25 MeCN:H2O. Recovery % was calculated based on total peak area across all three extractions.

Applicability

To demonstrate the applicability of the current study’s findings, two different drug products, one containing polysorbate 20 (sample 1) and one containing polysorbate 80 (sample 2) were analyzed for polysorbate concentration using the optimized method shown in Table 2. For quantitation purposes, a calibration curve was generated for each polysorbate type based on the hydrolysis products of the raw material as outlined in Table 2. This allows for direct quantitation of the polysorbate concentration of each sample for increased assay accuracy. In addition, as with the previous method internal standards purchased from Nu-Chek Prep, Inc. in the form of methyl tridecanoate (PS-20) and methyl cis-10-methyl nondecenoate (PS-80) were used to account for non-specific losses during sample preparation if present.

Table 2. Optimized sample preparation method. A 1-pot hydrolysis and methylation sample preparation procedure to methylate free fatty acids after base hydrolysis of either raw material or solutions containing polysorbate.

Briefly, six polysorbate solutions were prepared in LC-MS grade water at a concentration of 50 ppm, 100 ppm, 150 ppm, 200 ppm, 250 ppm, and 300 ppm using serial dilution of a 1000 ppm (wt/wt) stock solution of raw material polysorbate in LC-MS grade water. A 50 µL aliquot was transferred from the six solutions to a 5 mL Eppendorf conical tube containing 50 µL of the internal standard followed by 50 µL of 0.5 M NaOH. Care was taken to seal the conical tube with tape to minimize evaporative losses. After incubating at 65 °C for 18 hours, the reaction vessel was cooled to room temperature and acidified with 50 µL of 1.0 M HCl. Methanolysis/methylation was then performed with attention again placed on sealing the container following addition of the methylation reagents. After incubating at 100 °C for 1-hour the reaction vessel was cooled to room temperature where upon 1 mL of hexane and 1 mL of H2O were added to the reaction vessel. The reaction vessel was then vortexed and centrifuged to separate the organic and aqueous layers. A portion (0.5 mL) of the top organic layer was extracted and dried down using a vacuum centrifuge. Samples were then re-suspended in 0.50 mL of 75:25 MeCN:H2O. Samples were prepared in triplicate in the same manner using a 50 µL aliquot of sample 1 and sample 2. Internal standard controls were prepared in 75:25 MeCN:H2O at a concentration of 100 ppm using serial dilution of a stock solution of 1000 ppm wt/wt in LC-MS grade methanol.

As shown in Figure 7, after following the optimized protocol using the raw polysorbate material to generate a calibration curve, the polysorbate concentration in the drug substance samples could be directly determined for each sample. In this case, sample 1 was determined to contain 152±2 ppm of polysorbate 20, and sample 2 was determined to contain 242±6 ppm of polysorbate 80. The high degree of linearity in the calibration curves and minimal deviation in sample triplicates illustrates the consistency and fidelity of the ACQUITY QDa Mass Detector to detect subtle changes in analyte concentration. The sensitivity of the method is demonstrated in the fact that the samples and calibration curve were diluted by a factor of 20 from their initial concentration prior to detection based on the sample and extraction volume outlined in Table 2. In this context the data illustrates the value the ACQUITY QDa Mass Detector brings to the method in its ability to effectively detect the fatty acid methyl esters in a range approaching sub-ppm levels. An impressive feat considering the lower response factor for saturated fatty acids such lauric acid (PS-20). In a similar regard, the sample matrix volume can be readily adjusted to concentrate or further dilute samples providing the scalability needed to address sample concentration variability across labs. Collectively these results demonstrate the modified method can be broadly applied across an organization in the analysis and quantitation of polysorbate containing biopharmaceutical drug products.

Figure 7. Experimental results. Calibration plots of area response for serial dilutions of methyl laurate and methyl oleate using polysorbate 20 and polysorbate 80 raw material (blue data). Area results plotted for sample 1 (PS-20 containing) and sample 2 (PS-80 containing) with corresponding concentration determined from the calibration plot shown as orange data.

Conclusion

As stabilizing excipients, characterization, and monitoring of surfactants such as polysorbate 20 and polysorbate 80 is critical to ensure drug products are stable, safe, and effective. However, the variety of constituents found in polysorbate raw material combined with their varying physicochemical properties increases the challenges associated with developing platform-like methods that are specific and sensitive to target analytes. In this study, a viable MS-based hydrolysis method was demonstrated to be sensitive and specific and could be universally applied in the analysis of polysorbate 20 or polysorbate 80 containing samples. This method, which can be performed as a one-pot method reduces the need for sample handling and can be used for the direct measurement of polysorbate in biopharmaceutical drug products. The increased specificity and sensitivity afforded by the ACQUITY QDa Mass Detector enables detection of fatty acid components of interest for both polysorbate 20 and polysorbate 80 using RPLC gradients with modest throughput. Furthermore, the scalable nature of the method increases the flexibility to deploy across labs with samples that vary in polysorbate type and concentration range. Collectively, these results demonstrate the applicability and value of a platform-like hydrolysis method in the analysis of polysorbate 20 or polysorbate 80 containing samples in the development and manufacturing of biopharmaceuticals. 

Conflict of Interest Statement

Aude Smeets, Michel Gerodez, and Xavier Taillieu are employees of the GSK group of companies.

References

  1. Kerwin, B. Polysorbate 20 and 80 Used in the Formulation of Protein Biotherapeutics: Structure and Degradation Pathways. Journal of Pharmaceutical Sciences. 2007. 97(8):2924–2935.
  2. Honemann, M., Wendler, J. Graf, T., Bathke, A., Bell, C. Monitoring polysorbate hydrolysis in biopharmaceuticals using a QC-ready free fatty acid quantification method. Journal of Chromatography B. 2019 Mar; 1116 (2019) 1-8. 
  3. Labrenz, S. Ester Hydrolysis of Polysorbate 80 in mAb Drug Product: Evidence in Support of the Hypothesized Risk After the Observation of Visible Particulate in mAb Formulations. 2014 May. Journal of Pharmaceutical Sciences 103:2268–2277. 
  4. Hewitt, D., Zhang, T., Kao, T. Quantitation of polysorbate 20 in protein solutions using mixed-mode chromatography and evaporative light scattering detection. Journal of Chromatography A. 2008 Nov; 1215 (2008) 156–160. 
  5. Ilko, D., Braun, A., Germershaus,O., Meinel, L., Holzgrabe, U. Fatty acid composition analysis in polysorbate 80 with high performance liquid chromatography coupled to charged aerosol detection. European Journal of Pharmaceutics and Biopharmaceutics. 2014 Nov; 94 (2015) 569–574. 
  6. Birdsall, R., Yu, Y. An Efficient UV-Based Method for the Assessment of Oleic Acid Content in Biotheraputic Drug Products Containing Polysorbate-80. Waters Application Note 720006129EN. 2008 Feb.  
  7. Ichihara, K., Fukubayashi, Y. Preparation of fatty acid methyl esters for gas-liquid chromatography. Journal of Lipid Research. 2009 Sep.

Acknowledgements

Robert E. Birdsall, David Dao, Brooke M. Koshel,  Ying Qing Yu (Waters Corporation); Aude Smeets, Michel Gerodez, Xavier Taillieu (GlaxoSmithKline);

720007249, May 2021

Haut de la page Haut de la page