Impact of Mobile Phase pH on Reversed-Phase Column Selectivity for LC-MS Peptide Separations
Abstract
For peptide separations, selectivity can be changed by altering mobile phase pH. In this application note, we show the selectivity differences when separating peptide standards and selected NISTmAb™ critical quality attribute (CQA) tryptic peptides on an XBridge™ Premier Peptide BEH™ C18 130 Å Column and an XSelect™ Premier Peptide CSH™ C18 Column, using mobile phase pH ranging from 2.7 to 9.2. Extracted Ion Chromatograms (XIC) obtained from BioAccord™ LC-MS System and waters_connect™ show distinct selectivity difference between selected peptides and their deamidated forms.
Benefits
- Mobile phase pH can change selectivity of reversed-phase peptide separations, helping to separate difficult critical pairs
Introduction
It has been shown that pH of the mobile phase can alter the selectivity of reversed-phase separation. High degree of orthogonality was achieved when varying the pH of the peptide separation.1 In this application note, the selectivity difference is shown in separating a peptide standard mixture as well as a mAb tryptic digest sample under mobile phase pH of 2.7, 3.1, 3.8, 5.5, 6.5, and 9.2. As an example, separation of a tryptic peptide and its deamidated forms is shown in Extracted Ion Chromatograms (XIC) obtained from BioAccord LC-MS System and waters_connect. The selectivity is drastically different under various mobile phase pH separation, which indicates altering mobile phase pH could be beneficial in separating difficult critical pairs.
Experimental
LC Conditions
|
LC system: |
ACQUITY™ UPLC I-Class PLUS (Total system bandspread 5σ≤7 µL) |
|
Detection: |
ACQUITY BioAccord MS detection, TUV @ 214 nm |
|
Column(s): |
XBridge Premier Peptide BEH C18 130 Å, 2.5 µm, 2.1 x 150 mm Column (p/n: 186009835) XSelect Premier Peptide CSH C18 130 Å, 2.5 µm, 2.1 x 150 mm Column (p/n: 186009906) |
|
Column temperature: |
60 °C |
|
Sample temperature: |
10 °C |
|
Injection volume: |
15 µL, 10 µL |
|
Flow rate: |
0.2 mL/min |
Mobiles phases
A: 0.1% Formic acid in H2O (pH 2.7)
B: 0.1% Formic acid in Acetonitrile
A: 0.1% Formic acid, 10 mM Ammonium Formate in H2O (pH 3.1)
B: 0.1% Formic acid, 10 mM Ammonium Formate in 80% Acetonitrile
A: 10 mM Ammonium Formate in H2O (pH 3.8)
B: 10 mM Ammonium Formate in 80% Acetonitrile
A: 10 mM Ammonium Acetate in H2O (pH 5.5)
B: 10 mM Ammonium Acetate in 80% Acetonitrile
A: 10 mM Ammonium Acetate in H2O (pH 6.5)
B: 10 mM Ammonium Acetate in 80% Acetonitrile
A: 10 mM Ammonium Formate in H2O (pH 9.2)
B: 10 mM Ammonium Formate in 80% Acetonitrile
Gradient Table for MassPREP Peptide Mixture, mobile phase pH 2.7*
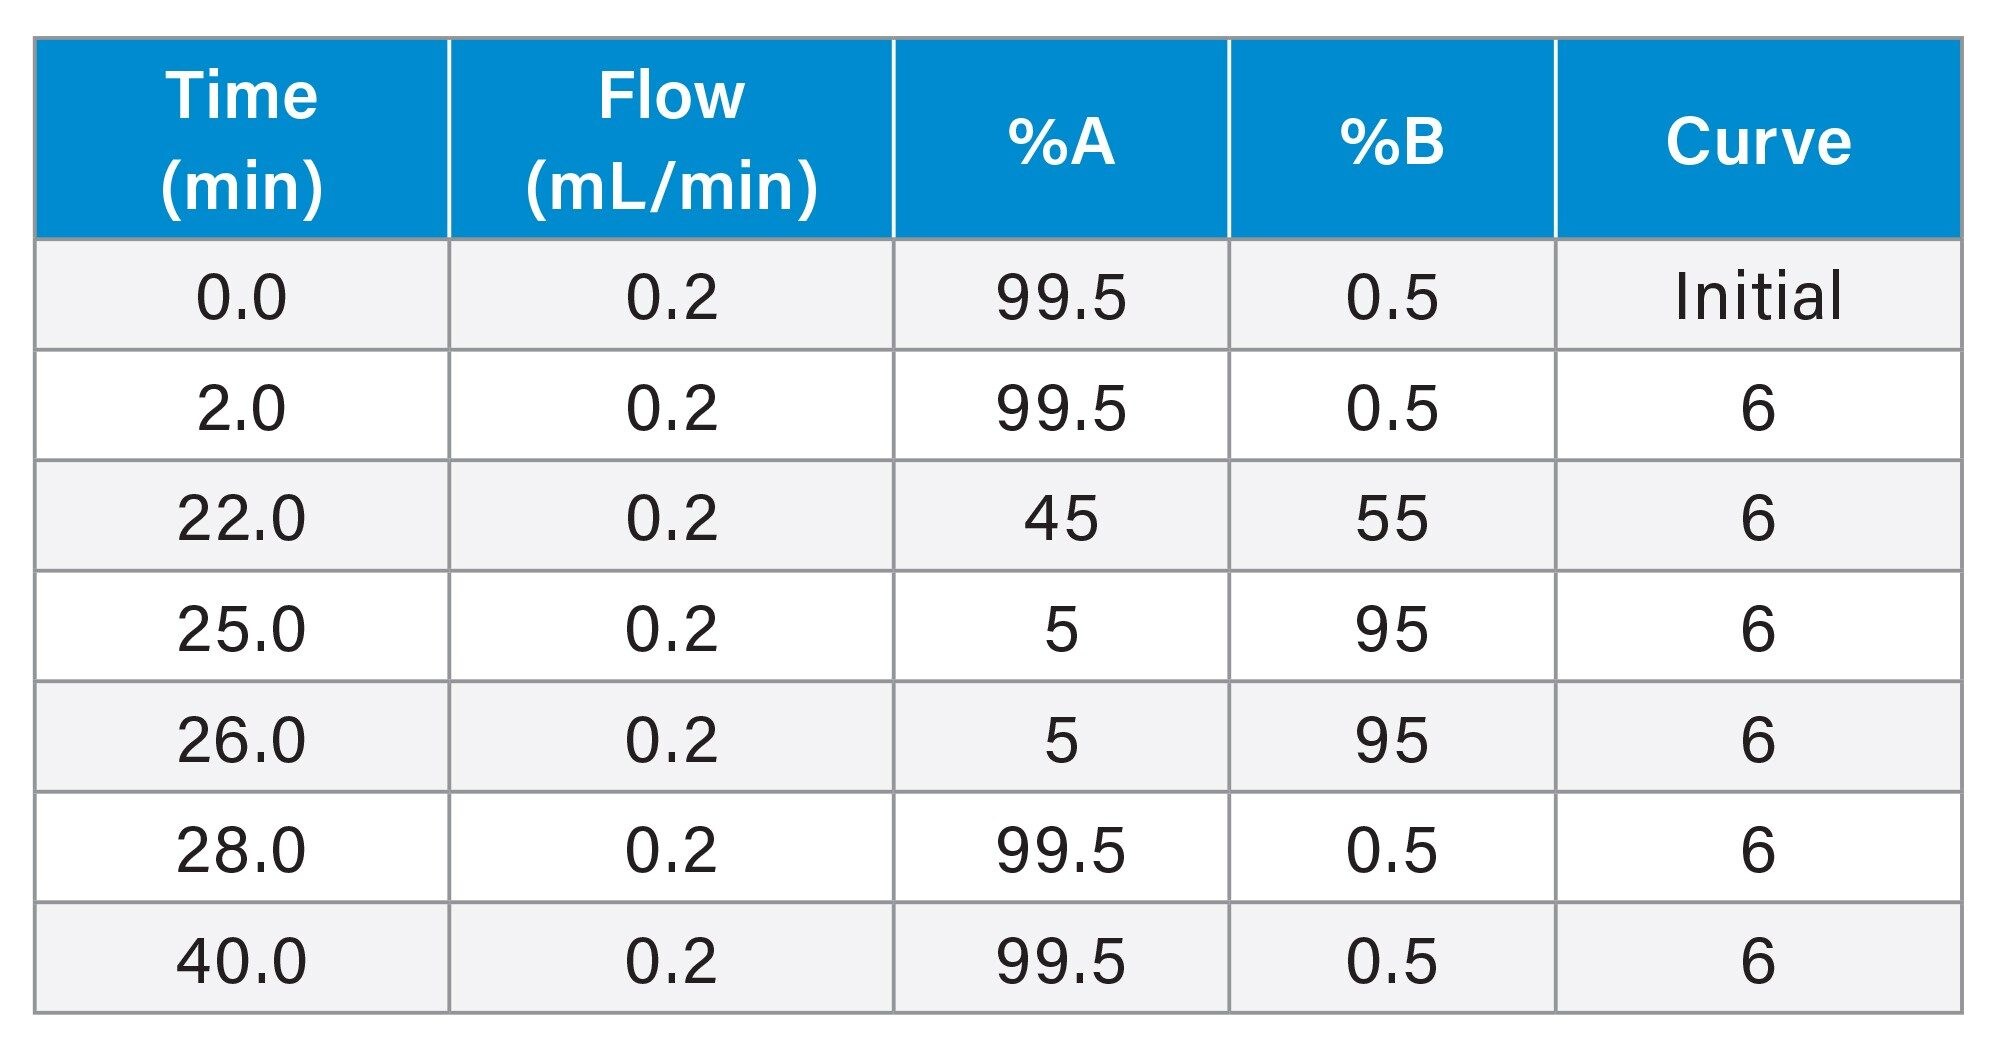 *: For mobile phase pH 3.1 to pH 9.2, the gradient goes from 0.6% B to 68.8% B due to 80% ACN in mobile phase B.
Gradient Table for mAb Tryptic Digestion Standard, mobile phase pH 2.7**
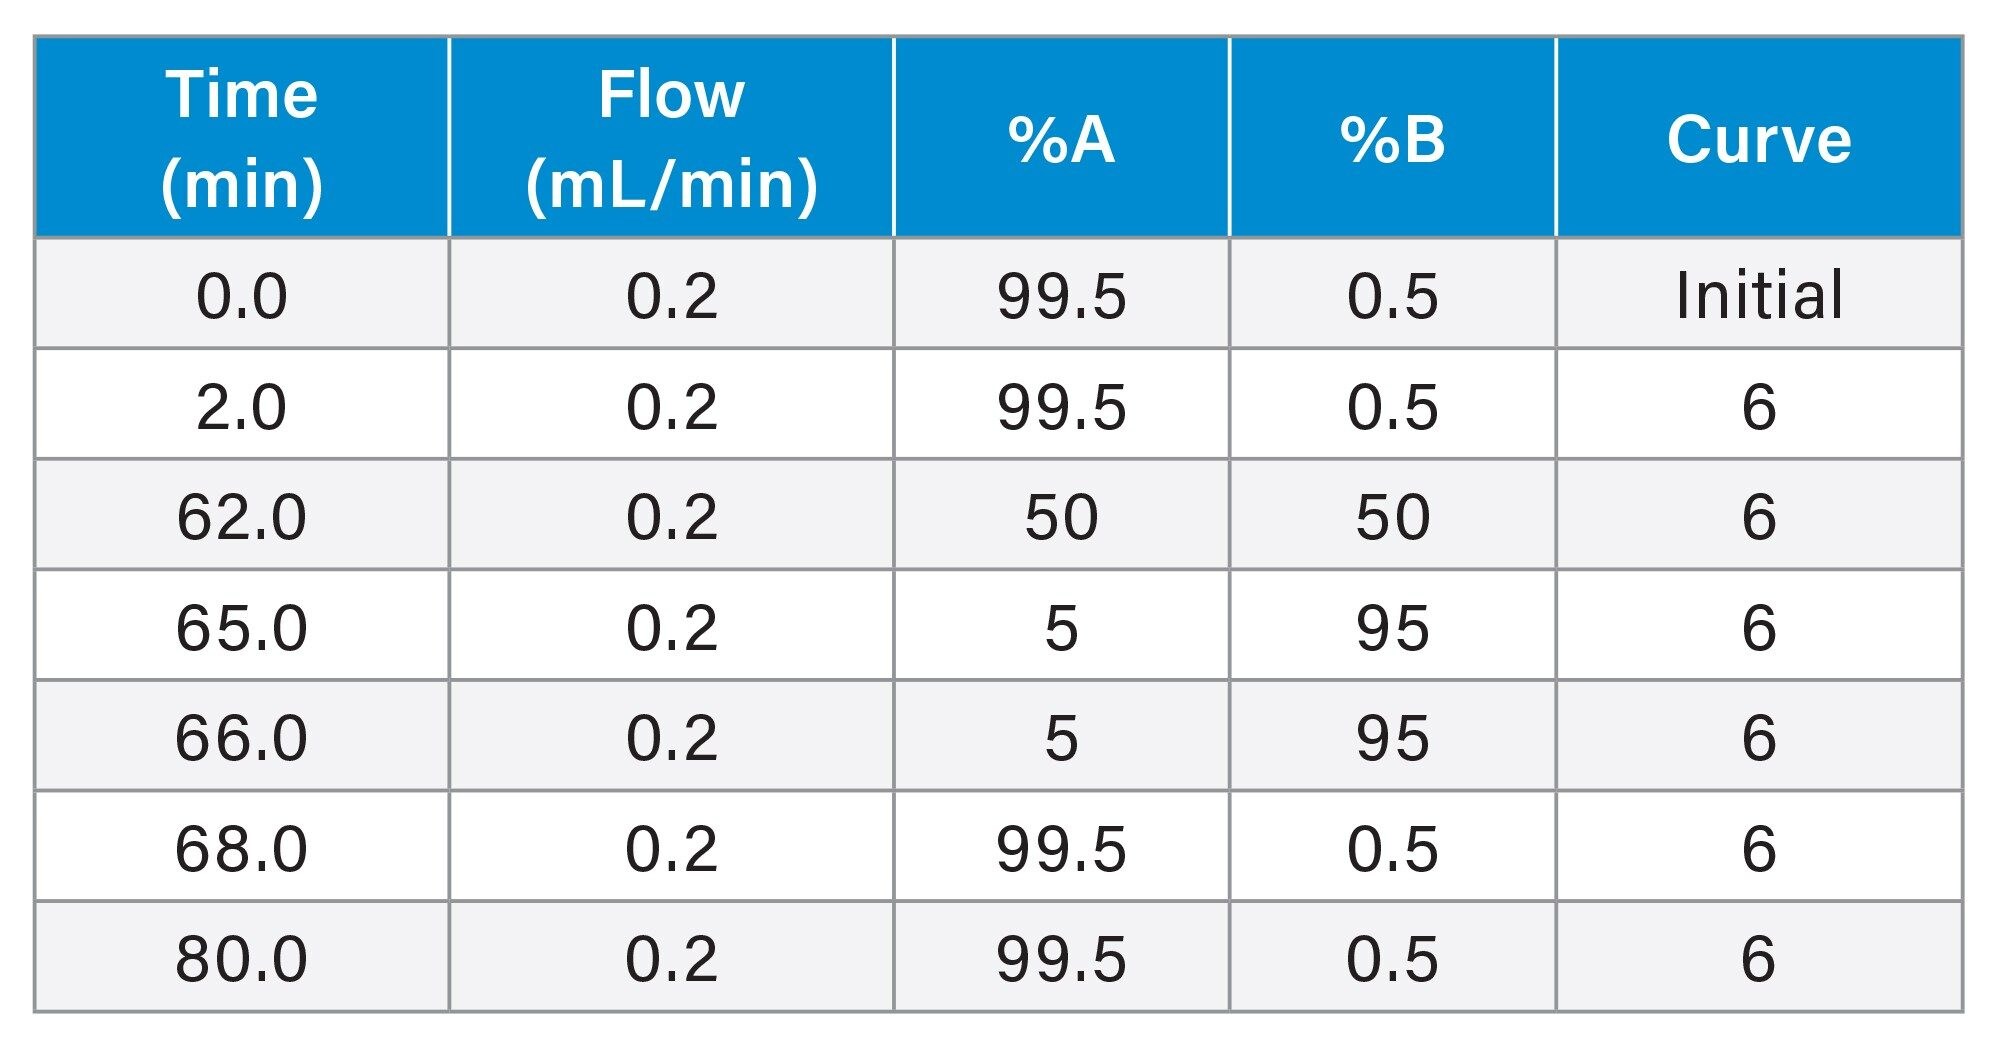 **: For mobile phase pH 3.1 to pH 9.2, the gradient goes from 0.6% B to 62.5% B due to 80% ACN in mobile phase B.
ACQUITY RDa Detector Settings
|
Mode: |
Full scan with fragmentation |
|
Mass range: |
50–2000 m/z |
|
Polarity: |
Positive |
|
Sample rate: |
5 Hz |
|
Cone voltage: |
30 V |
|
Fragmentation cone voltage: |
60 V–120 V |
|
Capillary voltage: |
1.20 kV |
|
Desolvation temperature: |
350 °C |
Data Management
|
LC/MS software: |
waters_connect |
Results and Discussion
UV traces of a MassPrep Peptide Standard Mixture separation (Table 1: Components) under various mobile phase pH on two Premier Peptide C18 columns are shown in Figure 1. The peaks were identified based on their mass obtained from BioAccord RDa Mass Detector and waters_connect. While selectivity is somewhat different on the two columns used, the more significant difference in selectivity is observed due to altering mobile phase pH. It is worth noting that at pH >5.5, the recovery of peaks 9 (enolase T37) and 10 (melittin) decreased. Although the reason was not studied, it is suspected that the solubility of the large and low pI enolase T37 peptide was reduced, and the ionic retention was increased for the large and high pI (>12) melittin peptide in the higher pH mobile phases. Nonetheless, caution should be used when separating large peptides under more basic conditions. In addition, method reproducibility should be carefully assessed when using high pH mobile phases as small changes in mobile phase pH can alter selectivity significantly.
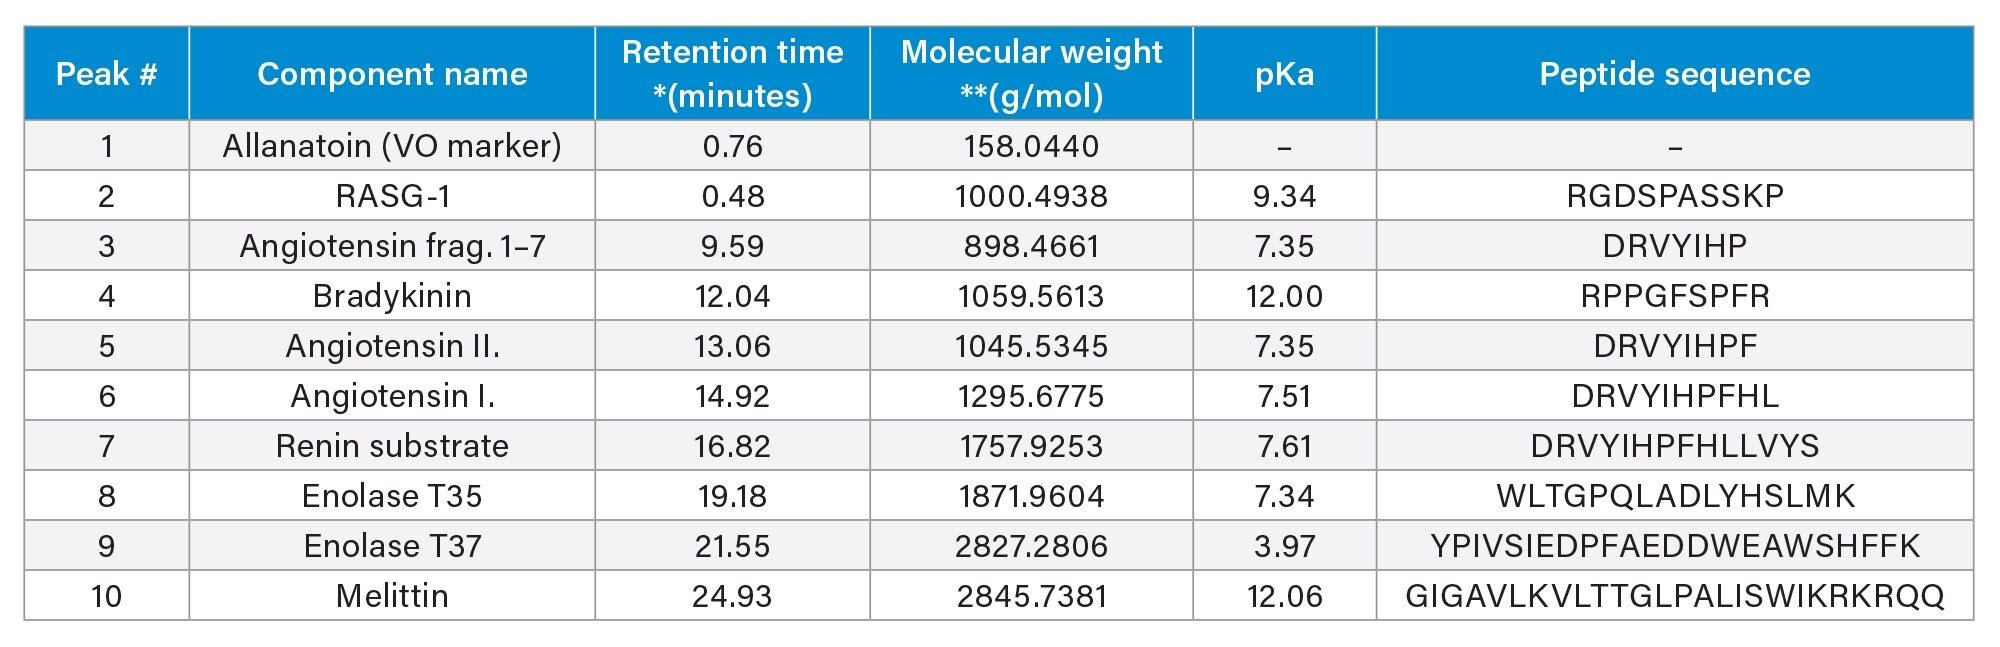 Table 1. A list of peptides (MassPREP Peptide Mixture, p/n: 186002338) that are separated under various pH conditions using a gradient of increasing acetonitrile concentration (please see Figure 1).
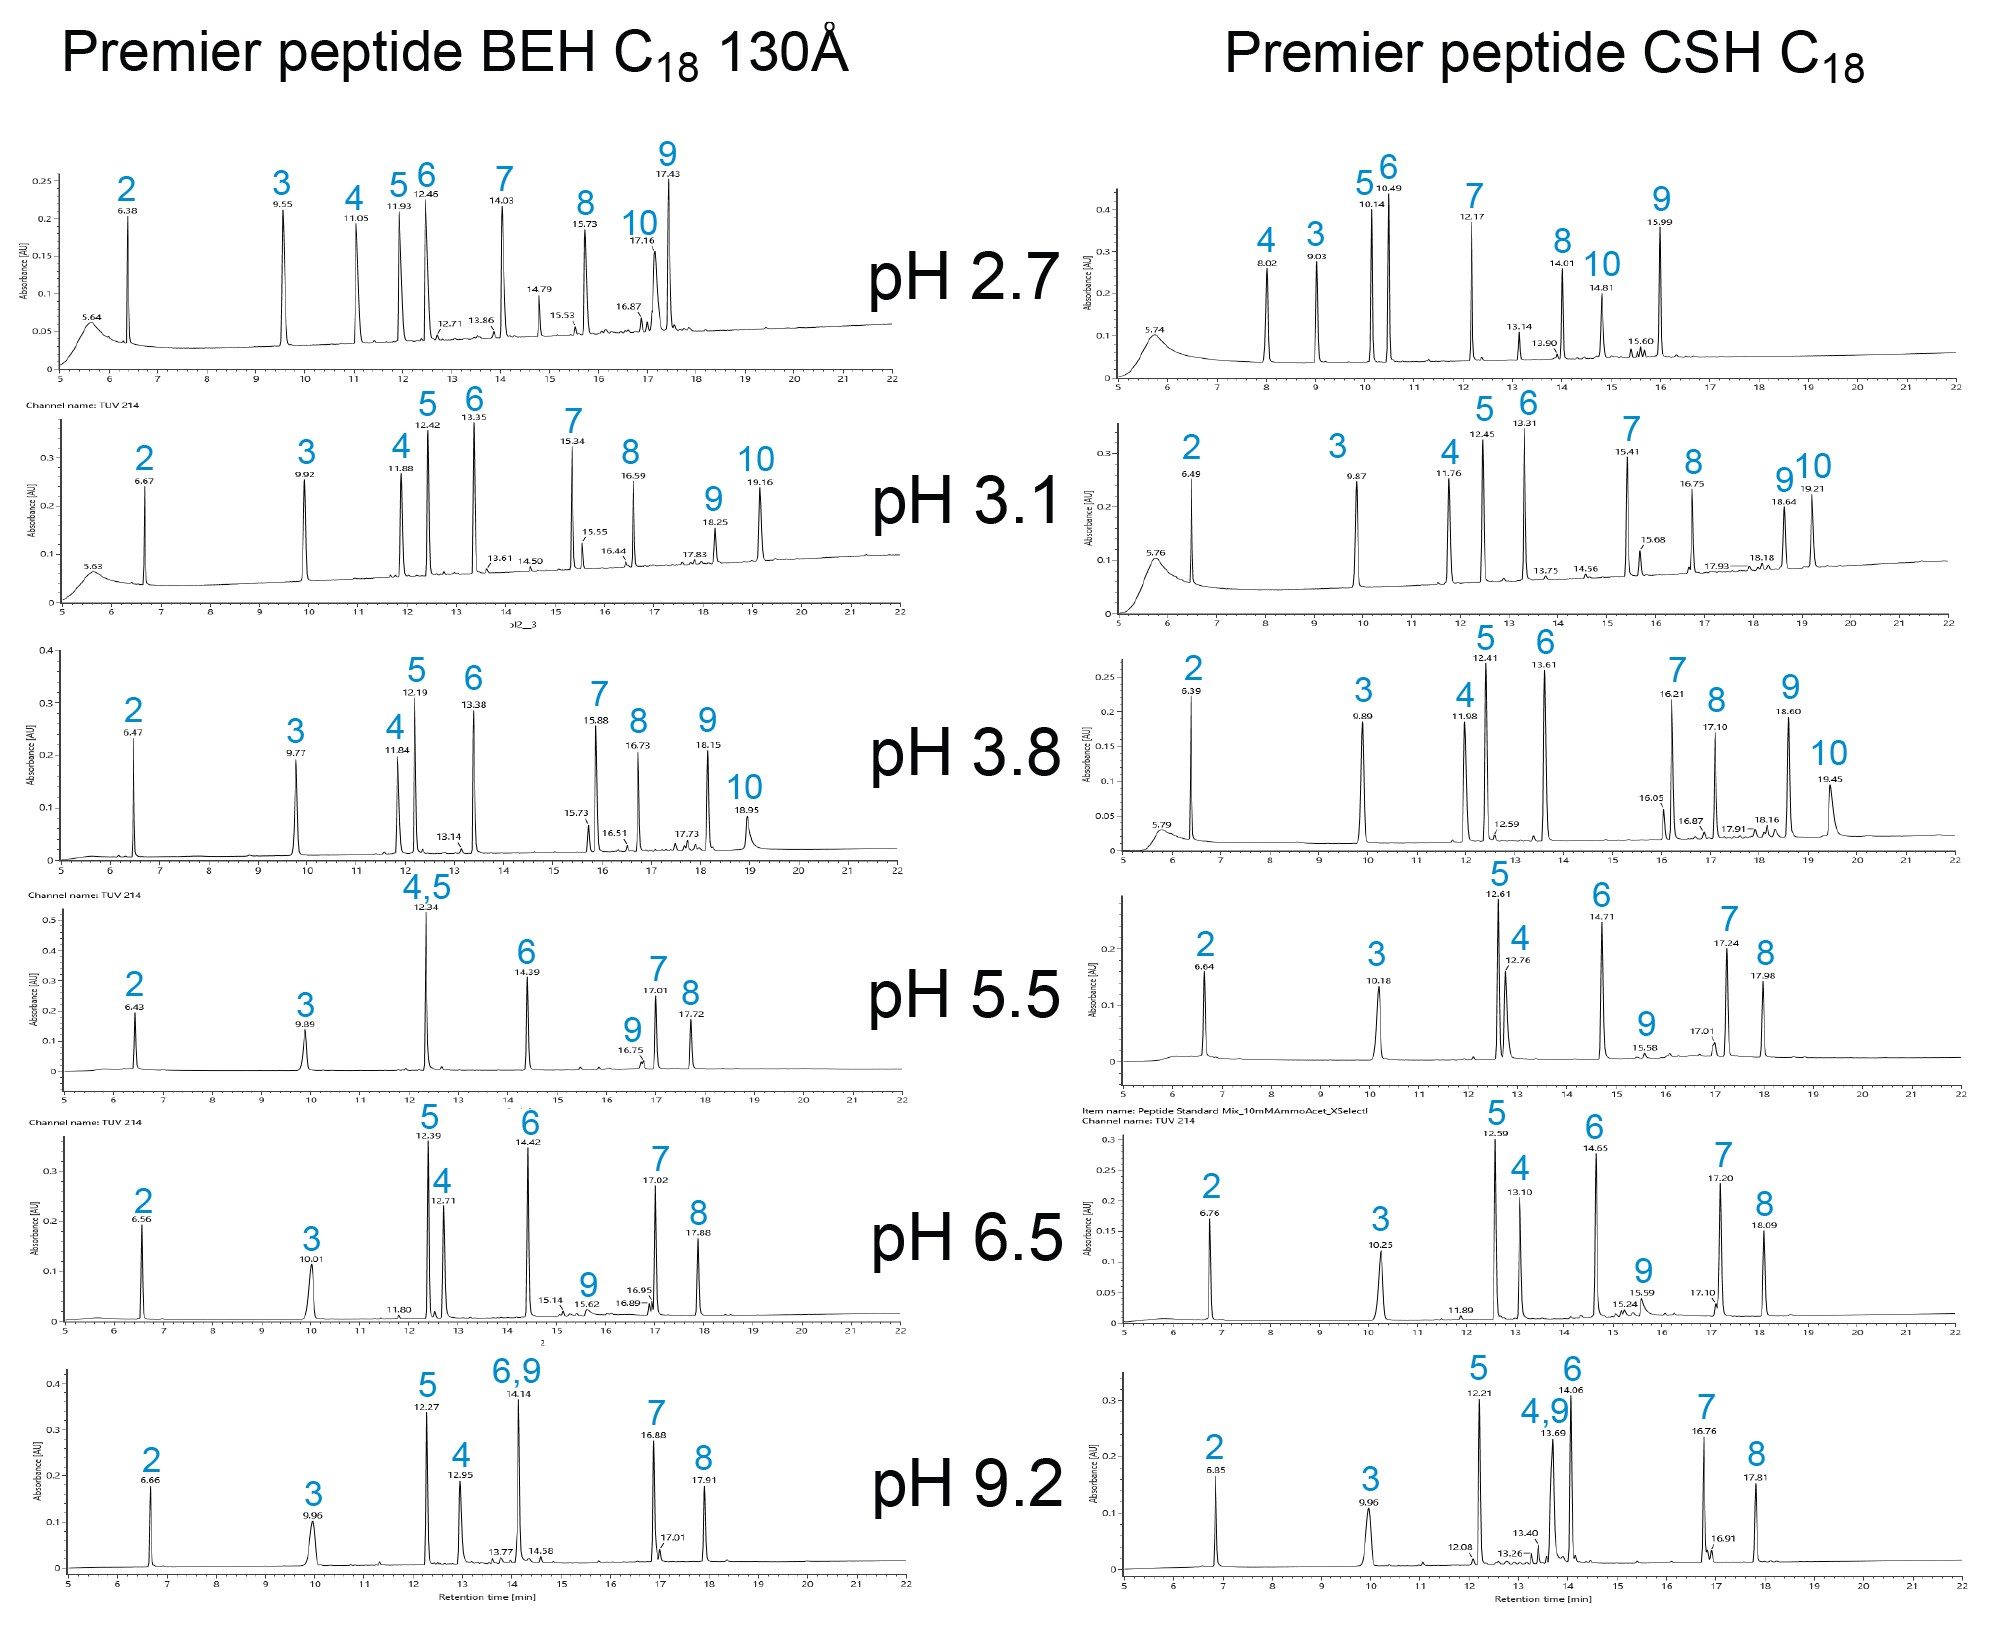 Figure 1. UV traces of a peptide standard mixture separation under various mobile phase pH on two Premier Peptide C18 columns: XBridge Premier Peptide BEH C18 130 Å, 2.5 µm, 2.1 x 150 mm Column (p/n: 186009835) and XSelect Premier Peptide CSH C18 130 Å, 2.5 µm, 2.1 x 150 mm Column (p/n: 186009906) using a gradient of increasing acetonitrile concentration.
Figure 2a shows the Base Peak Intensity (BPI) of NISTmAb tryptic digest separation on the XBridge Premier Peptide BEH C18 130 Å Column under various mobile phase pH using a gradient of increasing acetonitrile concentration. Arrows with the same color represent the same tryptic peptide identified by waters_connect. Heavy chain T37 peptide (GFYPSDIAVEWESNGQPENNYK) is highlighted in red. Figure 2b shows the Extracted Ion Chromatograms (XIC) of heavy chain T37 peptide and its deamidated forms. The selectivity is drastically different under different mobile phase pH conditions. Figure 2c shows correlation plots of retention time of 42 peptides under various pH verses the retention time of these peptides under pH 2.7. The correlation (R2) decreases as the mobile phase pH increases. This shows that higher pH conditions exhibit higher orthogonality (lower R2) to the low pH condition (pH 2.7), consistent with previous reports.1 Based on the ten most intense peptide ions, the average response for pH 9.2 ammonium formate was approximately one-third of that observed for 0.1% formic acid (pH 2.7).
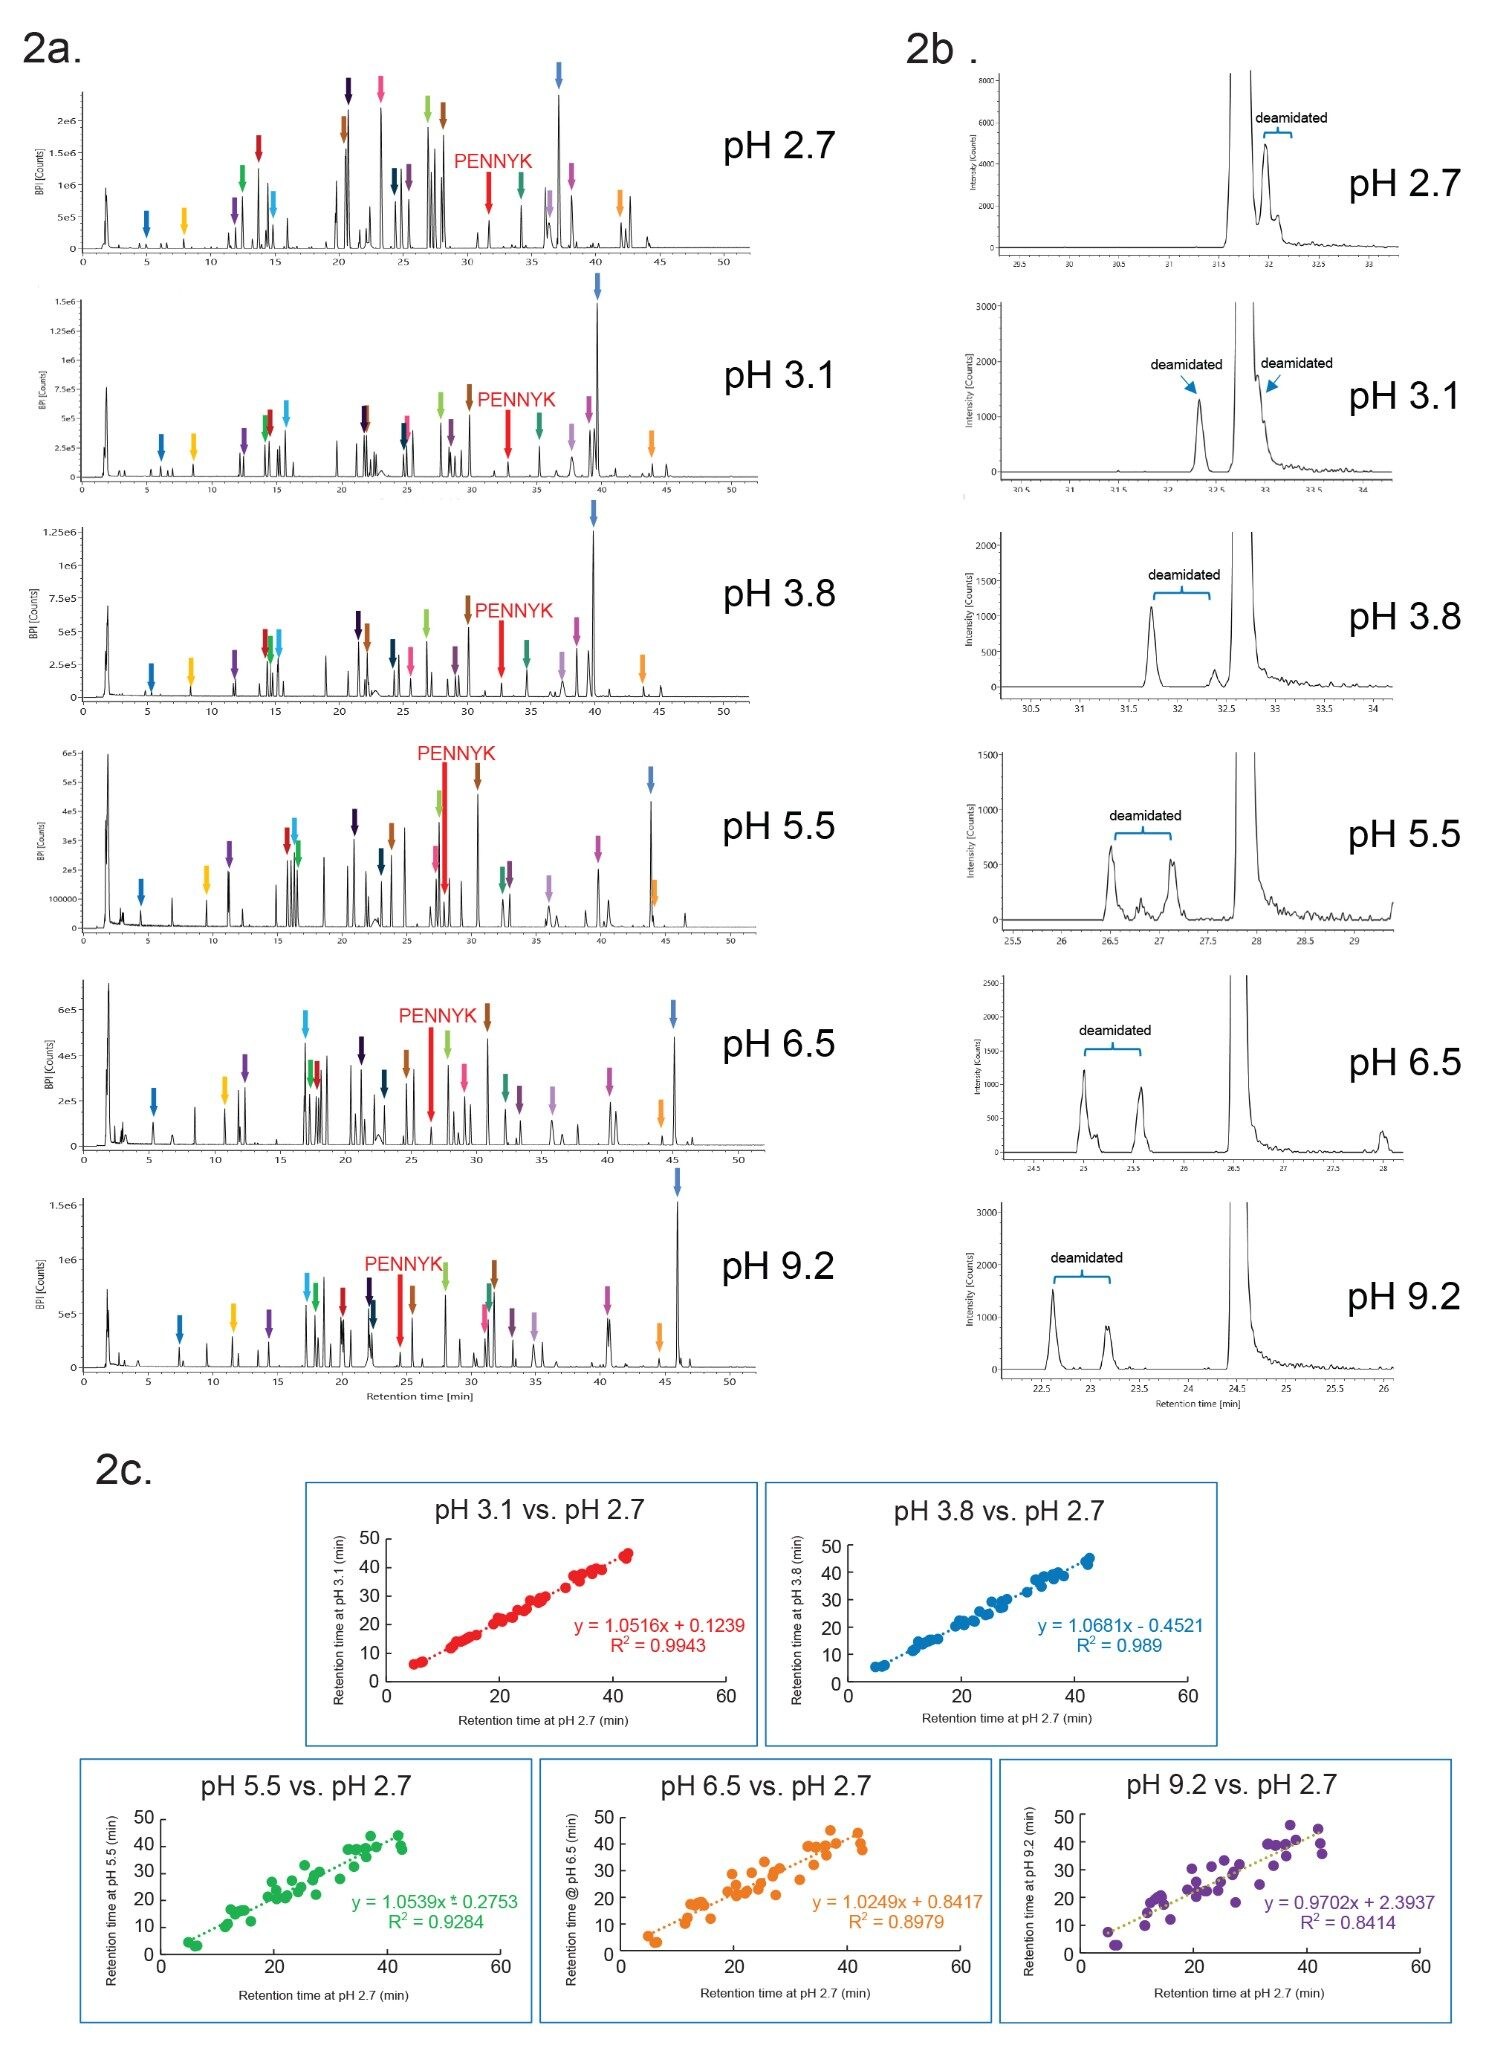 Figure 2. Separation of NISTmAb tryptic peptides on an XBridge Premier Peptide BEH C18 130 Å 2.5 µm 2.1 x 150 mm Column under various mobile phases pH. a. Base Peak Intensity (BPI) chromatograms obtained from a BioAccord LC-MS System. Arrows with the same color represent the same peptide identified by waters_connect. HC T37 peptide (GFYPSDIAVEWESNGQPENNYK) is highlighted in red. b. Extracted Ion Chromatograms (XIC) of HC T37 peptide and its deamidated forms under various mobile phase pH. c. Correlation of retention time under various mobile phase pH.
Conclusion
Reversed-phase separations of peptide standard mixtures and mAb tryptic digest samples were performed on two Premier Peptide C18 columns under various mobile phase pH ranging from pH 2.7 to pH 9.2. Significant differences in selectivity were observed using different mobile phase pH using a gradient of increasing acetonitrile concentration, which can be helpful in method development in separating difficult peptide critical pairs. Generally, a low pH formic acid (e.g., 0.1% FA for MS Detection) or trifluoroacetic acid (e.g., 0.1% TFA for Optical Detection) reversed-phase eluent additive will be used for routine synthetic peptide and peptide mapping separations. However and as shown, deploying a high pH separation as part of a heightened characterization comparability study can be beneficial because the different peptide separation selectivity obtained (i.e. orthogonality) provides a more thorough assessment. In addition, due to the high pH stability of the hybrid-silica based BEH and CSH peptide columns, low and high pH methods can be run on the same column within the same sample set.
References
- Gilar M., Olivova P., Daly A.E., Gebler J.C. Development of Orthogonal Separation Methods for 2D-HPLC (MS/MS) Analysis of Peptides. Waters Poster, 2005.
720008017, August 2023