Online AEX-MS Analysis of Biotherapeutic Charge Variants Using a BioAccord™ LC-MS System
Abstract
Characterization and monitoring of biotherapeutic charge variants is critical in ensuring product consistency and stability. Charge variants (CVs) are typically analysed using preparative ion exchange chromatography (IEX), followed by subsequent fractionation and reverse-phased liquid chromatography and mass spectrometry (LC-MS) analysis. This is a lengthy, technically challenging, and time-consuming process. Therefore, the development of an online charge variant analysis method is highly desirable. Whilst hyphenating anion exchange chromatography to native mass spectrometry (AEX-MS) to study anionic proteins has been studied, methods developed to study biotherapeutics have been limited. In this study, we present a robust and reproducible anion exchange mass spectrometry (AEX-MS) method for charge variant analysis using the BioAccord™ LC-MS System equipped with ACQUITY™ Premier UPLC™. Using this method, charged species were chromatographically separated and subsequently qualified and quantified using the waters_connect™ INTACT Mass application. The developed workflow for AEX-MS analysis of in-process samples is fast and can easily be incorporated at laboratories with limited or no prior LC-MS knowledge or hands on experience.
Benefits
- On-line analysis via AEX-MS removes the need for time consuming traditional fractionization methods
- The workflows presented here can be easily adapted for fast analysis by non-MS experts
Introduction
Biotherapeutics are typically large, complex molecules that contain numerous microheterogeneities and are subject to a range of degradation pathways. These include post-translational modifications (PTMs), that commonly result in charge variants (CVs) of the biotherapeutic. These variants are considered critical quality attributes (CQAs), due to their potential impact on drug potency and efficacy. Thus, it is important to accurately and rapidly monitor the CVs throughout process development and drug product manufacturing-
Ion exchange chromatography (IEX) is typically the method of choice in charge variant analysis. In these methods, solute molecules are reversibly adsorbed onto an oppositely charged resin. Retention of the charged variants is dependent on the interaction between each variant and the chromatographic resin, relative to the other species present. Resins are either negatively charged and exchange positive ions in cation exchange chromatography (CEX) or are positively charged and exchange negatively charged ions in anion exchange chromatography (AEX). Elution is supported either using a salt or pH gradient, though salt buffers are more commonly used due to difficulties in the reproducibility and controllability associated with pH gradients.
Mass spectrometry (MS) has provided critical insights into understanding the biochemical root cause of biotherapeutic charge heterogeneity. Typically, offline fractionation by IEX, followed by buffer exchange and subsequent LC-MS analysis has proved an effective approach in elucidating the nature of each charge variant. However, the process is slow, low throughput and susceptible to artifact formation. Hyphenating IEX directly to MS presents a far simpler and higher throughput method of charge variant identification. However, this method also presents several issues. IEX separations typically use non-volatile salts in mobile phases, which are considered incompatible with mass spectrometry. For direct IEX-MS analysis, volatile salts must be used, which have a lower buffering capacity and therefore may provide lower quality chromatographic separation. Additionally, the use of these buffers often results in low signal intensities compared to denaturing solvents that are typically used in MS analysis, making qualification of lesser abundant species challenging. Despite these challenges, native mass spectrometry provides unique insights into the structure of a protein, such as the ability to differentiate structural isoforms based on charge distribution.
Recently, on-line CEX-MS analysis has been used to qualify monoclonal antibody (mAb) charge variants using the BioAccord LC-MS System. Whilst the majority of marketed therapeutic mAb’s have basic isoelectric points (pI’s), there is a rapidly expanding market for biotherapeutics with lower pI’s, making them more suitable for analysis using anion exchange.
This application note further highlights the applicability of the BioAccord LC-MS System for biotherapeutic characterization and presents a simple, higher-throughput method for online AEX-MS analysis for charge variant identification.
Experimental
Sample information
Biopharmaceutic A was formulated at a concentration of ~0.2 mg/mL in pharmaceutically relevant buffers. Samples were filtered using 0.22 µm spin filters and directly transferred to HPLC vials. All samples have been stored in injection rack pre-cooled to +5°C until assay run.
LC Conditions
|
LC system: |
ACQUITY Premier UPLC System |
|
Detection: |
ACQUITY UPLC TUV Detector (with Titanium Flow Cell, 5mm): 280 nm (UV); and Fluorescence Detector: excitation: 295 nm, emission: 348nm |
|
Column: |
YMC QF00S05-1046WP Analytical Column (4.6x100 mm) |
|
Column temperature: |
25 °C (Also 20, 30, and 35 °C in optimisation) |
|
Sample temperature: |
5 °C |
|
Injection: |
5 µL (~0.4 µg) |
|
Flow rate: |
0.2 mL/ minute |
|
Mobile phase A: |
50 mM Ammonium acetate, pH 8.5 |
|
Mobile phase B: |
10 mM Acetic acid, pH 2.7 |
MS Condition
|
MS system: |
BioAccord LC-MS System |
|
Mode: |
Full scan |
|
Polarity: |
Positive |
|
Cone voltage: |
150 V (also 100, 110, 120, 130, 140, and 160 in optimisations) |
|
Mass range: |
High (m/z 400–7000) |
|
Scan rate: |
2 Hz |
|
Capillary voltage: |
1.50 kV |
|
Desolvation temperature: |
550 °C |
Results and Discussion
Liquid chromatography
The assessment of the anion exchange method started with determining the optimum column temperature for analysis. The LC parameters used here are shown in Table 1 as gradient A, which remained the same between runs. The impact of four different column temperatures of 20, 25, 30, and 35 °C on chromatographic peak separation was assessed.
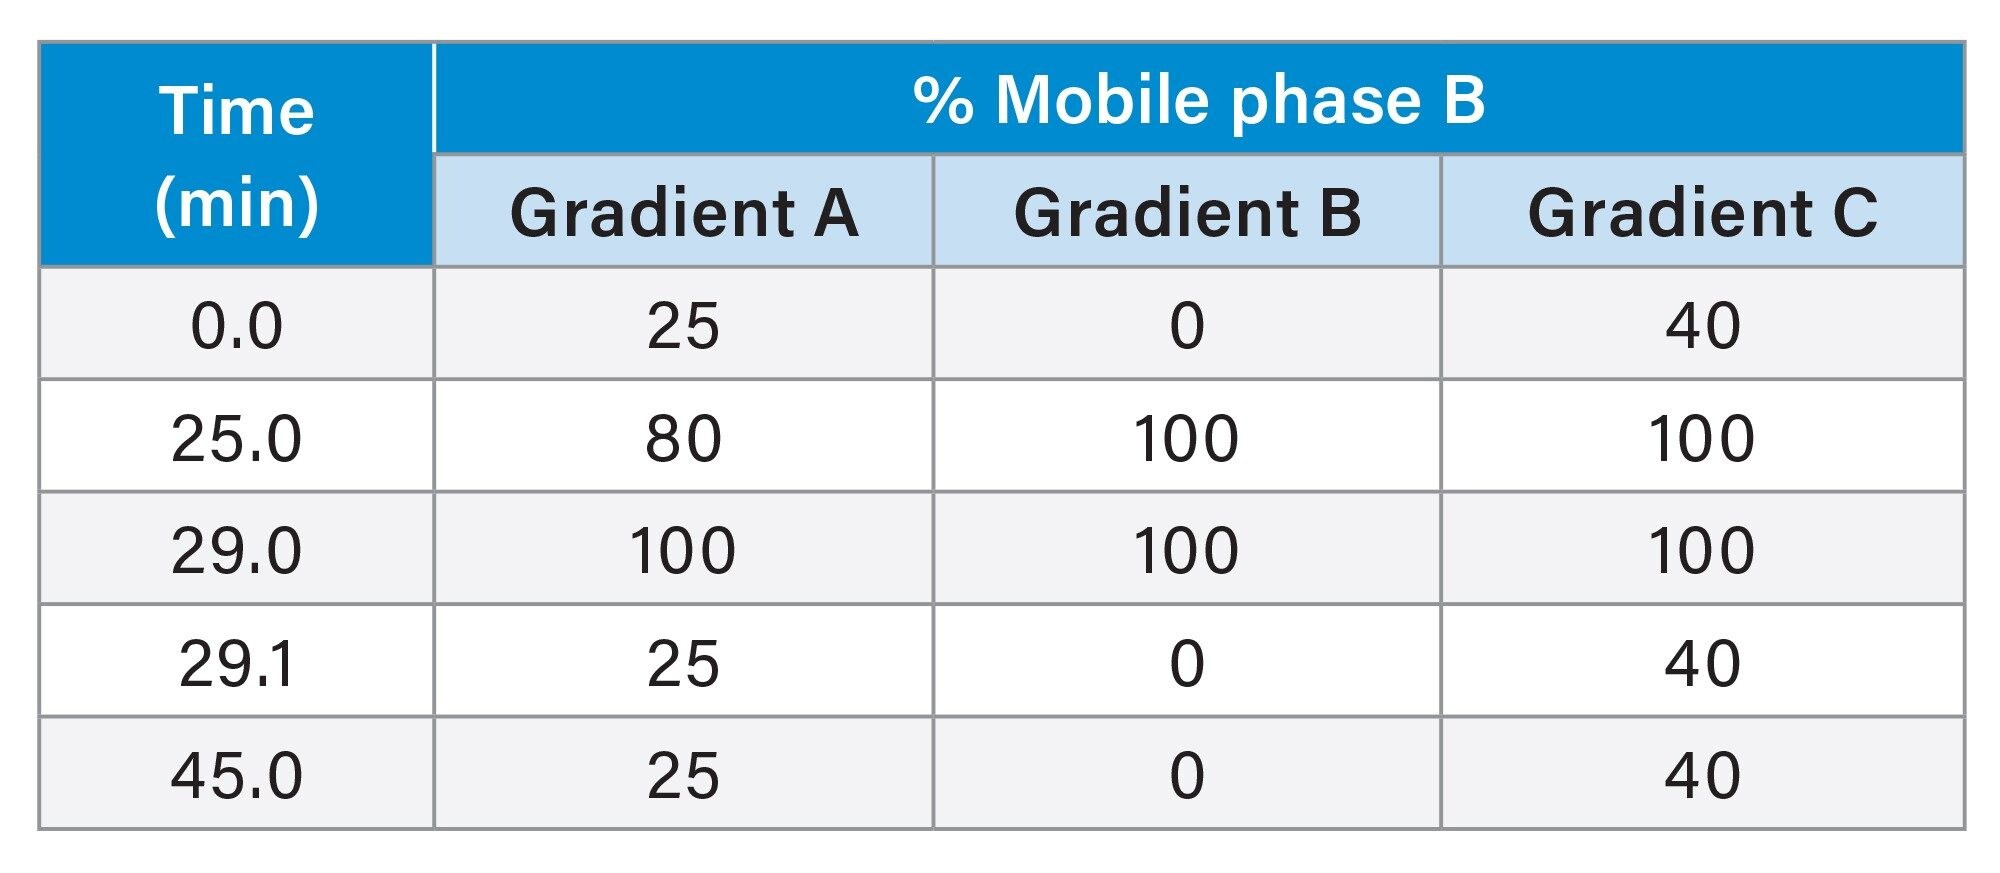 Table. Mobile phase gradients used for LC chromatography optimisation.
Figure 1 shows the AEX fluorescence chromatogram for Biotherapeutic A analysed at each of these conditions. At 20 °C six chromatographic peaks could be readily differentiated. At 25 °C, the same six peaks were noted with comparable chromatographic quality. In contrast at 30 °C, peak 2 is less well resolved and peak 6 could not be distinguished. This trend continues at 35 °C where the baseline between peak 1 and peak 3 is significantly raised, such that peak 2 is no longer visible. These data suggest column temperatures of 20 or 25 °C is appropriate for this method. Subsequently, three different chromatographic gradients were assessed. These are summarised as gradients A, B and C in Table 1.
 Figure 1. AEX fluorescence chromatograms for Biotherapeutic A analysed at a) 20°C, b) 25°C, c) 30°C and d) 35 °C using gradient A. Inserts within each figure show zoomed in regions of the chromatograms.
Figure 2 shows the AEX fluorescence chromatogram for Biotherapeutic A analysed via AEX using each of gradients A, B, and C as described in Table 1. Gradient A presented high chromatographic resolution, with several peaks, representing acidic variants, distinguished to the right-hand side of the main elution peak. Gradient B also offers good resolution, but there is a slight reduction in the quality compared to when using gradient A. In contrast, gradient C showed poor resolution with fewer peaks distinguished. The results show that gradients can easily be adjusted for specific molecules.
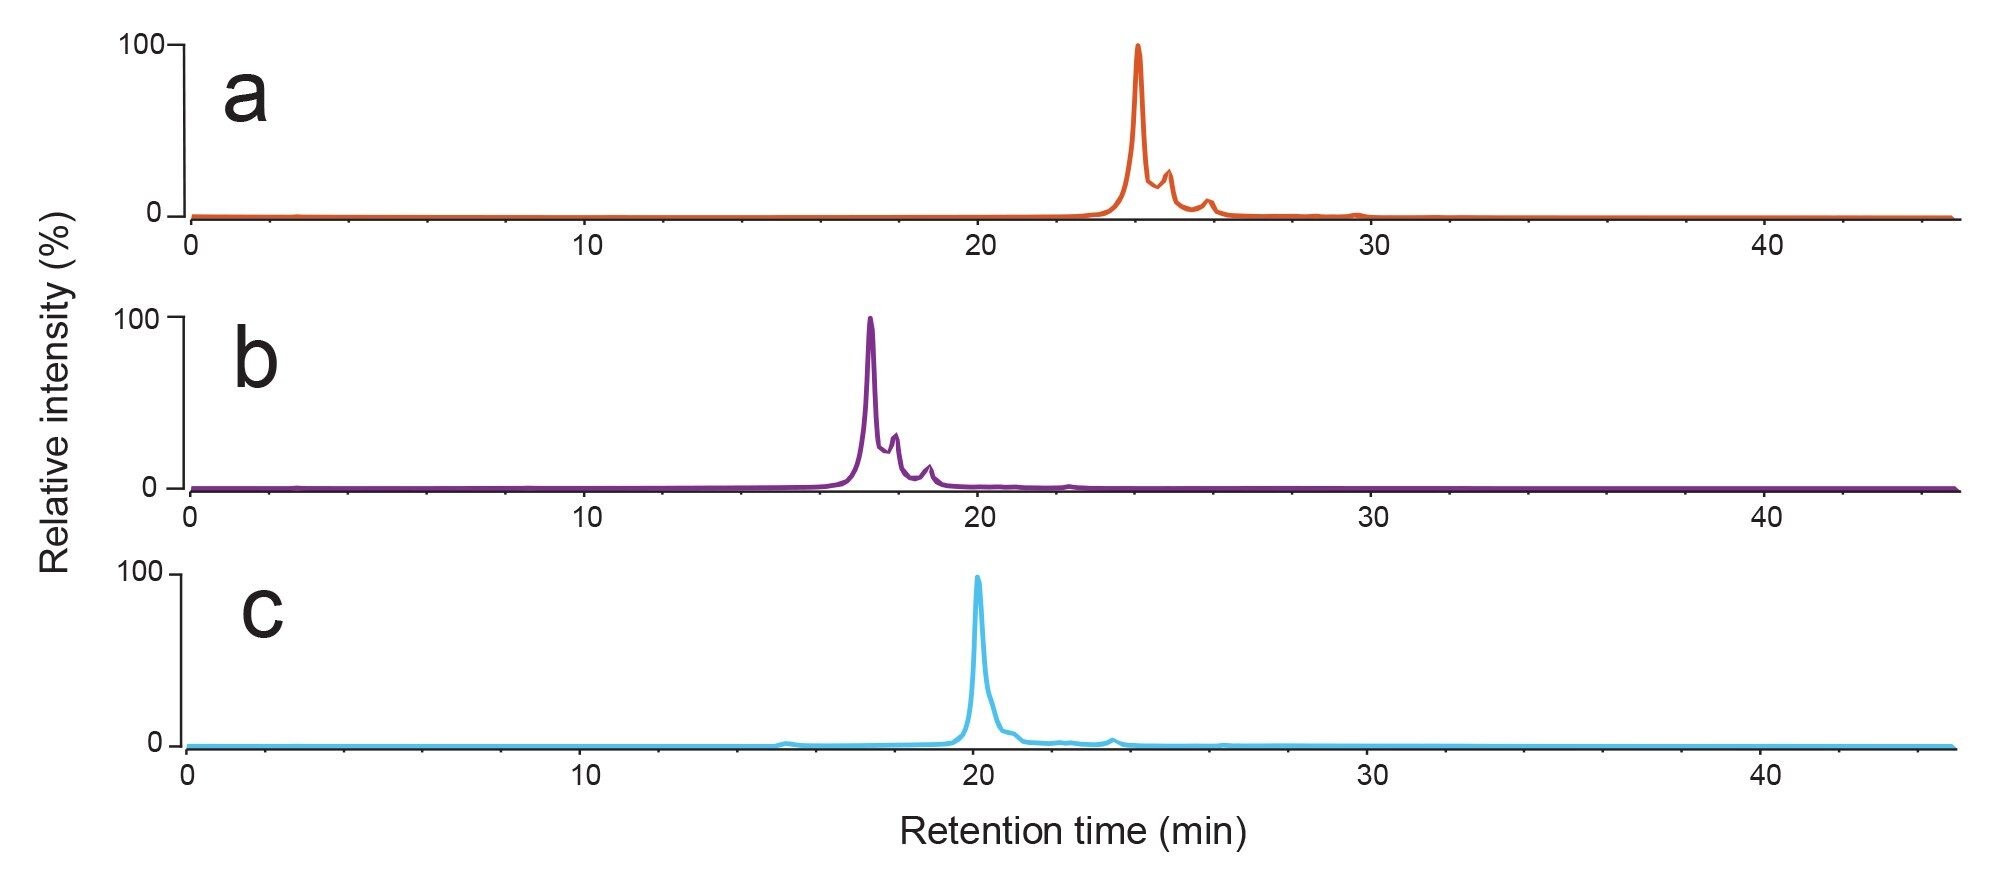 Figure 2. AEX fluorescence chromatograms for Biotherapeutic A analysed using LC gradients a) A, b) B and c) C as given in the Table 1.
To monitor the pH of the mobile phase gradient used for protein elution, the same mobile phases and column described in Gradient A were loaded onto an ÄKTA Pure™ 25 fast performance chromatography instrument (FPLC) and the pH was monitored continuously. Here, the flow used was 0.1 mLmin-1 due to pressure limitations in the system. Figure 3 shows that the decrease in pH is not linear and instead there is a rapid drop in pH during the run. This occurs where the buffering capacity of the ammonium acetate is exceeded. This highlights the difficulties in controlling protein elution when using pH gradients. In addition to these parameters, other method optimisations included buffer exchanging the sample into mobile phase A prior to injection, lowering the pH of mobile phase B and extending the time length of the LC run, however these changes did not result in any observed differences in chromatographic resolution.
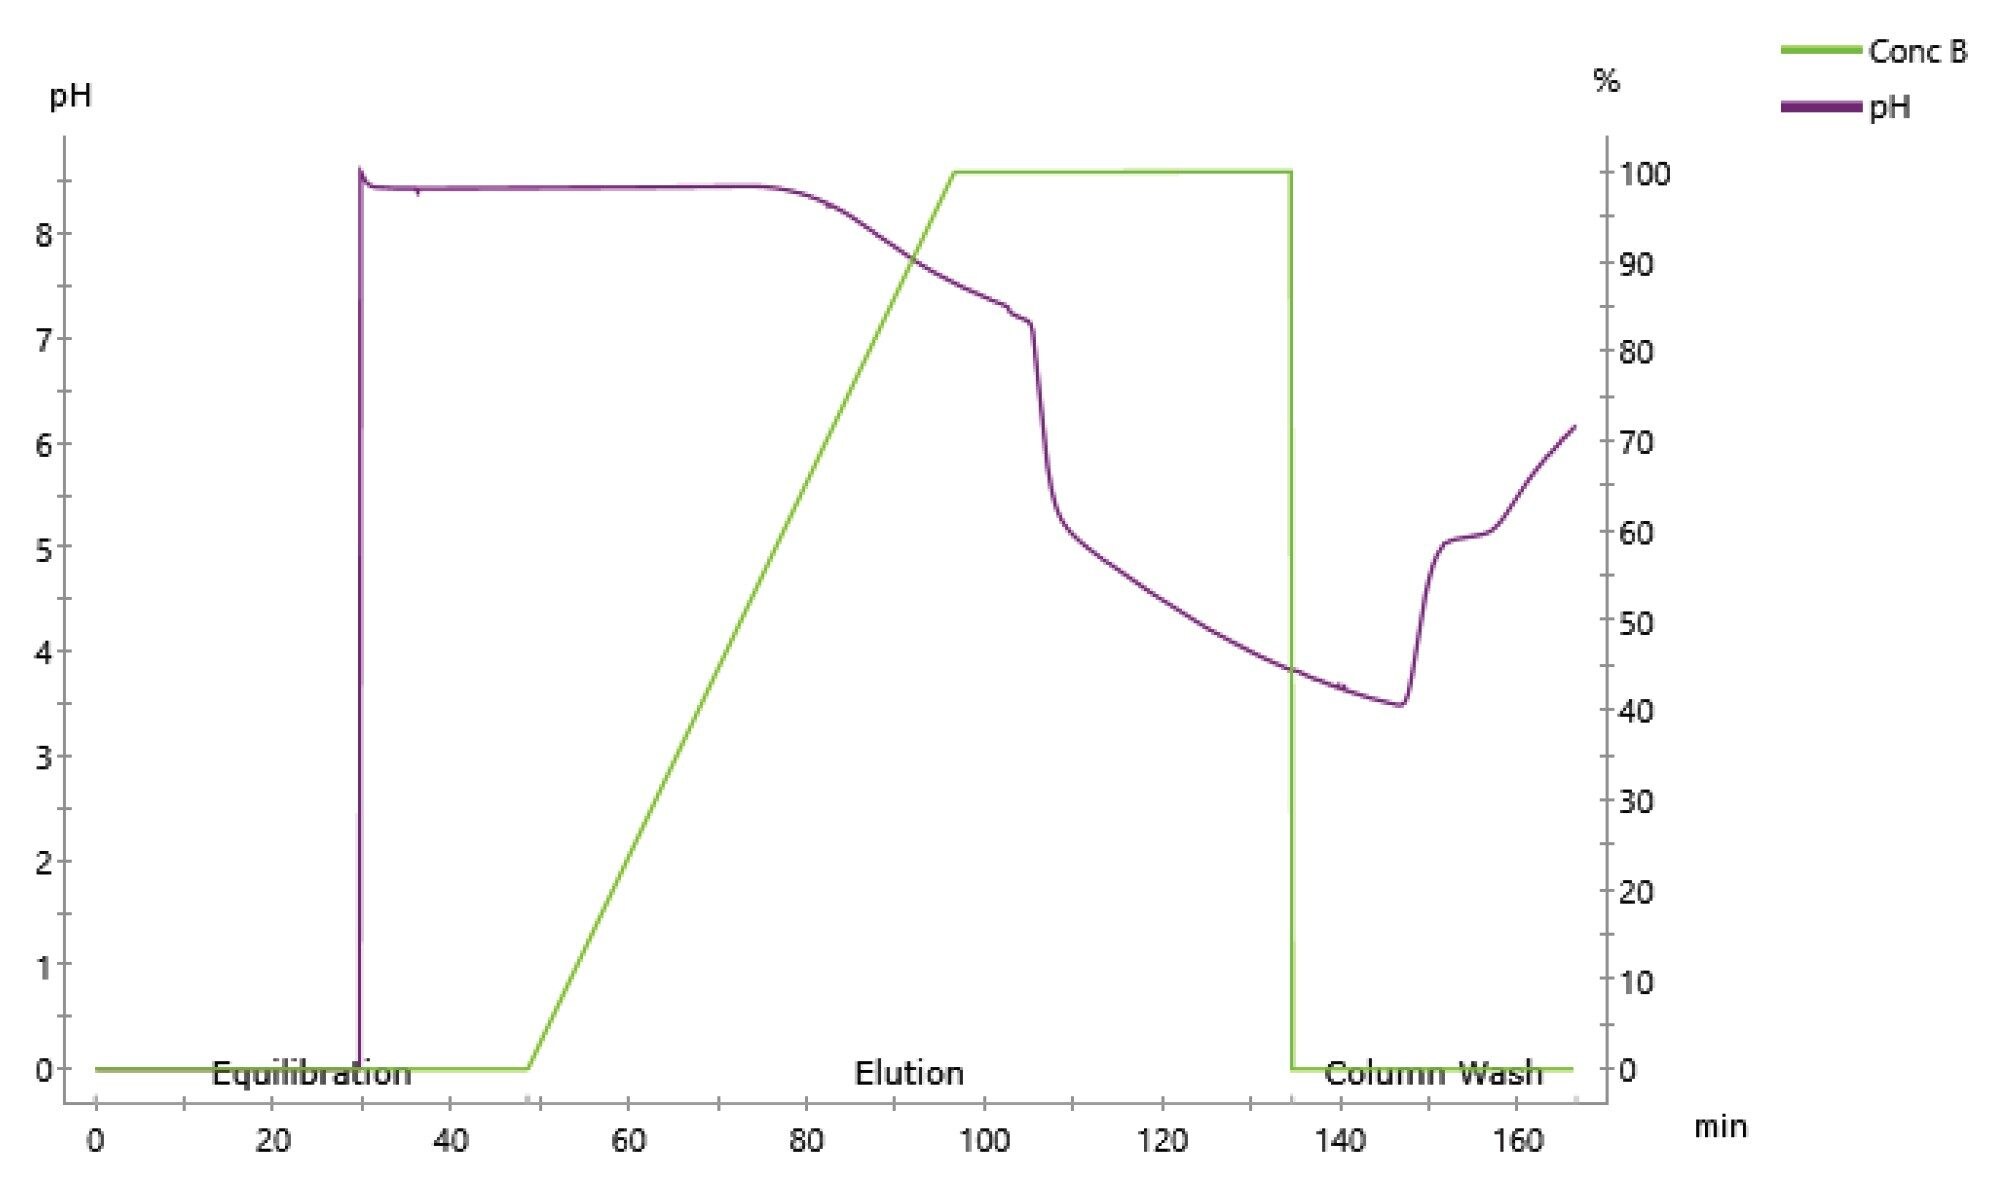 Figure 3. pH monitoring using ÄKTA Pure™.
Mass spectrometry
To determine to optimum conditions for on-line MS analysis using this solvent system, Biotherapeutic A (approximate MW of ~75,000 Da) was injected using a range of cone voltages (100–160 kV) and desolvation temperatures (350, 450, and 550 °C). The average mass spectrometry signal for the eluted product was calculated across the eluting peaks using the UNIFI application, and the intensity of the most abundant charge state was noted. Figure 4 shows this intensity plotted against each tested cone voltage and desolvation temperature. Desolvation temperature was shown to have a substantial effect on the quality of the mass spectrometry data, with the highest MS1 intensity being observed at 550 °C. The cone voltage had less effect on the signal but was highest at approximately 140–160 kV for each desolvation temperature. Subsequently, 550 °C and 150 kV chosen as the optimum conditions. It is of note that the optimal conditions chosen here are different to the desolvation conditions listed in the corresponding CEX-MS application note, where 350oC was chosen. Other than the intensity improvements at 550 °C the MS profiles remained constant.
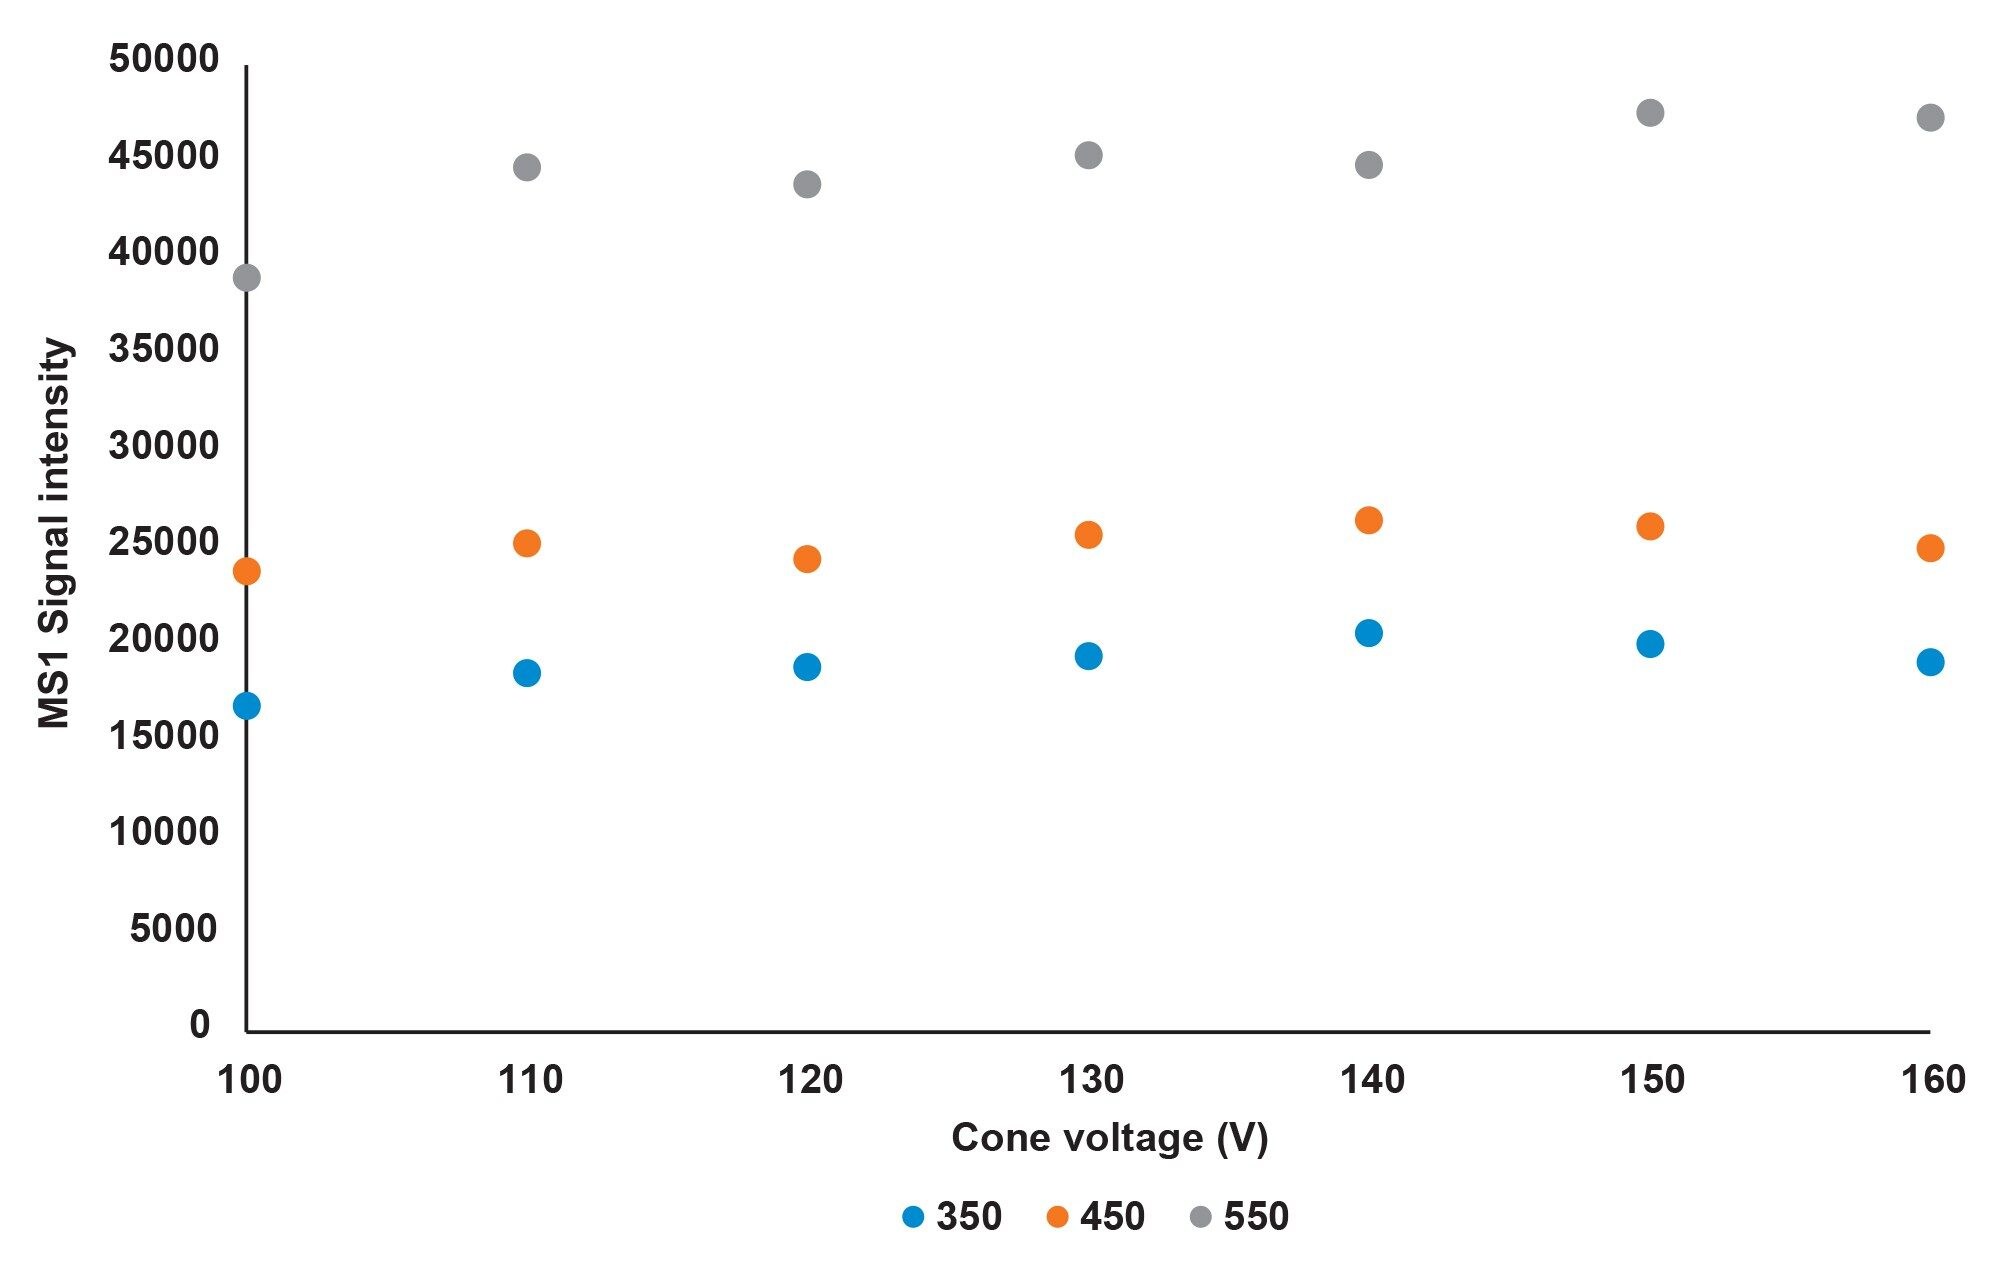 Figure 4. MS intensity reported at different desolvation temperatures (350–550 °C) and cone voltages (100–160 °C).
One of the key benefits of the BioAccord System is that the system can be transferred into the hands of non-expert users. Here, we used the system to rapidly analyse a set of process support samples using AEX-MS, where AEX-UV analysis had previously been performed.
Four samples were supplied by process development, where Biotherapeutic A had been purified at purified pH’s (6, 7, 8.2, and 9). The samples were analysed via AEX-MS using the optimised parameters developed in the prior section. Figure 5a shows the total UV (TUV) chromatogram for the sample purified at pH 6. Four chromatographic peaks were visibly observed that could be differentiated based on subsequent deconvoluted mass spectrometry data. These had retention times at ~26.9 (1), 27.4 (2), 27.9 (3), and 28.5 (4) minutes. Figure 5b shows the average mass spectrometry signal under peak 1. Relevant charge state distributions are estimated to be between ~2000–5000 m/z, with the appropriate charge state for each peak highlighted. It is of note that two charge state envelopes were observed for the same species, due to partial unfolding of the protein. The MS data was deconvoluted and is shown in Figure 5c. The data indicates that the species responsible for this peak on the chromatogram corresponded to the theoretical mass of unmodified Biotherapeutic A. Next, the mass spectrometry signal under peak 2 (Figure 5d) was deconvoluted (Figure 5e). Here, the base peak corresponded to the mass of Biotherapeutic A with a dihydroxyimidazolidine adduct. This is a common acidic modification that has been shown to occur on arginine residues in Biotherapeutics, and primarily occurs during generation of inclusion bodies. Therefore, control must come through either growth conditions or downstream purification. The mass spectrometry data under peaks 3 and 4 was also analysed (see Figures 5f–i). The main species contributing towards these peaks was shown to correspond to gluconoylated and phosphogluconoylated Biotherapeutic A. Both of these modifications are acidic in nature and have previously been observed in Biotherapeutic A in prior studies using different analyses. In summary, we were able to assign the charged species responsible for each of the peaks in the AEX chromatogram.
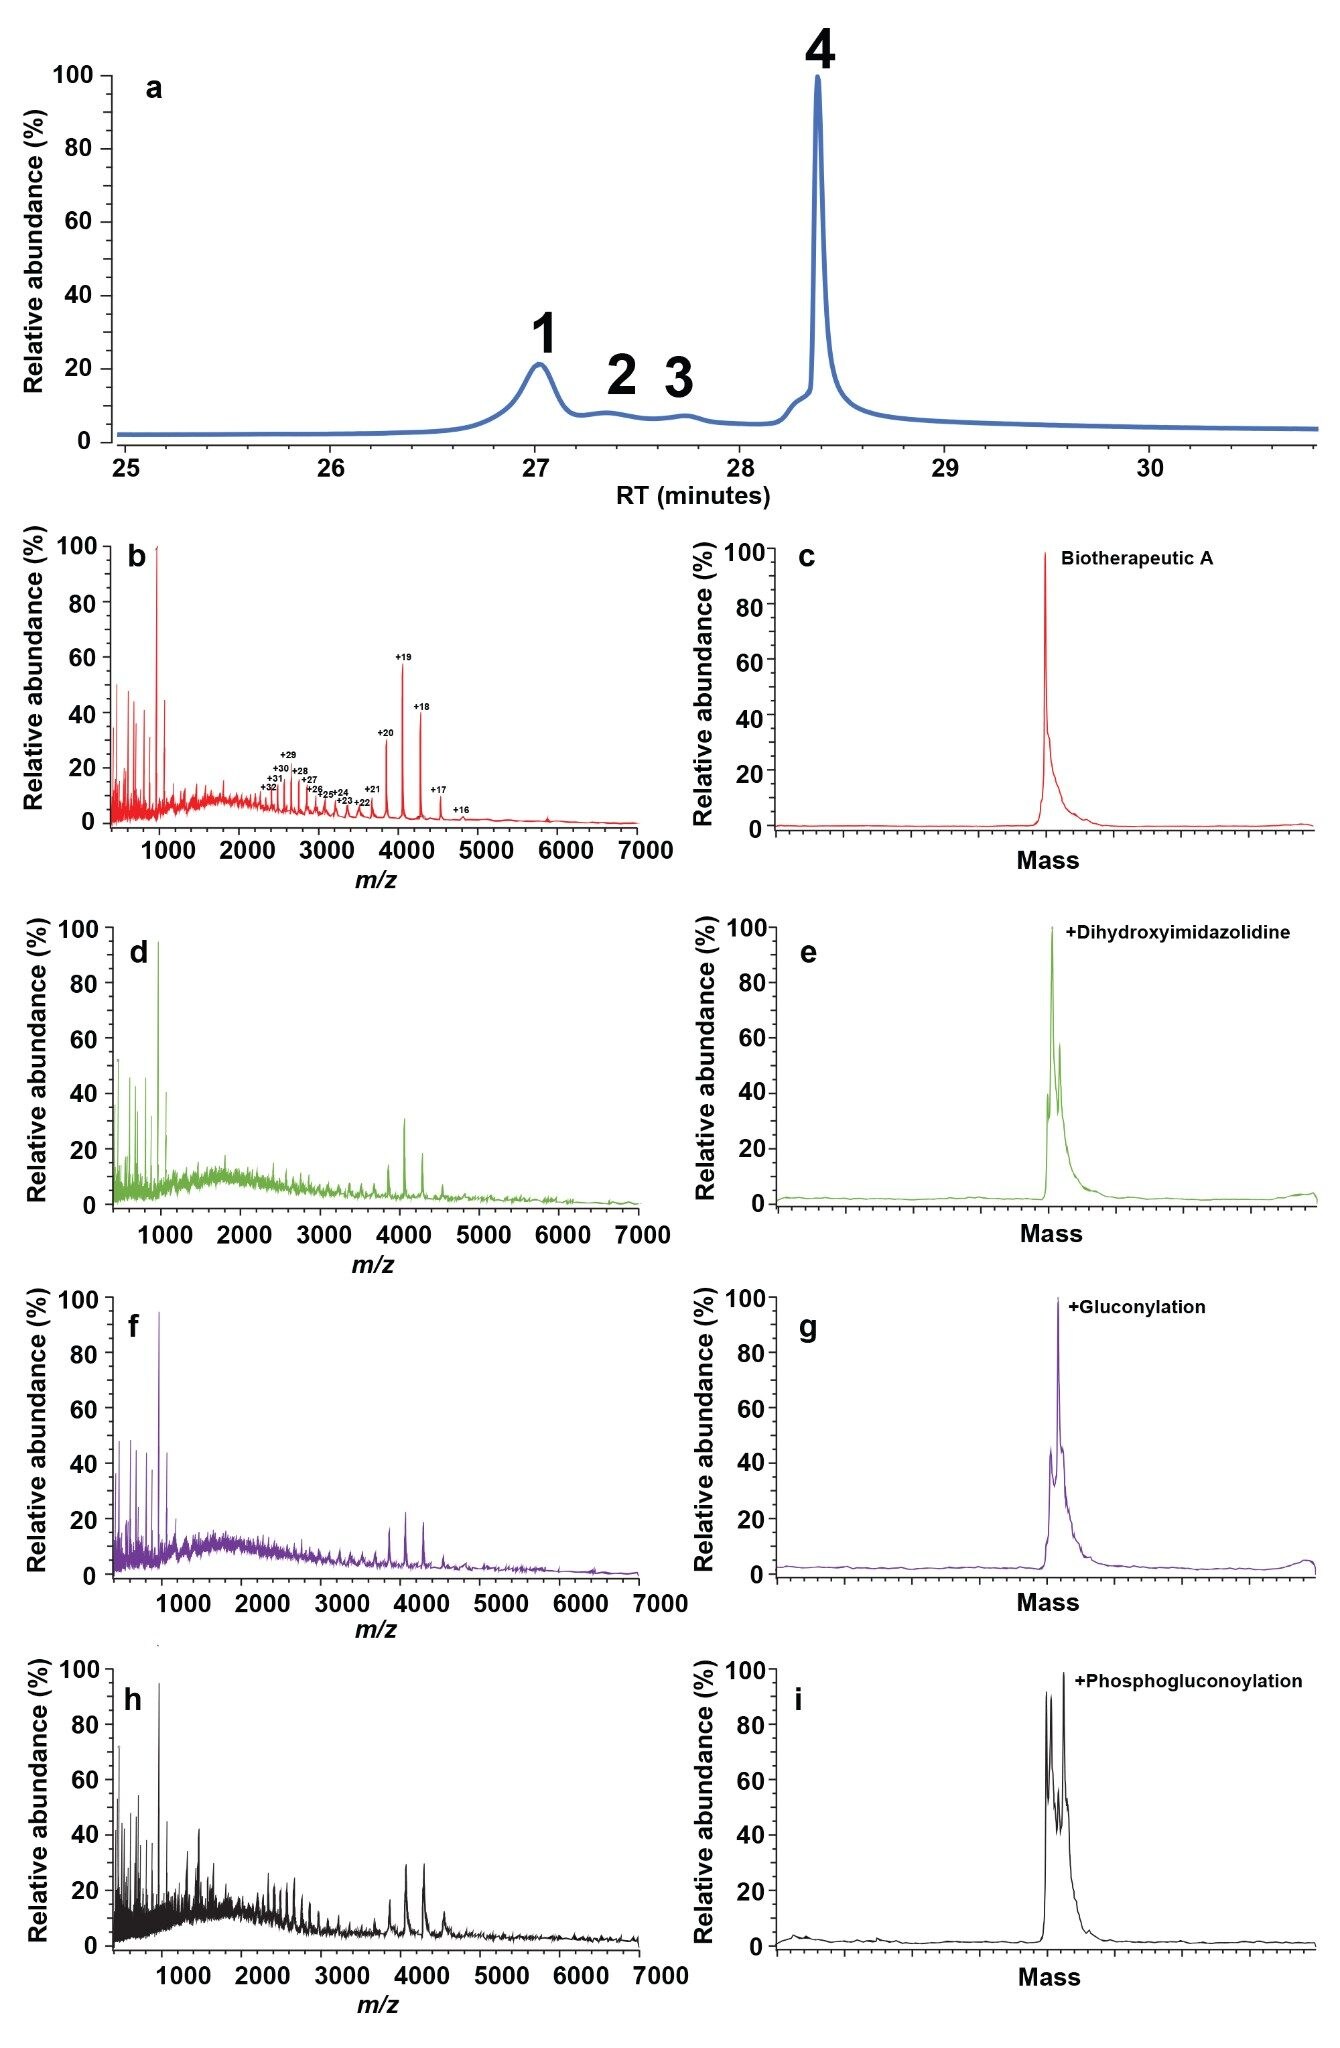 Figure 5. a) The top panel shows the AEX fluorescence chromatogram for the sample purified at pH 6. The left hand side panels show the corresponding averaged MS data for elution point 1 (b), 2 (d), 3 (f) and 4 (h). The right hand side panels show the corresponding averaged MS data for elution point 1 (c), 2 (e), 3 (g), and 4 (u).
Subsequently, to assess the relative abundance of each of these modifications, the AEX-MS data was processed using the waters_connect INTACT Mass application. Table 2 shows the direct output from the software, which lists the contribution of each PTM towards product heterogeneity by using the total MS signal of each ion, in each sample. Additionally, each of the UV peaks will correctly and automatically be assigned using this software where quantitative analysis is not needed. The output indicated that the product heterogeneity was minimised at lower elution pH’s.
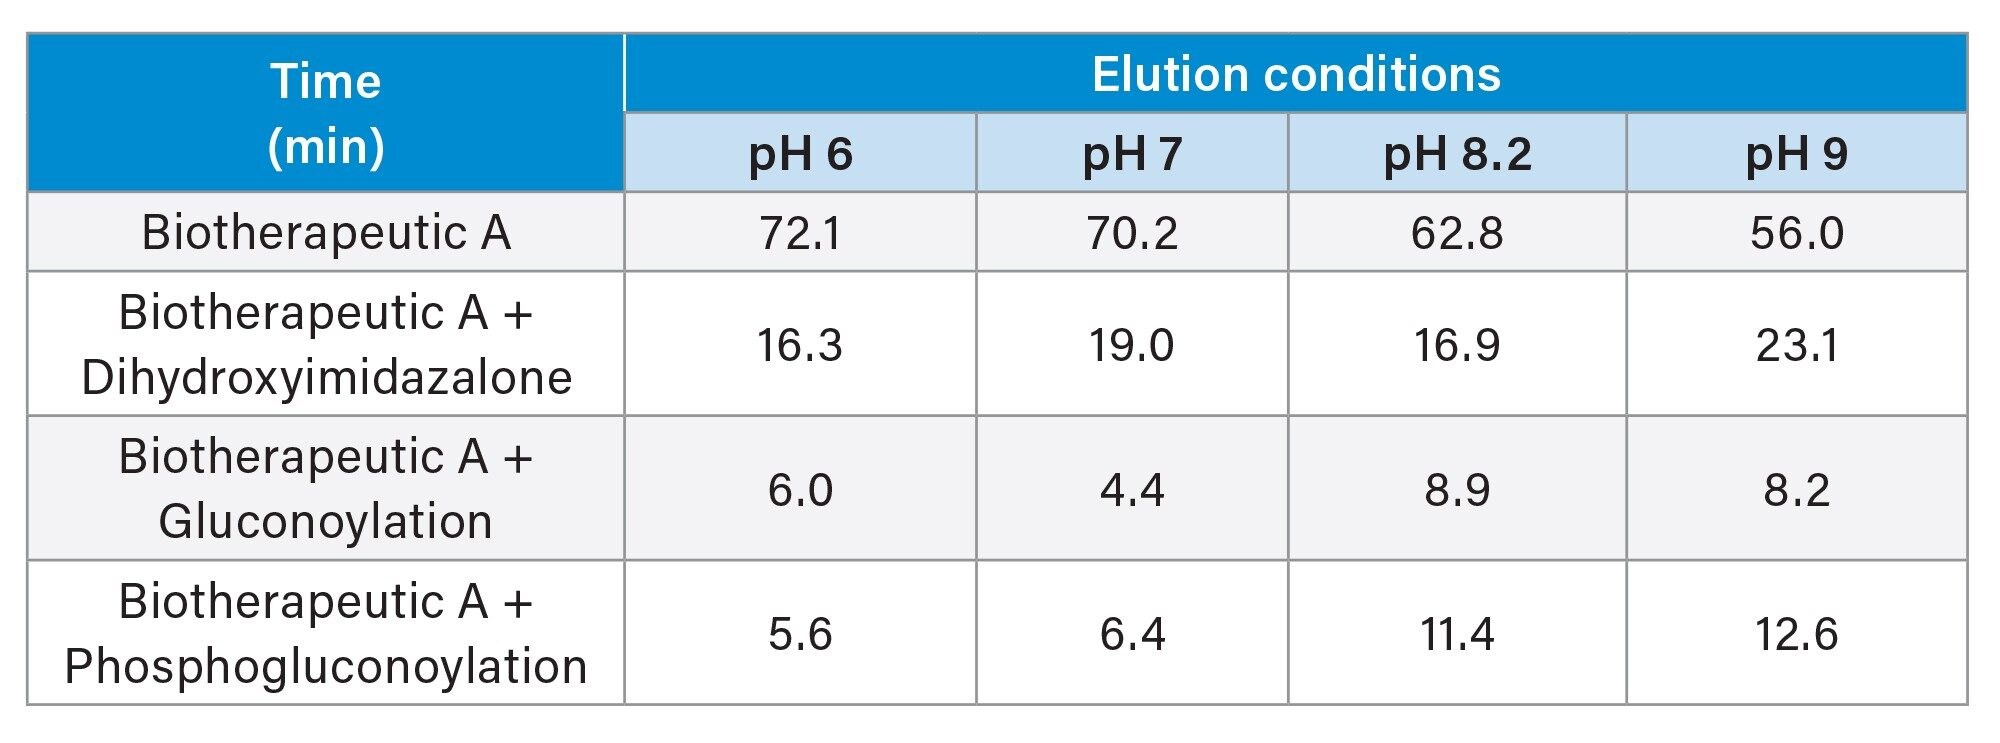 Table 2. PTM Summary of eluates via the INTACT mass application.
Process development samples 2
Nine further samples were supplied by process development. These were Biotherapeutic A, which had been purified using a different system under different conditions. Firstly, under different pH conditions (pH 5.7, 5.9, 6.3, and 6.7), but also at different ratios of alpha to beta inclusion bodies, with 100% being the standard amount as per transferred process. Figure 6a shows the fluorescence chromatograms for the samples. Visible inspection of the chromatograms showed slight differences in the levels of charged variants, in particular the eluate at pH 6.7 which indicated a more homogenous product. Each of the AEX-MS datasets was processed in the waters_connect INTACT mass application, which assigned the peaks on the chromatogram immediately following data collection. Table 3 shows the reported PTM levels for each of the samples. The outputted data displays that there is an increasing correlation between product heterogeneity and elution pH between 5.7 and 6.7. The data further indicated no obvious correlation between the alpha and beta ratio and PTM levels.
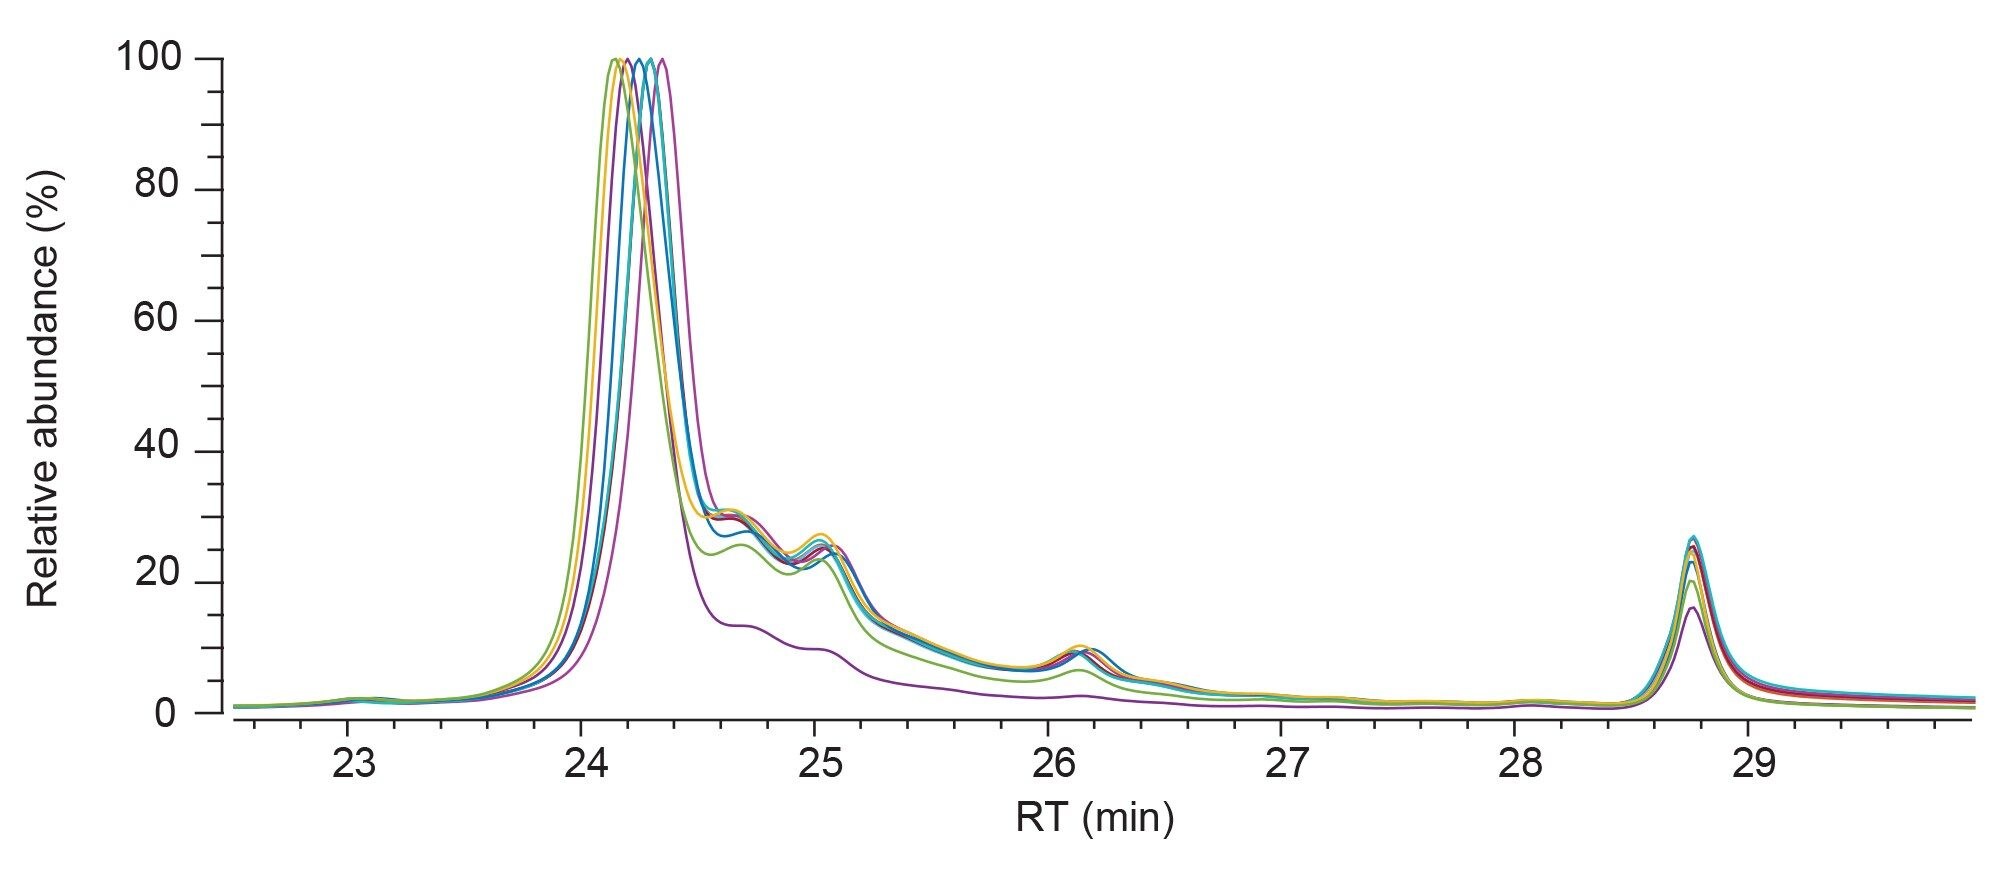 Figure 6. Overlaid AEX fluorescence chromatogram for eluates purified at pH 5.7 (navy), pH 5.9 (yellow), pH 6.3 (green), pH 6.7 (purple), 85/85 (pink), 115/ 85 (burgundy), 85/115 (marine), 115/115 (sky blue) and 100/100 (red).
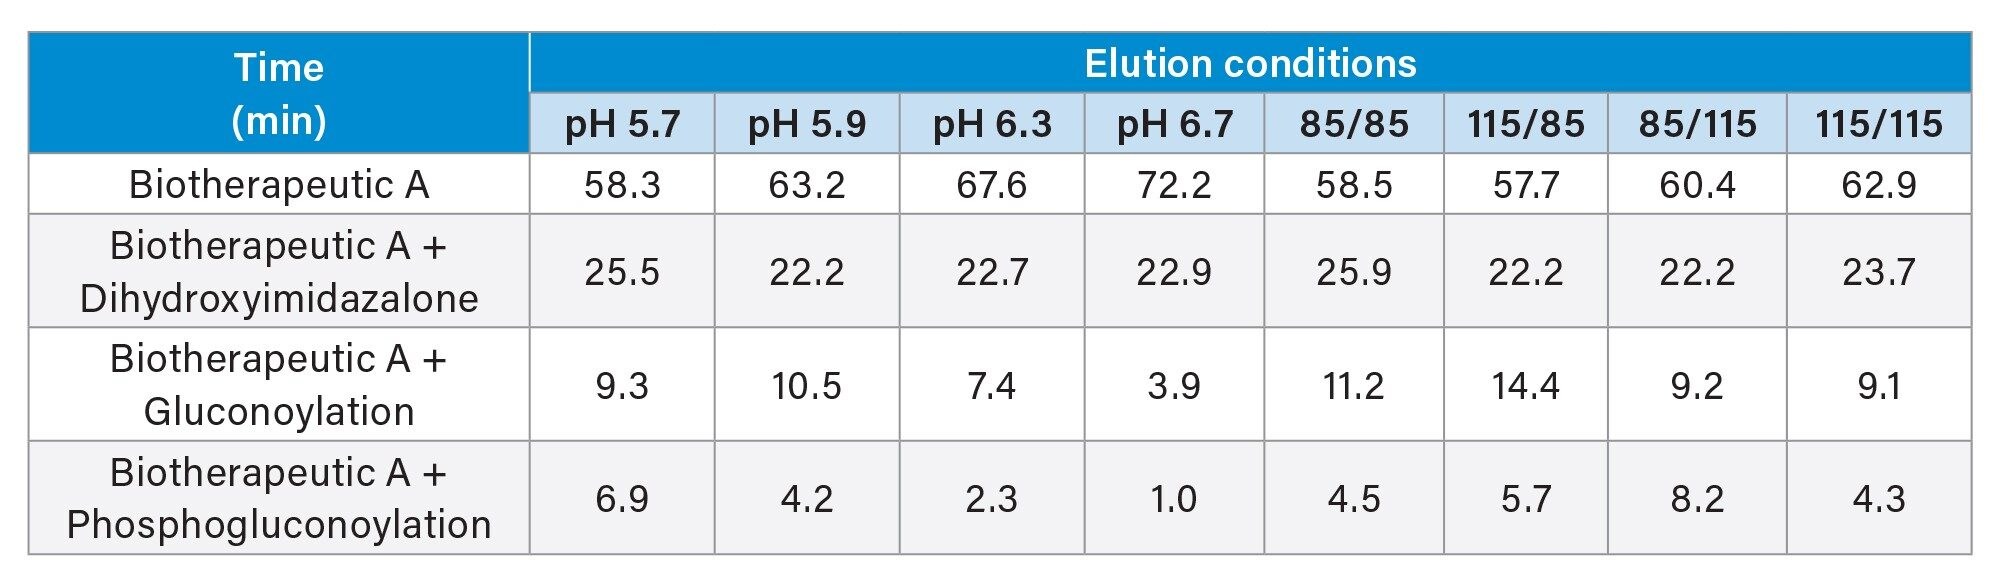 Table 3. PTM Summary of eluates via the INTACT mass application.
Conclusion
Examination of biopharmaceuticals via AEX-MS is an emerging method for the analysis of charged variants. In this study, an online AEX-MS method, using the BioAccord LC-MS System, has been successfully implemented. The BioAccord LC-MS System provided robust chromatographic separation of charged species, together with high quality mass spectra which facilitated the identification of each chromatographically separated peak. Data acquisition and analysis via the waters_connect INTACT mass application provides a simple and robust method for users without prior mass spectrometry experience.
References
- Khawli, L. A. et al. Charge variants in IgG1: isolation, characterization, in vitro binding properties and pharmacokinetics in rats. in vol. 2 613–624 (Taylor and Francis).
- Schmid, I. et al. Assessment of susceptible chemical modification sites of trastuzumab and endogenous human immunoglobulins at physiological conditions. 1, 28.
- Du, Y. et al. Chromatographic analysis of the acidic and basic species of recombinant monoclonal antibodies. in vol. 4 578–585 (Taylor and Francis).
- Griaud, F. et al. Unbiased in-depth characterization of CEX fractions from a stressed monoclonal antibody by mass spectrometry. in vol. 9 820–830 (Taylor and Francis).
- Muneeruddin, K., Nazzaro, M. and Kaltashov, I. A. Characterization of intact protein conjugates and biopharmaceuticals using ion-exchange chromatography with online detection by native electrospray ionization mass spectrometry and top-down tandem mass spectrometry. 87, 10138–10145.
- Yan, Y., Xing, T., Wang, S. and Li, N. Versatile, sensitive, and robust native lc–ms platform for intact mass analysis of protein drugs. 31, 2171–2179.
720008135, November 2023