• Application Note

Determination of Partitioning Coefficient by UPLC-MS/MS

Determination of Partitioning Coefficient by UPLC-MS/MS

  • Darcy Shave
  • Peter G. Alden
  • Waters Corporation

Abstract

This application note demonstrates the 24 compounds which were analyzed with a UPLC-MS/MS protocol including MS multiple reaction monitoring (MRM) parameter optimization, MS acquisition method creation, data acquisition, data processing, and report generation.

Introduction

Lipophilicity of drug molecules plays an important role in their absorption, permeation, and disposition by affecting the drug’s ability to be absorbed through the gut wall and to cross the blood/brain barrier. The common lipophilicity scale of molecules is defined by the octanol/water partition coefficient, logP (or Kow), which is a measure of the drug’s preference for an organic compound for water versus a less polar organic solvent.

Partition coefficients indicate drug transport characteristics - the ability of drugs to reach the site of action from the site of application (e.g., injection site or gastrointestinal tract). Drugs are distributed by the blood and must penetrate and traverse many cells to reach the site of action. Hence, the partition coefficient indicates which tissues a given compound can reach.

Extremely water-soluble drugs may be unable to cross lipid barriers and gain access to organs rich in lipids, such as the brain and other neuronal tissues.

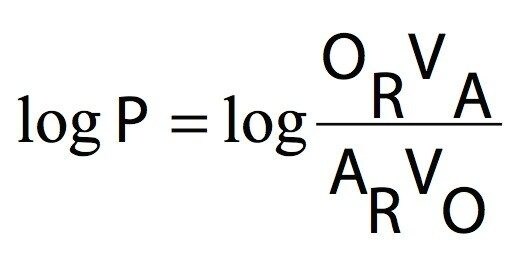
LogP is the ratio of the concentration of a compound in aqueous phase to its concentration in an immiscible solvent, as the neutral molecule. Partition coefficients are difficult to measure in living systems, and are usually determined in vitro using 1-octanol (n-octanol) as the lipid phase and pH 7.4 phosphate buffer as the aqueous phase. This approach permits standardized measurement.

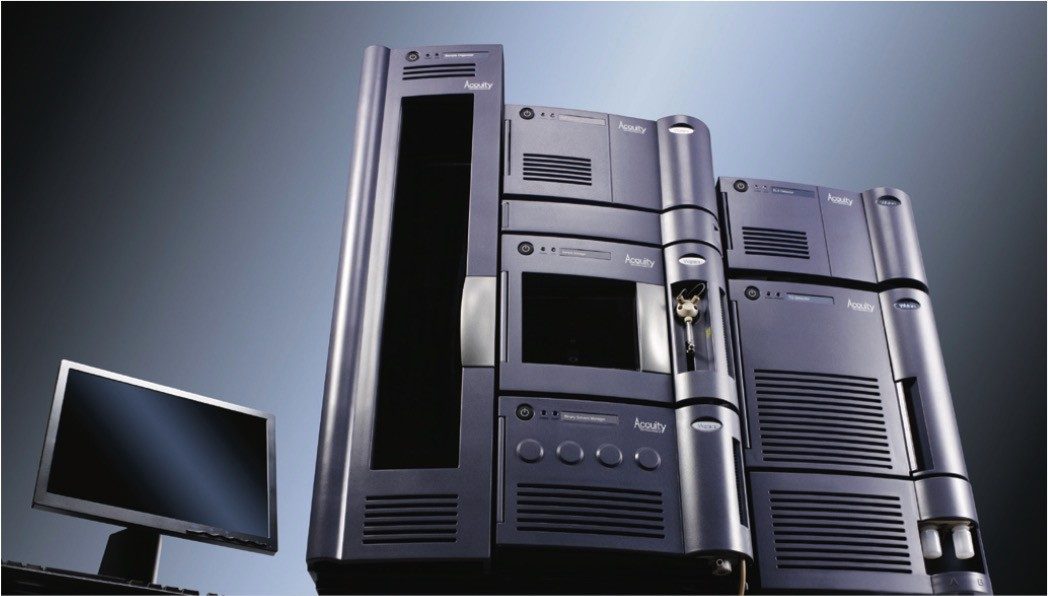
The traditional shaker flask method for determining logD/P is both time-consuming and compound-intensive. The use of UPLC-MS/MS (Figure 1) with the Waters ACQUITY TQD System along with specialized software, ProfileLynx and QuanOptimize Application Managers, allows this analysis to be automated.

Figure 1. ACQUITY TQD System.

Experimental

A set of 24 commercially-available compounds were chosen to demonstrate the MassLynx Software’s ProfileLynx Application Manager.

Three solutions were prepared: n-Ocatanol saturated with water, water saturated with n-Octanol, and pH 7.4 phosphate buffered saline (PBS) saturated with n-octanol. Two 2-mL, 96-well plates were prepared, one for octanol/water portioning and one for octanol/pH 7.4 buffer portioning. 490 μL of water (n-octanol saturated) was placed into each well of one plate, and 490 μL of pH 7.4 PBS was placed into each well of the other plate. 20 μL of each 50 μM compound stock was added to both plates. 490 μL of n-octanol (water saturated) was added to each well of both plates. The plates were capped and shaken for 24 hours at 37 °C. 3-μL injections were made from the upper octanol phase and the bottom aqueous phase.

The procedure was then repeated using the octanol/pH 7.4 buffer system with only 1 hour of shaking to determine if the assay time could be shortened.

LC Conditions

LC system:

Waters ACQUITY TQD System

Column:

ACQUITY UPLC BEH C18 Column 2.1 x 50 mm, 1.7 μm

Column temp:

40 °C

Flow rate:

600 μL/min

Mobile phase A:

0.1% Formic acid in water

Mobile phase B:

0.1% Formic acid in acetonitrile

Gradient:

5 to 95% B/1.3 min

MS Conditions

MS system:

Waters TQ Detector

Ionization mode:

ESI Positive

Capillary voltage:

3200 V

Source temp:

150 °C

Desolvation temp:

450 °C

Desolvation gas:

900 L/hr

Cone gas flow:

50 L/hr

Inter-scan delay:

20 ms

Inter-channel delay:

5 ms

Dwell:

200 ms

Acquisition range:

100 to 1000 m/z

Results and Discussion

The partitioning coefficient was determined using MassLynx Software’s ProfileLynx Application Manager. Each compound was identified within the sample list and denoted as an analyte. The phase (organic or aqueous) that each sample was found in was also denoted in the sample list. ProfileLynx then determined the logD/P value for each compound using the following formula:

Where: VA = aqueous volume (from method)
VO = octanol volume (from method)
OR = donor response
AR = receptor response

Any logD/P values outside of a user-specified minimum and maximum range were automatically flagged within the ProfileLynx Results Browser (Figure 2). For this experiment, the minimum was set at -1.0 and the maximum at 3.0.

Figure 2. ProfileLynx Results Browser.

The interactive browser allowed for editing of peak integration and recalculation of results. Peak assignments were easily changed and peak integrations were quickly optimized. Results were then exported in a format amenable to the corporate database.

Because conditions were not chosen to ensure that all of the compounds would be in the unionized form, only a small number agree with the literature values of LogP obtained from the DrugBank website (www.drugbank.ca). There is also some disagreement in literature values of LogP from different sources for many of the compounds. For this reason, the majority of the values reported here should be considered LogD values determined at either pH 7.4 (buffer) or pH ~5.5 to 6 (water).

The LogP assay was carried out in pH 7.4 buffer for 24 hours and for 1 hour to determine how long the mixing had to be performed to ensure complete the equilibrium of the partitioning process. Table 1 lists the LogD results for all of the compounds in the library and the average values for the duplicate injections.

Table 1. Results of LogP/LogD assay.

The 1-hour samples gave the same LogD values as the 24-hour samples for all compounds with LogD values less than approximately 2.0. Compounds with a LogD value greater than 2.0 exhibited incomplete partitioning, indicating insufficient time for the compounds to partition out of the aqueous phase into the octanol phase resulting in a LogP value lower than expected. For this reason, the assay should be run for a minimum of ~2 hours.

Conclusion

The 24 compounds were analyzed with a UPLC-MS/MS protocol including MS multiple reaction monitoring (MRM) parameter optimization, MS acquisition method creation, data acquisition, data processing, and report generation.

The data generated from the variety of assays were all processed with the same software automatically. A single report was created for the 24 compounds containing the partitioning results, enabling the researcher to analyze results quickly, thus increasing laboratory throughput. Results are displayed in an interactive, graphical summary format based on sample or experiment.

The short cycle time of the UPLC system allowed the determination of the LogP values of 24 samples in less than 1 hour, using a minimum amount of sample.

Using ProfileLynx and QuanOptimize Application Managers allowed for:

  • Automated MS method development and data acquisition
  • Single approach for data processing and report generation from multiple assays
  • Complete automated analysis, processing, and reporting
  • Increased laboratory throughput

720002614, May 2008

Voltar ao início Voltar ao início