Characterization of Reduced Monoclonal Antibody by On-line UPLC-UV/ESI-Tof MS
Introduction
With an increasing number of therapeutic monoclonal antibodies (mAbs) in development, the need for analytical methods for their detailed characterization has increased significantly. Although mAbs are relatively stable molecules, their molecular structures are nevertheless subject to a variety of enzymatic and non-enzymatic degradation reactions (e.g., oxidation, proteolytic cleavage, disulfide-bond scrambling, glycosylation, deamidation, aggregation, and isomerization) during manufacturing, formulation, and storage. These reactions could cause changes of molecular structures and subsequently lead to decreased biological activity and the alteration of the pharmacokinetics and antigenicity. Moreover, approval by regulatory authorities for therapeutic recombinant antibodies requires the development of methods that can define key structural features, particularly those that directly affect potency or pharmacokinetic property of the drug.
LC/MS analysis of reduced antibody offers in-depth structural characterization of monoclonal antibodies that cannot be readily assessed at the intact mAb level. The analysis of reduced antibody subunits enables detection and identification of subunit variants with large mass differences, such as proteolytic clipping, glycosylation, lysine processing, half-molecule, and lower mass changes, such as oxidation and pyroglutamic acid formation.
In this study, a system solution is presented for an in-depth analysis of a reduced monoclonal antibody via a LC-UV/ESI-TOF MS method, utilizing the Waters® ACQUITY UPLC® System with the LCT Premier™ XE Mass Spectrometer. The system combines highly efficient UPLC® separations with highly accurate mass measurement to obtain the detailed characterization of reduced monoclonal antibodies and their modifications. In addition, UV detection with the ACQUITY UPLC Tunable UV (TUV) Detector is coupled with on-line LC/MS analysis to provide additional quantitative information for the components under mass analysis.
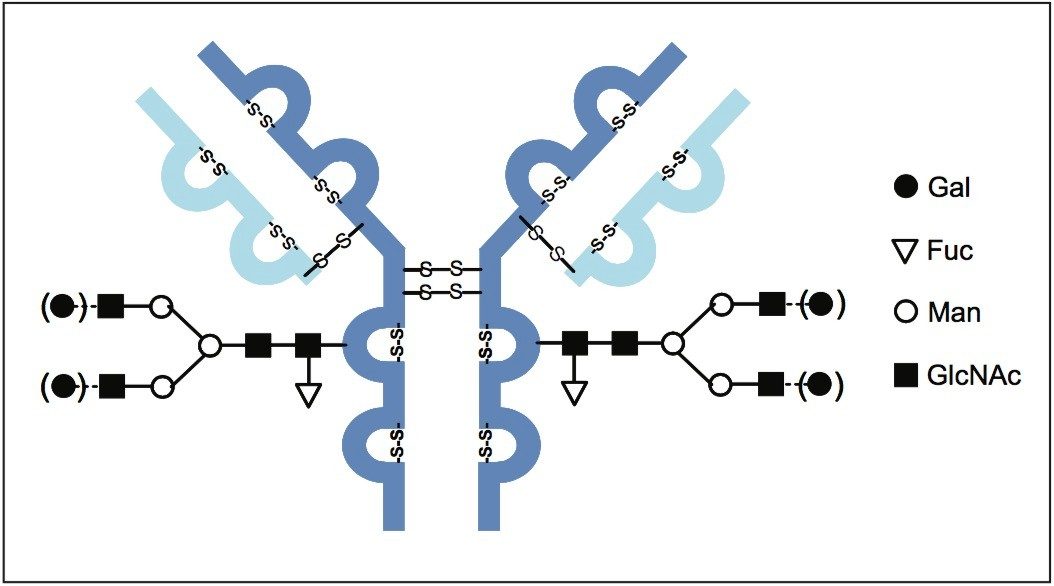 Figure 1. Structure of recombinant monoclonal IgG1 antibody used in this study. Glycosylation profile includes two N-linked biantennary glycans with variable number of galactose residues.
Experimental
LC Conditions
|
LC system: |
Waters ACQUITY UPLC |
|
UV detection: |
ACQUITY UPLC TUV, dual wavelength, 215 nm |
|
Column: |
BioSuite™ Phenyl RPC Column 2.0 x 75 mm, 10 µm, 1000 Å |
|
Flow rate: |
0.2 mL/min |
|
Column temperature: |
80 °C |
|
Gradient: |
10% B for 6 min (waste) Then 20% to 35% B in 30 min |
|
Mobile phase A: |
0.1% Formic acid (water) |
|
Mobile phase B: |
0.1% Formic acid (ACN) |
MS Conditions
|
MS system: |
Waters LCT Premier XE |
|
Ionization mode: |
ESI positive |
|
Capillary voltage: |
3200 V |
|
Cone voltage: |
45 V |
|
Desolvation temperature: |
350 °C |
|
Source temperature: |
150 °C |
|
Desolvation gas: |
800 L/Hr |
|
Acquisition range: |
600 to 3000 m/z |
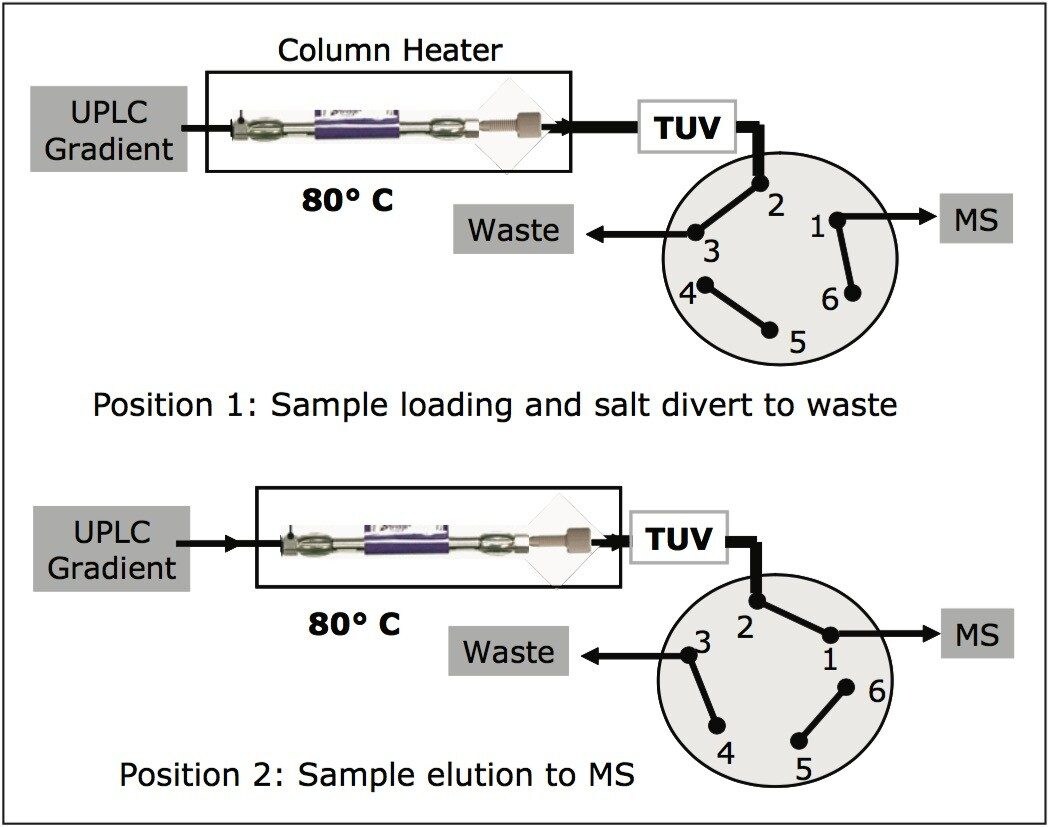 Figure 2. Fluidic configuration for UPLC-UV/MS analysis of reduced mAb. Pre-column tubing (Waters p/n: 430001988) was used to generate enough backpressure at the used flow rate to ensure a reproducible separation. An integrated post-TUV valve (top-left corner of the LCT Premier XE) was used to divert buffers and nonvolatile salts to waste before MS analysis.
Reduction of an IgG1 antibody to heavy (HC) and light (LC) chain subunits
Reduction of disulfides in an IgG1 (0.5 µg/µL) was achieved with 20 mM DTT at 80 °C for 15 min. The reduced sample was acidified with formic acid (to 1%), centrifuged, and injected (2.5 µL) onto the column for LC-UV/MS analysis.
Results and Discussion
An on-line UPLC-UV/MS method was used to resolve and characterize a reduced monoclonal IgG1 antibody and its modifications. Figure 3 shows the UV chromatogram, total ion chromatogram (TIC) and the deconvoluted mass spectra of the reduced IgG1 antibody, obtained by UPLC-UV/MS analysis on a BioSuite Phenyl Column.
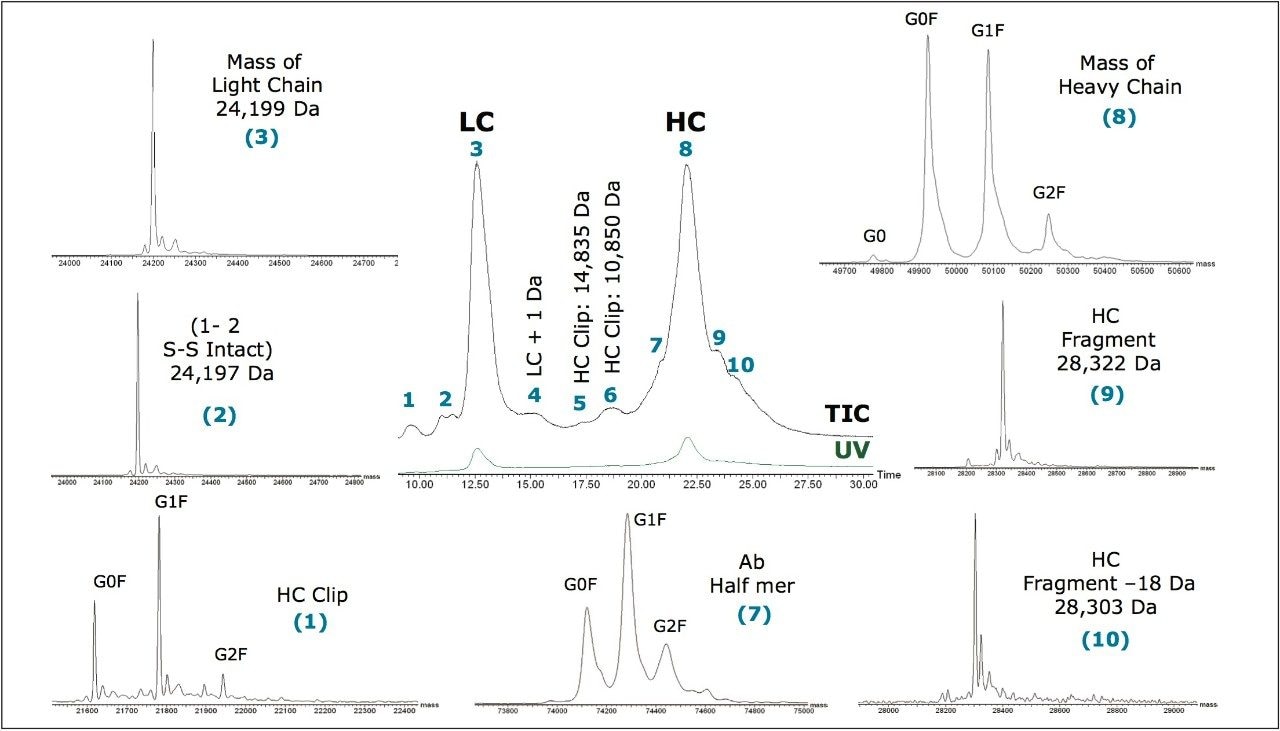 Figure 3. UPLC-UV/MS analysis of reduced IgG1. The separation was achieved using a linear gradient from 20% to 35% B in 30 minutes. This figure depicts the UV chromatogram, TIC chromatogram, and resulting MaxEnt 1 deconvoluted mass spectra of the antibody light chain and heavy chain variants, and their modifications.
The TIC of reduced IgG1 illustrates the separation power of the column. In addition to the two completely-resolved major peaks (peak 3 and peak 8), several minor peaks are also observed. The MaxEnt™ 1 deconvoluted mass spectrum of peak 3 reveals a single major component at 24,199 Da, whereas deconvoluted mass spectrum of peak 8 reveals three major components with a mass differential of ~162 Da.
In comparison with theoretical mass calculation (241,199 Da) based on the amino acid sequence of the mAb, it can be concluded that peak 3 represents the completely-reduced form of the light chain (LC) of the mAb, whereas peak 8 is from the heavy chain (HC) subunit. These three major components correspond to the heavy chain containing the core fucosylated glycan (G0F, 49,924 Da) and core glycan variants extended by one (G1F, 50,086 Da) or two (G2F, 50,248 Da) terminal galactose residues. The deconvoluted mass spectrum of the HC displays another component (49,778 Da) with a mass difference of 146 Da from G0F, corresponding to incomplete occupancy of a fucosylation site of the core glycans. These results are fully consistent with the earlier studies on the same antibody.1–3
The TIC in Figure 3 also displays several minor peaks beside the main LC and HC peaks. The deconvoluted mass spectrum of peak 1 reveals three major components (21,619 Da, 21,782 Da, 21,943 Da) with a mass differential of ~162 Da, but the individual mass of each variant is lower than that from the intact HC subunit. This indicates that peak 1 is probably due to a product cleaved from the heavy chain.
From peak 2, a single mass peak at 24,197 Da is generated upon deconvolution, which is 2 Da less than the mass of the light chain. This implies that peak 2 is either due to the partial reduction of intra-disulfide bonds of LC or the re-generation of a disulfide bond by free sulfohydryl groups from complete reduction.
The deconvoluted mass spectrum of peak 4 displays a mass of 24,200 Da which is 1 Da higher than the mass of the LC. Deconvoluted mass spectra of peaks 5 and 6 represent masses of HC clips containing no glycan variants. Deconvoluted mass spectrum of peak 7 reveals three major peaks (74,120 Da, 74,284 Da, and 74,442 Da) differing by ~162 Da.
Based on our mass measurements of the light chain and heavy chain (containing only the core glycan), we would predict the mass of an IgG1 half-molecule (i.e., one heavy chain disulfide-bonded to one light chain) is 74,119 Da (restoration of one inter-chain disulfide bond). This prediction is only 1 Da lower than the observed halfmolecule mass of 74,120 Da. Because mass precision of 1 Da is used during the MaxEnt deconvolution, the mass discrepancy can be attributed to the deconvolution process. Although half-molecules of IgG1 occur when the inter-heavy chain disulfide bonds are absent, they are rare. Disulfide bond scrambling and β-elimination are the two major mechanisms of the formation of antibody fragments. Thus this half-molecule formation can most likely be attributed to reconnection of a LC and a HC by a disulfide bond since the sample was not alkylated.
Two shoulder peaks marked as peak 9 and 10 are also observed in Figure 3. Deconvoluted spectra of peaks 9 and 10 reveal that each generates one major mass peak respectively, with peak 9 having a mass value of 28,322 Da and peak 10 of 28304 Da. The mass difference between the two mass peaks is 18 Da. If the masses of peak 1 (G0F, 21,619 Da) and peak 9 (28,322 Da) are combined together, a total mass value of 49,923 Da is attained after subtracting 18 Da (mass of H2O) off the summation. This value is only 1 Da away from the measured molecular mass of the intact HC subunit, suggesting that peak 9 comes from a fragment of HC formed by protein backbone cleavage. The fact that peak 10 is eluted closely to peak 9 and the deconvoluted mass of peak 10 is only 18 Da lower than peak 9 implies that peak 10 probably represents a variant of peak 9.
UV Compared to MS detection
When coupled with LC separation, UV detection is often used by laboratories for protein quantitation. To achieve reliable quantitative results, reproducible chromatographic separation and good resolution of all analytes of interest are required. As shown in Figure 3, the UPLC chromatographic system achieved completely baseline resolution for the LC and HC of the mAb, demonstrating great performance and compatibility for UV analysis.
On the other hand, MS analysis is more sensitive, and the molecular weight information yields more definitive characterizations of low-abundance species. As depicted in Figure 3, low-abundant antibody fragments and modified products are observed in the LC/MS chromatogram but not in the UV chromatogram. One way to overcome the limitation of LC-UV sensitivity is to increase the amount of sample injected onto the column. However, even with the observations of the low intensity peaks in the UV chromatogram, their molecular identities would still not be revealed without the information from MS or other characterization techniques.
Conclusion
In this application note, we have demonstrated an on-line UPLC-UV/MS methodology that is capable of resolving and analyzing a variety of species contained in the sample preparation of a reduced IgG1 monoclonal antibody. The method relies on a robust and sensitive ESI-TOF mass spectrometer, the LCT Premier XE, to provide accurate mass measurement for the mAb subunits and fragments so in-depth analyses on the mAbs are obtained.
In addition, a reproducible high-resolution UPLC chromatographic system has been coupled with on-line dual UV and MS detectors to provide an integrated LC-UV/MS system solution for easy protein analysis. The system will enable biopharmaceutical organizations to quickly respond to the increasing demands on the detailed characterization of therapeutic antibody drugs to ensure the production of safe, effective and reproducible products.
Although LC/MS data are the focus in the current study, LC/UV data are also acquired to demonstrate the suitability of the system should a need for quantitative analysis via UV arises. More importantly, this LC-UV/MS method will empower biopharmaceutical organizations to compare their old approved LC/UV method with LC/MS method in a single run and to address the new regulatory requirements.
References
- Rapid Profiling of Monoclonal Intact Antibodies by LC/ESI-TOF MS. Waters Application Note. October 2007. 720002393.
- Rapid Screening of Reduced Monoclonal Antibodies by LC/ESI-TOF MS. Waters Application Note. October, 2007. 720002394.
- Characterization of an IgG1 Monoclonal Antibody and Related Sub-Structures by LC/ESI-TOF MS. Waters Application Note. March, 2007. 720002107.
720002919, January 2009