• Application Note

Investigating the Applicability of Direct Analysis and Ion Mobility TOF MS for Environmental Analysis

Investigating the Applicability of Direct Analysis and Ion Mobility TOF MS for Environmental Analysis

  • Michael McCullagh
  • Ramesh Rao
  • Waters Corporation

Abstract

This application note investigates the use of Direct Analysis (DA) combined with IMS/MS, where the samples of interest are directly infused and the benefits of IMS are explored. Here, we illustrate how mobility resolution is used to separate four pesticides with the same nominal mass; hence, how molecule shape can be used to produce mobility separation. In addition, the separation power of mobility is enhanced using CO2 as the mobility drift gas.

Benefits

  • Combining direct analysis with the orthogonal separation produced by ion mobility extends the applicability of direct analysis techniques.
  • Separation from matrix interference is achieved without chromatography.
  • Greater confidence in correct elemental composition assignment and structural elucidation data are obtained with routine mass measurement errors of <2 ppm.
  • Isobaric species are separated with ion mobility, and the corresponding individual MS and MS/MS spectra can be generated after mobility separation is achieved.
  • CO2 is used as a drift gas to enhance the ion mobility resolution.

Introduction

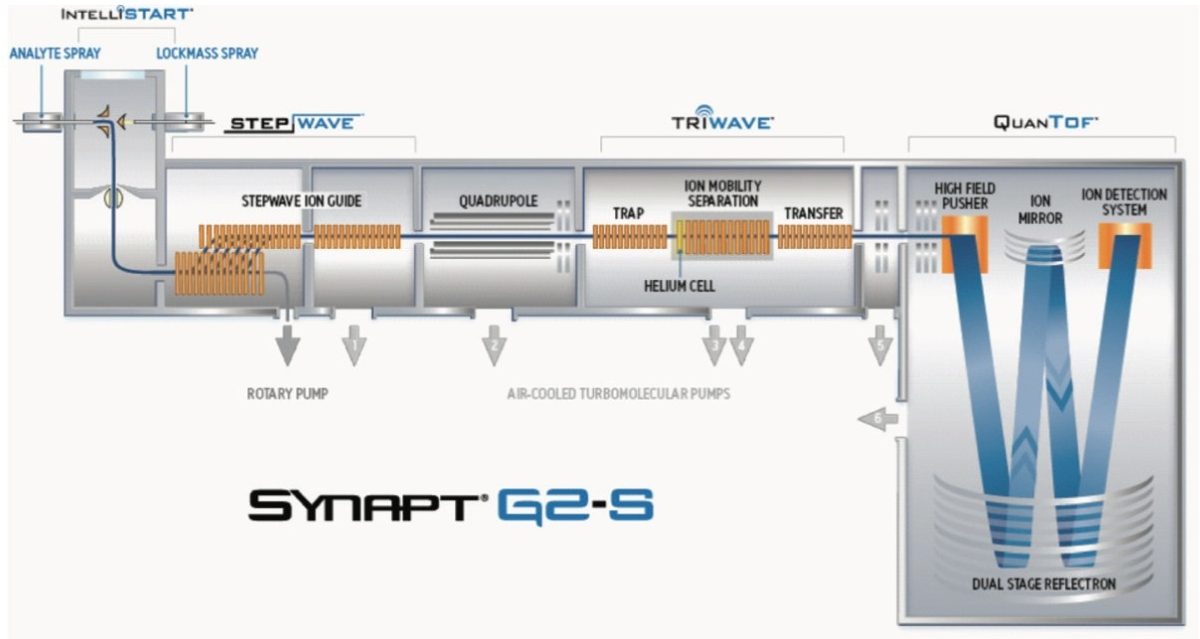
Interest in ion mobility separation continues to increase since the advent of the first commercially available ion mobility mass spectrometer (SYNAPT HDMS, Waters Corp), that used a travelling wave approach to generate ion mobility separations (IMS). Technology advances have since brought about an improved detection system, increased ion mobility resolution, and improved sensitivity (StepWave) from which the Waters SYNAPT G2-S is comprised. These continued improvements give greater access to the analytical chemist to overcome their analytical challenges using ion mobility spectrometry in combination with mass spectrometry. 

This application note investigates the use of Direct Analysis (DA) combined with IMS/MS, in this case the samples of interest are directly infused and the benefits of IMS are explored. There are a plethora of direct analysis techniques that ion mobility can be combined with such as ASAP, DART and DESI, where using ion mobility, separation can be produced. 

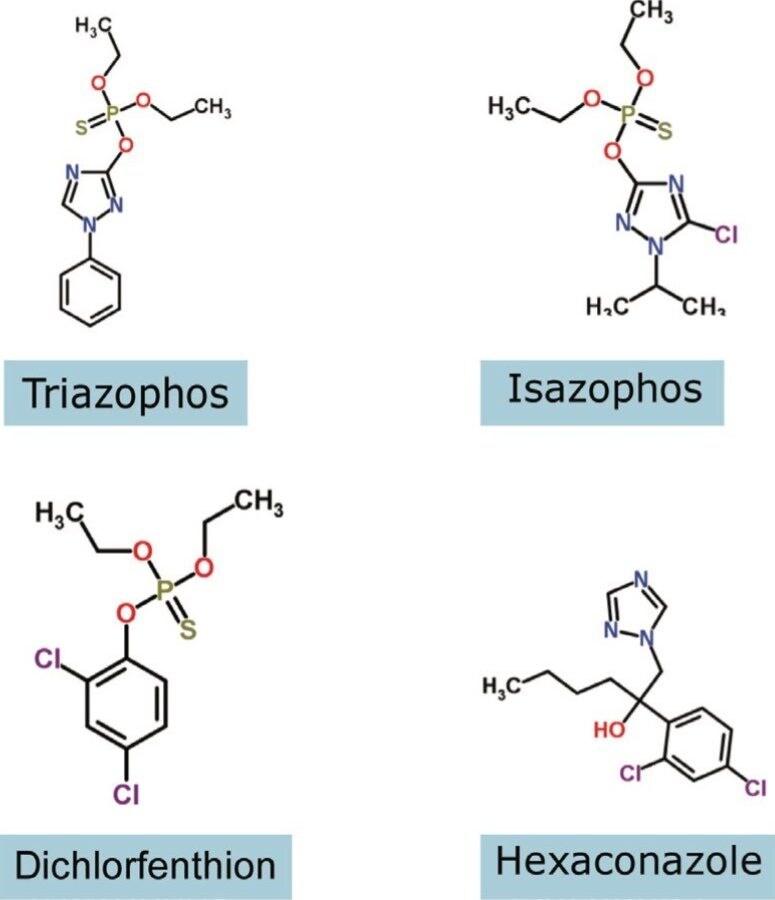
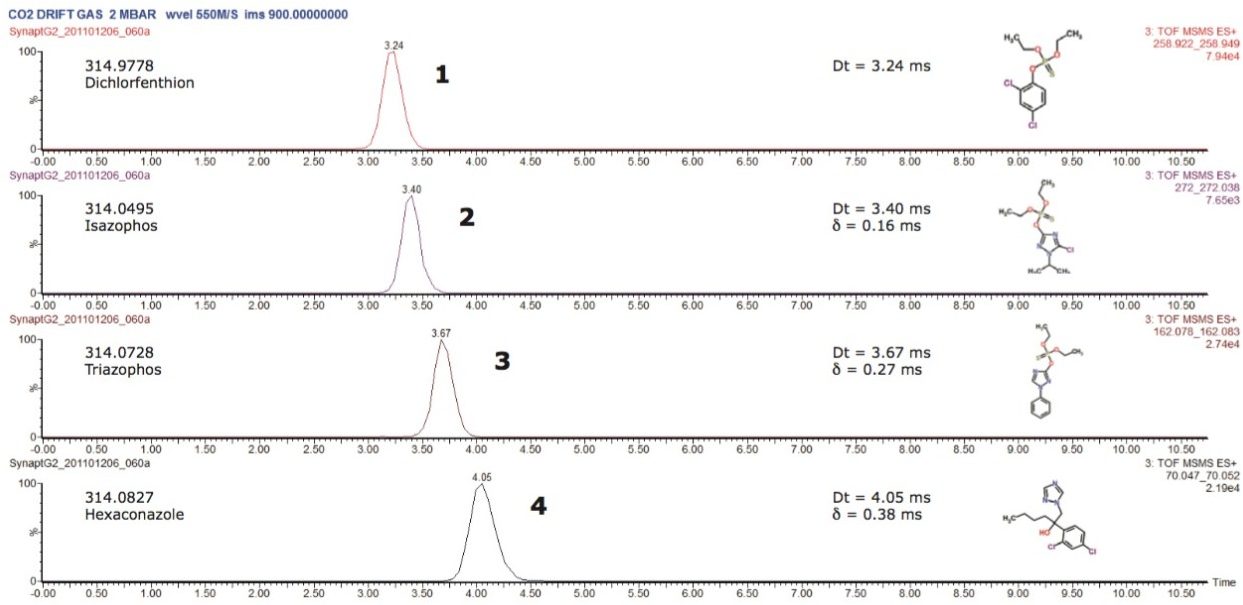
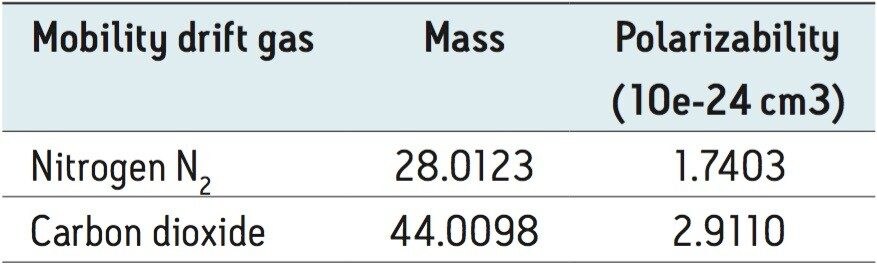
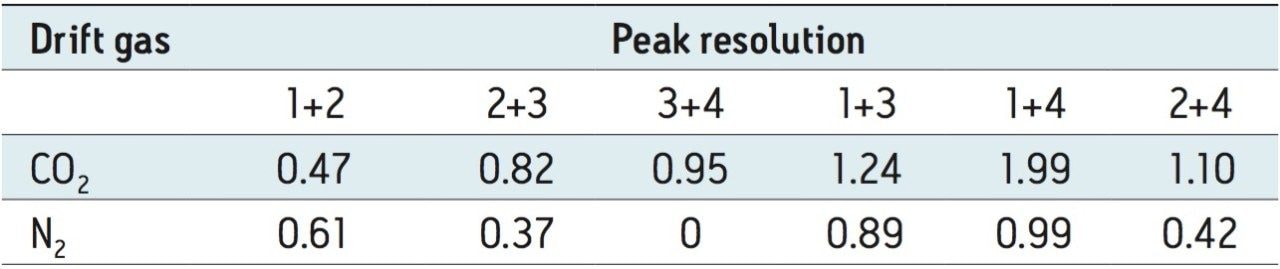
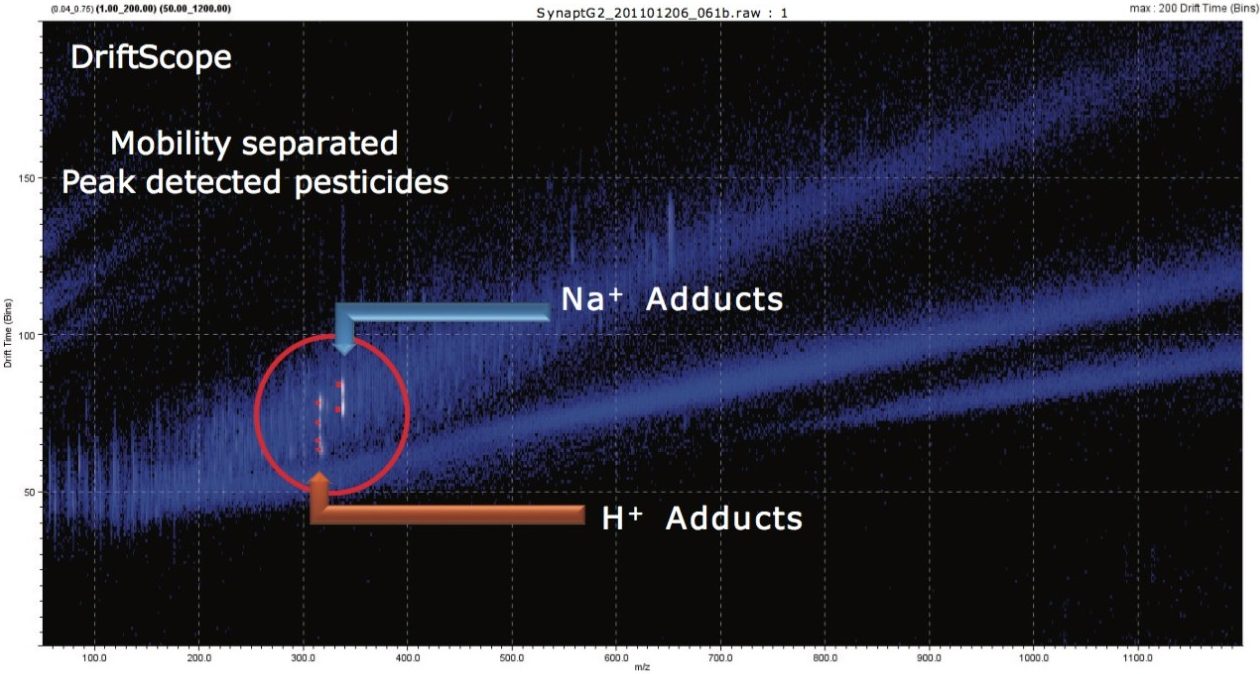
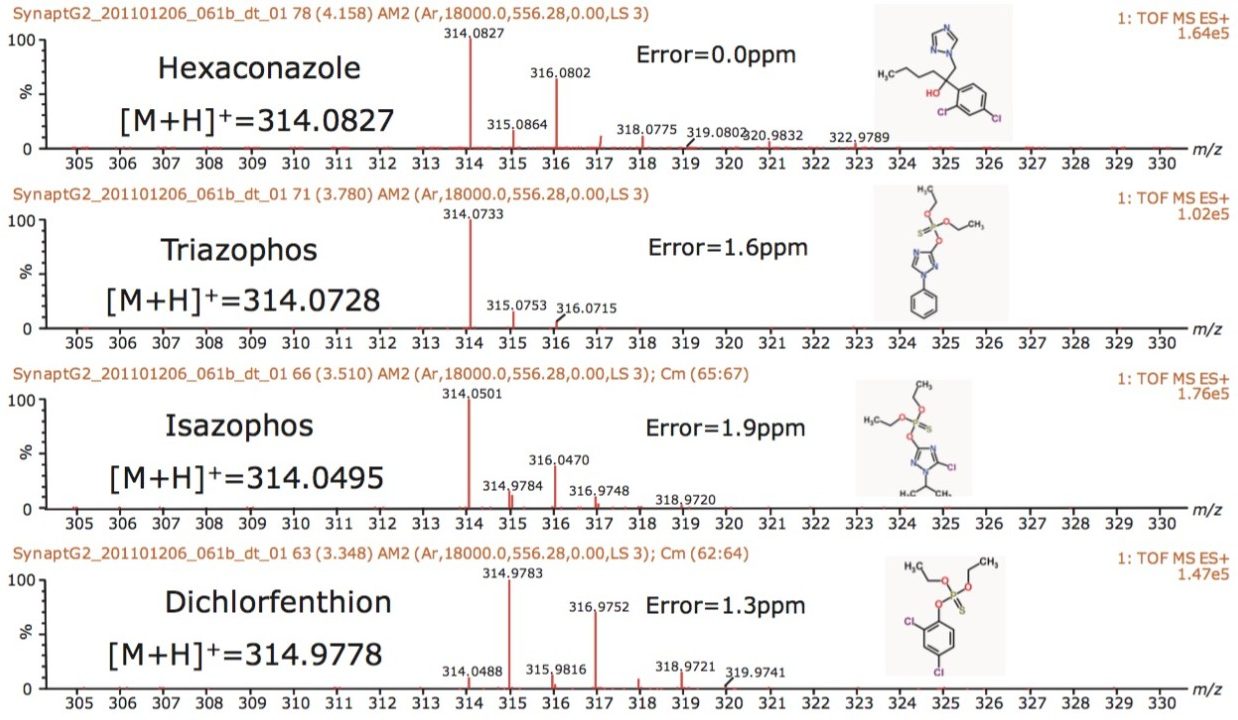
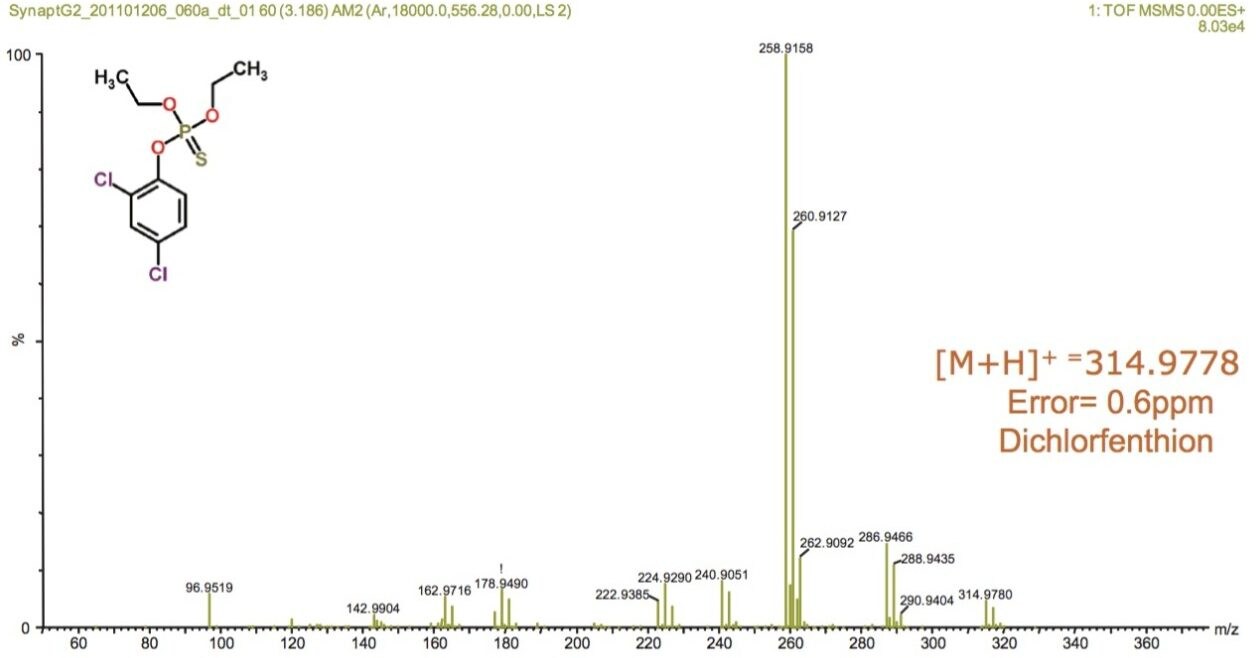
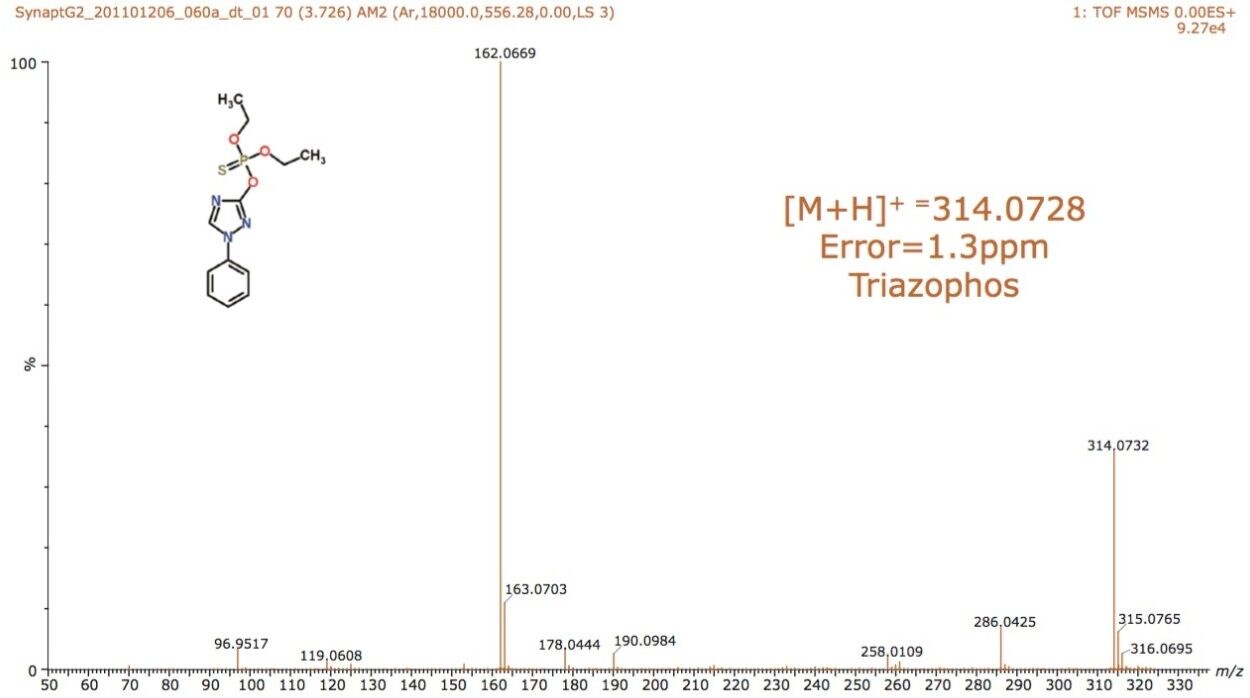
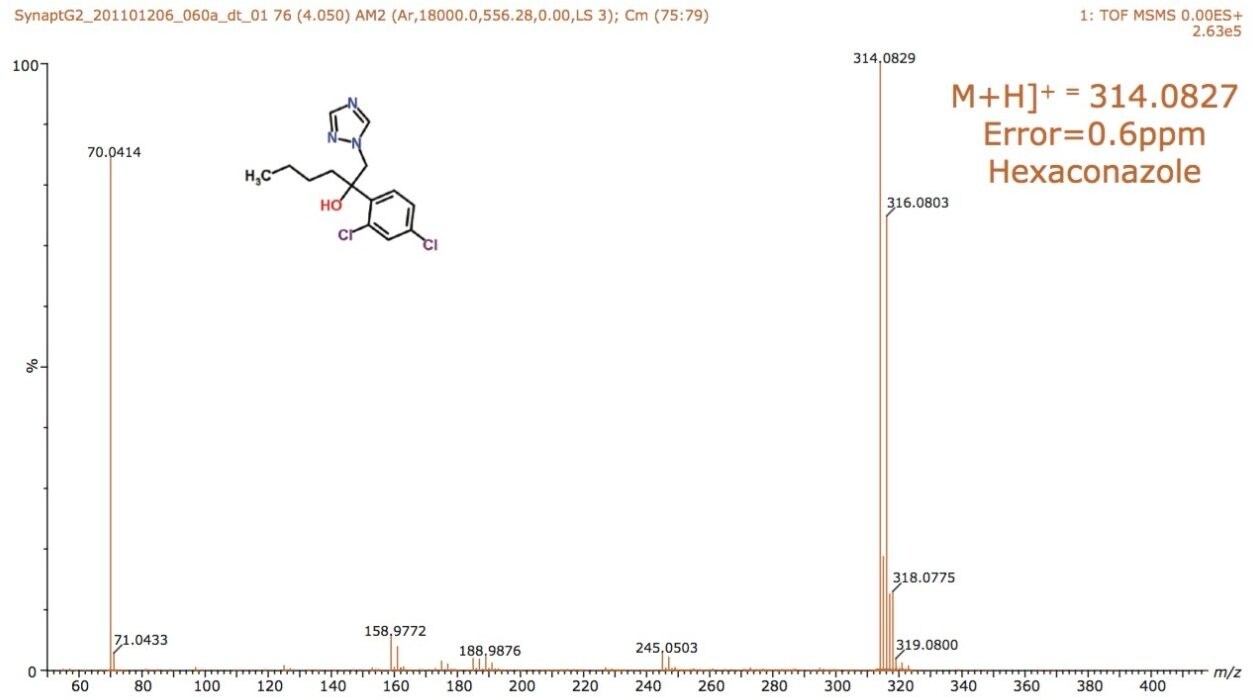
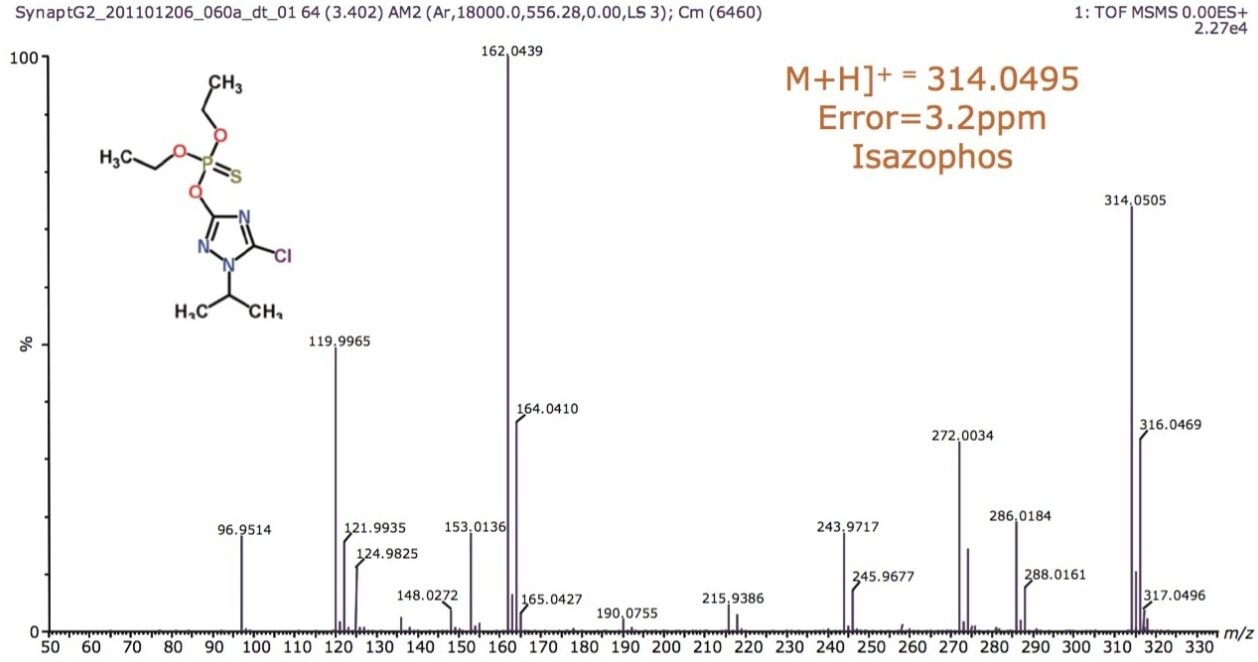
DA/IMS/MS offers a route to rapid screening of known pesticides, whereby minimal sample preparation is required. The mobility separation is combined with the specificity of accurate mass measurement <1 ppm (high resolution mode), as well as the ability to obtain MS/MS structural elucidation data on the mobility resolved analytes. Here, we illustrate how mobility resolution is used to separate four pesticides with the same nominal mass; hence, how molecule shape can be used to produce mobility separation. In addition, the separation power of mobility is enhanced using CO2 as the mobility drift gas.1

Figure 1. Schematic of SYNAPT G2-S. 

Experimental

MS conditions

MS system:

SYNAPT G2-S

Ionization mode:

ESI+

Capillary and cone voltage:

Varied to give optimum signal

Desolvation temp.:

200 °C

Reference mass:

Leucine enkephalin, [M+H]+ = 556.2771

Acquisition range:

50 to 1200 m/z

Acquisition rate:

1 spectra/s

Collision energy ramp:

15 to 25 eV

Resolution:

18,000 FWHM (Res Mode)

Wave velocity:

550 m/s

Pulse height:

40 V

Direct Analysis:

Infusion 5 μL/min

Analytes:

Hexaconazole, izasophos, dichlorfenthion, and triazophos

Results and Discussion

The structures of pesticides of interest were analyzed using direct analysis combined with IMS/MS and IMS/MS/MS, as shown in Figure 2. They have the same nominal mass and charge state, but different elemental composition and, hence, shape. The pesticides were directly analyzed using infusion. The mobility chromatograms illustrating the drift times for hexaconazole, izasophos, dichlorfenthion, and triazophos using N2 as the drift gas are shown in Figure 3. This data demonstrates that even without chromatography these components can be partially resolved using peak capacity provided by ion mobility, with arrival times varying between 1.84 and 2.11 ms.

Figure 2. Structures of pesticides analyzed with direct analysis and IMS.
Figure 3. Mobility chromatograms illustrating the arrival times for pesticides shown using N2 .

When performing IMS, the ion separation occurring in the travelling wave ion mobility (TWIM) drift cell is  determined by the charge state, mass, shape, drift gas polarizability, as well as interaction between ion and neutral gas molecules. Increasing the polarizability of the drift gas resulted in an increase in the separation power of TWIM, in this application. This is illustrated in Figure 4, where mobility chromatograms show the drift times for pesticides analyzed using CO2 as the drift gas of choice. The arrival times varied between 3.24 and 4.05 ms. The comparison between physical properties of the ion mobility drift gases utilized is shown in Table 1. A comparison of the peak resolution obtained using (Rs=1.18(ta-tb)/W0.5,a+W0.5,b) is shown in Table 2. The resolution between peaks 1 and 2 showed a slight decrease in resolution, but in all other cases peak resolution increased using CO2. The pesticides were infused as a mixture and the peak detected components, shown in Figure 5, can be seen in DriftScope showing arrival time versus m/z for the pesticides with CO2 as the drift gas. For hexaconazole and triazophos, sodiated adducts were observed and mobility separated. It can be difficult to avoid adduct  formation, particularly in the presence of matrix. However, it is possible to provide further identification  confidence by using the ion mobility, i.e. a second identification point from the drift time of the adduct formed.

Figure 4. Mobility chromatograms illustrating the arrival times for pesticides shown using CO2 as the drift gas.
Table 1. Physical properties comparison where ion mobility drift gases were utilized.
Table 2. A comparison of peak resolution obtained for the direct analysis of four isobaric pesticides using N2 and CO2 drift gases.
Figure 5. Peak detected pesticides in DriftScope showing arrival time versus m/z for the pesticides of interest. CO2 is the drift gas.

The peak capacity generated using ion mobility enables the accurate mass spectra of each single component to be obtained; therefore, completely resolved from any background ions, as shown in Figure 6. The single component accurate mass spectra were generated from the mobility chromatograms extracted using DriftScope. Accurate mass measurements with <2 ppm error were achieved, and elemental compositions proposed based on the potential to be comprised of the C,H,N,O,P,S and Cl. The exact masses of the [M+H]+ species are shown in conjunction with the accurate mass spectra generated and mass measurement error obtained. In all cases, each target pesticide was identified correctly as the most probable analyte, based on accurate mass and isotopic pattern within the elemental composition calculator.

Figure 6. Single component accurate mass spectra generated from the mobility chromatograms extracted using DriftScope, as shown in Figure 5.

The schematic of the SYNAPT G2-S, shown in Figure 1, reveals two regions labelled “Trap” and “Transfer” before and after the ion mobility T-Wave. Collision energies can be applied in either of these regions. After mobility separation was achieved, a collision energy ramp was applied in the Transfer region. This enabled the single component MS/MS spectra to be obtained for all pesticides when infused as a mixture. The individual characteristic MS/MS spectra obtained are shown for dichlorfenthion, triazophos, hexaconazole, and isazophos in Figures 7 through 10, respectively. Using quadrupole technology selectivity, typical mass resolution would result in a 1 Da span across the mass selected when performing MS/MS. Without mobility separation, it would not be possible to obtain the single component MS/MS spectra as shown for the pesticides analyzed using direct analysis. Conventional infusion of all four pesticides would result in an MS/MS product ion spectrum comprised of all four analytes. In this case, the resolving power of the quadrupole has been used to select m/z 314 where only this mass undergoes mobility separation, resulting in the mobility separation of the four pesticides shown, followed by fragmentation of each individual species. Excellent mass accuracy was obtained, with mass measurement errors of <3 ppm. The fragments are generated from the mobility resolved species and will, therefore, have the same drift time. In Figures 3 and 4, a unique mass fragment was selected to illustrate the drift times of each of the four pesticides. This approach further confirmed the identification of the pesticides determined to be unresolved when N2 was used as a drift gas utilizing IMS/MS.

Figure 7. Single component accurate mass MS/MS spectrum of dichlorfenthion generated after IMS of the infusion of a pesticides mixture, as shown in Figure 2.
Figure 8. Single component accurate mass MS/MS spectrum of triazophos generated after IMS of the infusion of a pesticides mixture, as shown in Figure 2.
Figure 9. Single component accurate mass MS/MS spectrum of hexaconazole generated after IMS of the infusion of a pesticides mixture, as shown in Figure 2.
Figure 10. Single component accurate mass MS/MS spectrum of isazophos generated after IMS of the infusion of a pesticides mixture, as shown in Figure 2.

Ion Mobility Spectrometry provides an extra dimension of fast, gas phase, ion separation, providing higher ion definition and analytical specificity. Using DA/IMS/MS/MS, four pesticides were profiled using a SYNAPT G2-S. The results demonstrate that HDMS can provide a route to specific and unambiguous identification, even where no chromatographic separation exists. Future studies will utilize UPLC-IMS/MS for screening pesticides in complex matrices to further illustrate the benefits of the enhanced peak capacity enabled using IMS.

Conclusion

  • Direct analysis infusion mobility separation of pesticides with the same nominal mass were utilized to illustrate the separation that can be achieved with ion mobility.
  • Comparative application data where N2 and CO2 drift gases were used to perform T-wave IMS were generated, where CO2 was shown to improve the mobility separation for this application.
  • Single-component MS spectra have been produced from the mobility separation generated for the pesticides studied.
  • Mass measurement errors of <2 ppm have been illustrated.
  • Characteristic single-component MS/MS spectra were produced from the mobility separation of the pesticides analyzed.
  • The study undertaken warrants further investigation of the enhanced peak capacity that UPLC-IMS/MS can enable in pesticide screening applications.
  • The application illustrates how ion mobility can be used to increase peak capacity with any direct analysis technique.

References

  1. Eberlin MN, Lali PM, Nachtigall FM, Riccio MF, de Sa GF, Daroda RJ, de Souza V, Campuzano I, Souza G HMF.4 Improving Ion Mobility Separation By Increasing Drift-Gas Polarizability. Waters Technical Note No. 720003201EN, 2009.
  2. Asbury GR, Hill HH. Using Different Drift Gases To Change Separation Factors in Ion Mobility Spectrometry. Anal. Chem. 2000; 72: 580.

720004465, October 2012

Voltar ao início Voltar ao início