• Application Note

Profiling of Flavonoid Isomers in Highly Complex Citrus Juice Samples Using UPLC Ion Mobility Time of Flight Mass Spectrometry

Profiling of Flavonoid Isomers in Highly Complex Citrus Juice Samples Using UPLC Ion Mobility Time of Flight Mass Spectrometry

  • Michael McCullagh
  • Kieran J. Neeson
  • Antonietta Gledhill
  • Waters Corporation

Abstract

In this application note, the use of the ACQUITY UPLC system combined with a SYNAPT G2-S Mass Spectrometer, to provide specific and unambiguous identification of the components present in citrus juices. 

Benefits

  • The analysis of complex samples is enhanced by the orthogonal separations produced by ion mobility.
  • Accurate mass measurement of <2 ppm provides specific elemental composition information and, therefore, confidence in structural elucidation data.
  • A factor of ten increase in peak capacity provided by ion mobility mass spectrometry combined with UPLC enables isomers and conformers previously unobserved to be uniquely identified.
  • Identification points based on retention time, precursor ion accurate mass measurements, fragmentation data with accurate mass measurements, and ion mobility separation drift times can be generated in one analysis.
  • Utilizing HDMS as an analytical approach has the potential to provide a greater understanding of current fruit juice products.

Introduction

The presence of flavonoids in citrus juices has attracted attention because of their biological and physiological benefits. Flavonoids are one of the largest and most widespread classes of compounds that possess diverse pharmacological and biological properties. Such attributes mean many plant species containing flavonoids may be used as functional foods or phytomedicines. The role of flavonoid compounds as markers is important, and identification is a challenge due to sample complexity. Flavonoids are related to the prevention of cancerous processes, reduced risk of some chronic diseases, prevention of cardiovascular disorders, as well as anti-viral, anti-microbial, and anti-inflammatory activities, thus, emphasizing the reason for interest in flavonoids and the constituents of fruit juices. Typical sources of flavonoids are fruits, vegetables, and cereals. Considering these associated health benefits, the impact of food processing and preparation on flavonoid content demands a greater understanding. It is, therefore, essential to be able to profile all major and minor components of fruit juice to enable a better understanding of dietary consequences. Also, the impact of important factors that can influence consumers, such as appearance and taste, influence the commercial value of a product.1

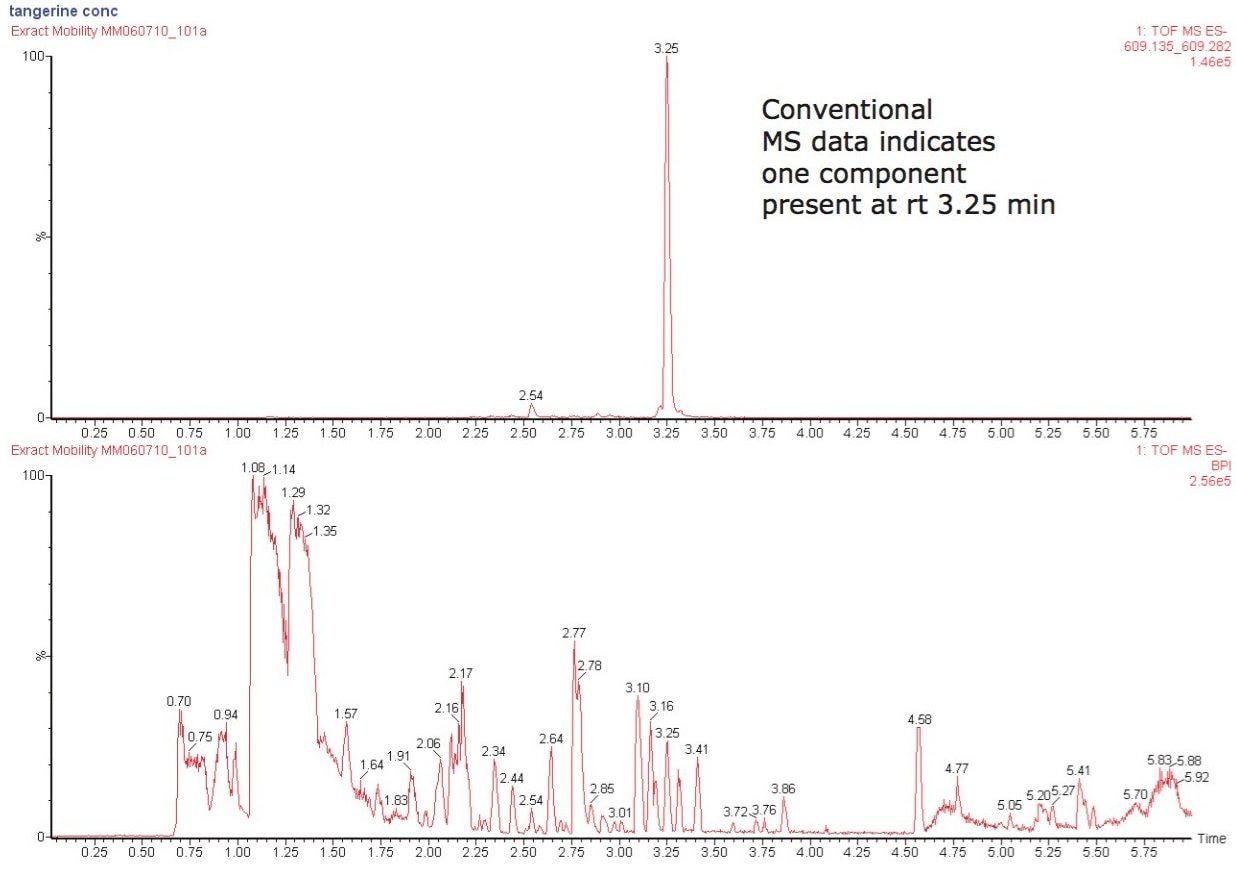
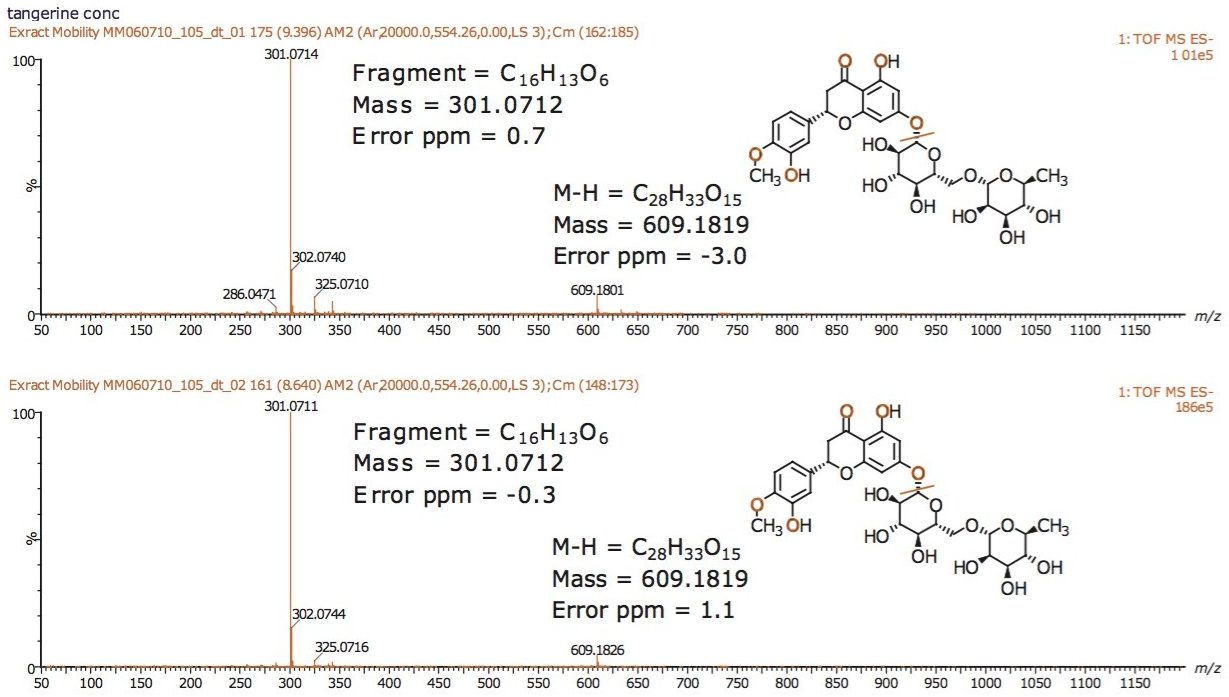
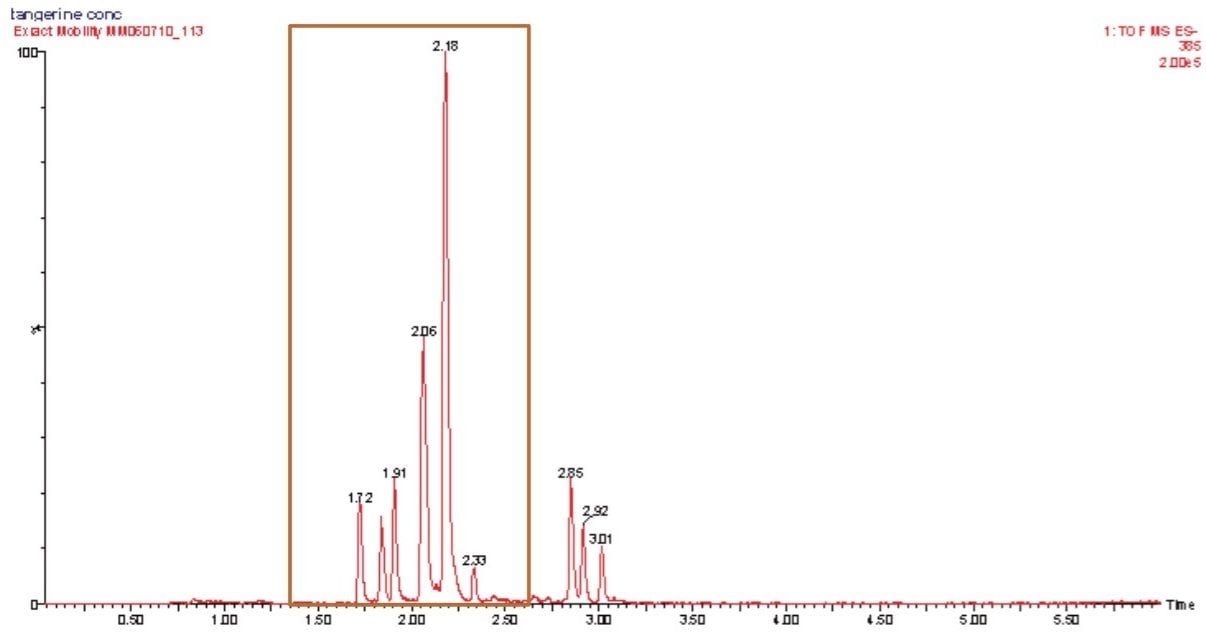
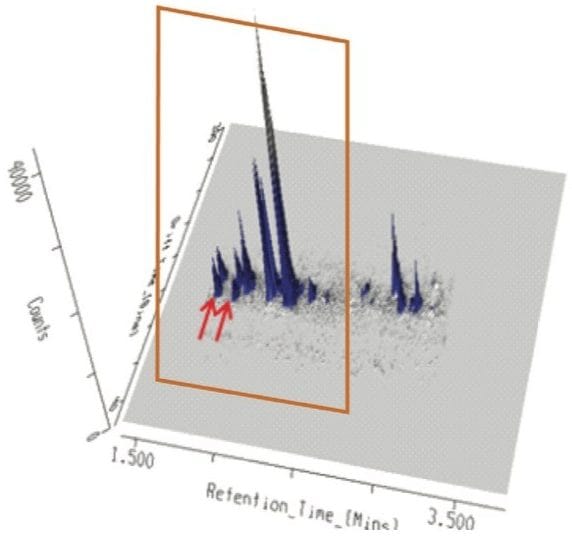
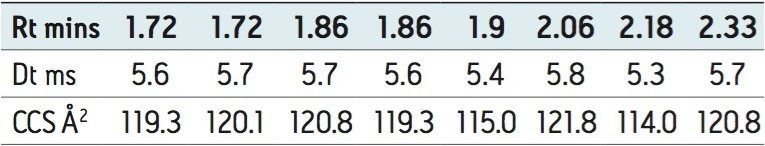
Using HPLC-MS to profile flavonoids has become more commonplace. In this application note, the use of a Waters ACQUITY UPLC system combined with a SYNAPT G2-S Mass Spectrometer, to provide specific and unambiguous identification of the components present in citrus juices. High Definition Mass Spectrometry (HDMS) has been utilized to profile citrus juice products, and this technique offers some unique advantages for profiling complex mixtures. It is a combination of high resolution mass spectrometry and high efficiency ion mobility based measurements and separations. Ion mobility spectrometry (IMS) is a rapid, orthogonal gas separation phase technique that provides another dimension of separation within an LC time frame, offering higher ion definition and analytical specificity. Compounds can be differentiated based on size, shape, and charge, as well as mass.

Experimental

Sample preparation

Tangerine juice samples were filtered through a 45-μm filter.

UPLC conditions

LC System:

ACQUITY UPLC

Column:

ACQUITY UPLC HSS T3 150 x 2.1 mm, 1.7 μm

Column temp.:

40 °C

Flow rate:

0.4 mL/min

Mobile phase:

MeCN (B): H2O (0.2% HCOOH) (A)

Gradient

Time (min)

Flow rate

%A

%B

Initial

0.4

99

1

0.75

0.4

95

5

5

0.4

5

95

5.5

0.4

99

1

Injection volume:

10 μL

MS conditions

MS System:

SYNAPT G2-S

Ionization mode:

ESI - at 2.7 kV

Sample cone voltage:

30 V

Desolvation temp.:

650 ˚C

Reference mass:

Leucine enkephalin, [M-H]- =554.2615

Acquisition range:

50 to 1200 m/z

Acquisition rate:

5 spectra/sec

Collision energy ramp:

33 to 45 eV

Resolution:

18,000 FWHM

IMS T-Wave velocity:

550 m/s

IMS T-Wave pulse height:

40 V

Results and Discussion

Using a SYNAPT G2-S with UPLC-IMS/MSE functionality, the components of tangerine juice were profiled using negative ion mode electrospray. IMS provides an extra dimension of fast, gas phase, ion separation, with higher ion definition and analytical specificity. IMS has been described as “gas phase electrophoresis.” The profiling study undertaken clearly shows the benefits of using HDMS. Figure 1 shows the conventional negative ion mode base peak intensity (BPI) chromatogram and m/z 609 extracted mass chromatogram obtained for the analysis of undiluted tangerine juice. The corresponding accurate mass spectrum is shown in Figure 2. The accurate mass spectrum generated elemental compositions of C28H33O15 (1.1 ppm error) and C16H13O6 (0.7 ppm error). Utilizing the elemental composition generated, a ChemSpider search was performed; whereby, a likely candidate for the component at 3.25 min was believed to be hesperetin 7-O-rutinoside (hesperidin). Under the conditions used, the peak at m/z 301.0714 was caused by source fragmentation and occurred due to the loss of the disaccharide moiety. The fragment observed, and accurate mass/elemental composition generated aided structural elucidation.

Figure 1. Negative ion mode BPI chromatogram, and m/z 609 extracted mass chromatogram obtained for the analysis of tangerine juice.
Figure 2. Accurate mass spectrum for component (hesperidin) determined to be present in tangerine juice at retention time 3.25 min.

When this data was viewed through the MSE data viewer, the component at 3.25 min proved to be more interesting, and was actually comprised of two components. The MSE data viewer displayed the peak detected BPI for tangerine juice with mobility data revealed two components present at 3.25 min, as shown in Figure 3. The precursor ion and fragmentation spectra are generated from two different drift times, and the resulting 3D data display for the ion mobility separation achieved for these isobaric components are shown in Figure 4. The MSE data viewer enables time-aligned high and low energy spectra generated through MSE acquisitions to be seamlessly viewed. In addition, where mobility separations have been generated, the mobility separation and spectra can be accessed. The software also enables isobaric components with different drift times, but the same retention time, to be visualized at the click of a button. Utilizing this filter, it was possible to see instantly that within this extremely complex sample, comprised of 930 major and minor analytes, the peak at 3.25 min was actually two components. Drift times of 8.8 ms and 9.5 ms were observed, allowing the estimated T-Wave collision cross sections (CCS) of the components to be determined to be 164.6Å2 and 174.1 Å2, respectively.

Figure 3. MSE data viewer showing the peak detected BPI for tangerine juice with mobility data showing two components present at 3.25 min.
Figure 4. 3D data display for the ion mobility separation of isobaric components determined to be present at 3.25 min for the analysis of tangerine juice. The observed drift times, and calculated collision cross section areas are shown for each component.

UPLC-IMS/MSE was performed where collision induced dissociation (CID) fragmentation was performed in the “transfer” region of the “Triwave”; hence, structural elucidation data was generated for the two IMS isobaric components in 3.25 min. The MSE fragmentation spectra for the mobility resolved isobaric components is shown in Figure 5, displaying the same fragmentation patterns. Under these conditions, a minor fragment at m/z 463 was observed, which can be attributed to the loss of the rhamnose sugar unit from the m/z 609 precursor ion and then m/z 301 from the further loss of the glucose unit to generate the aglycone at m/z 301. The data generated indicates that the conformers of hesperidin were observed.

Figure 5. MSE fragmentation spectra for the mobility resolved isobaric components determined to be present at 3.25 min for the analysis of tangerine juice.

A further example is shown in Figure 6, where the conventional negative ion mode m/z 385 extracted mass chromatogram obtained for the analysis of tangerine juice can be seen. The corresponding 3D mobility data is displayed in Figure 7. The first two peaks of the conventional extracted mass chromatogram were comprised of four IMS components. Examples of the estimated T-wave CCS values generated, shown in Table 1, indicate these values can be utilized to provide further characteristic profiling data. 

The results obtained indicate that IMS can provide increased peak capacity, and more component identification. IMS combined with MSE enables specific and unambiguous identification of mobility separated components. 

Figure 6. Negative ion mode m/z 385 extracted mass chromatogram obtained for the analysis of tangerine juice with the initial six components selected for further data interrogation.
Figure 7. 3D mobility data display obtained for negative ion mode m/z 385 extracted mass chromatogram for the analysis of tangerine juice. Peaks at 1.77 and 1.85 min are comprised of two IMS components.
Table 1. Illustration of component mapping data that can be generated using ion mobility separations, component drift times, and collision cross sections shown with the corresponding retention time.

Conclusion

  • SYNAPT G2-S technology enabled the true complexity of tangerine juice to be observed using UPLC-IMS/MSE.
  • Confidence in the structural elucidation is gained from the accurate mass measurement of <2 ppm and elemental compositions generated.
  • Individual MS and MSE fragmentation spectra were obtained for the IMS conformers of hesperidin which are chromatographically co-eluting.
  • It was possible to generate retention times, precursor ion accurate mass measurements, fragmentation data with accurate mass measurements, ion mobility separations, and, hence, drift times with estimated T-Wave CCS values.
  • HDMS can provide access to specific and unambiguous identification, enabling the unequivocal distinction of flavonoid isomers within complex samples.
  • More specific information and confidence can be obtained in fragmentation studies for numerous components simultaneously.
  • Complex sample analysis benefits from the increased peak capacity produced by ion mobility.
  • MSE data viewer provides seamless processing and visualization of ion mobility data.
  • The approach used in this study has the potential to give greater understanding of current fruit juice products, such as industrial juices, freshly squeezed, different species, and the impact of environmental and adulteration studies. In turn, the opportunity exists to enhance future products to obtain the maximum health benefits and commercial value.

References

  1. Gattuso G*, Barreca D, Gargiulli C, Leuzzi U, Caristi C. Flavonoid Composition of Citrus Juices. Molecules 2007; 12(8): 1641-1673. *Dipartimento di Chimica Organica e Biologica, Università di Messina, Messina, Italy.

Featured Products

720004462, October 2012

Voltar ao início Voltar ao início