• Application Note

Quantification of Fluticasone Propionate and Salmeterol Xinafoate in Plasma at the Sub pg/mL Level Using UPLC-MS/MS

Quantification of Fluticasone Propionate and Salmeterol Xinafoate in Plasma at the Sub pg/mL Level Using UPLC-MS/MS

  • Joanne Mather
  • Kendon S. Graham
  • Diego Rodriguez Cabaleiro
  • Stuart Chadwick
  • Paul D. Rainville
  • Robert S. Plumb
  • Waters Corporation

Abstract

Separate analytes using a high-sensitivity method to achieve lower limits of quantitation at the sub pg/mL level. The method described alleviates the need for evaporation to dryness and allows for increased sensitivity.

Benefits

Alleviates the need for evaporation to dryness and allows for increased sensitivity.

Introduction

Fluticasone propionate (structure shown in Figure 1) is a glucocorticoid indicated for the prophylactic treatment of asthma. It is administered via inhalation from an aerosol-type of device or power inhaler. The activity of fluticasone propionate when inhaled is due to the parent drug, with any metabolites formed being  2000 times less active. Fluticasone propionate is available in a combined preparation with salmeterol xinafoate marketed under trade names such as Advair HFA, Seretide, and Faxair. The smallest dosage is 100 mcg/50 mcg fluticasone/salmeterol as a dry powder inhaler, or 45 mcg/21mcg as a  metered dose inhaler. 

Figure 1. Structures of fluticasone propionate and salmeterol xinafoate. 

Studies using oral dosing of labeled and unlabeled drugs have demonstrated  that the oral systemic bioavailability of fluticasone propionate is negligible (<1%). This is primarily due to incomplete absorption and pre-systemic metabolism in the gut and liver, with the only reported circulating metabolite being the 17β-carboxylic acid derivative. Plasma fluticasone propionate concentrations, when delivered nasally, show a Cmax average of 11.9 pg/mL  and AUC(0-t) average of 8.43 pg hr/mL. 

Due to the low circulatory levels of fluticasone propionate, it is necessary to conduct a high-sensitivity assay, in the <10 pg/mL range, to correctly define the pharmacokinetics in plasma. Previous reports have demonstrated assays in the  10 to 500 pg/mL range for fluticasone propionate in plasma.

In this application note, we show a high-sensitivity method for the analysis of fluticasone propionate in rat plasma. The lower limit of quantification (LLOQ) used were 0.750 and 0.375 pg/mL for fluticasone propionate and salmeterol xinafoate respectively; salmeterol was spiked in to plasma at half the concentration of fluticasone to reflect the dosage used in Advair HFA. The upper limit of analysis was 15.0 pg/mL for fluticasone propionate and 7.5 pg/mL for salmeterol xinafoate.

Experimental

LC Conditions

UPLC system:

ACQUITY UPLC

Column:

ACQUITY UPLC BEH C18 2.1 x 50 mm, 1.7 μm

Column temp.:

45 °C

Flow rate:

500 μL/min

Mobile phase A:

0.1% ammonium hydroxide

Mobile phase B:

90/10 Methanol/IPA

Gradient:

5% to 95% B /6 min

Injection volume:

50 μL

MS Conditions

MS system:

Xevo TQ-S

MS/MS transitions:

Fluticasone 501.3 > 293.3

salmeterol 416.4 > 232.2

Ionization:

ESI+

Capillary voltage:

1.5 KV

Collision energies:

16 eV fluticasone 20eV salmeterol

Informatics:

UNIFI Scientific Data Management System

A calibration line was prepared by spiking control solutions of fluticasone propionate and salmeterol xinafoate into blank control rat plasma. The calibration range was from 0.75 to 15.00 pg/mL for fluticasone propionate and 0.375 to 7.50 pg/mL for salmeterol xinafoate. 

The samples were prepared by solid phase extraction. 375 μL of plasma was diluted with aqueous solution containing Stable Label Isotope (SLI) internal standard for both analytes and mixed well. The samples were applied to an Oasis HLB μElution plate, washed with an organo-aqueous solution, and eluted in a solution of methanol-acetonitrile. This eluted solution was diluted with aqueous buffer prior to injection onto the ACQUITY UPLC/Xevo TQ-S System.

Results and Discussion

The LC-MS analysis of the fluticasone and salmeterol samples were performed on an ACQUITY UPLC System employing sub-2-µm particle technology coupled with a Xevo TQ-S Mass Spectrometer operated in MRM mode. A stable label isotope was used as the internal standard for both of the analytes in this study. The eluent from the solid phase extraction was directly injected onto the chromatography system, thus avoiding the need for evaporation and reconstitution.

The chromatography was operated in reversed-phase gradient mode and optimized to provide separation of the analytes of from the endogenous components in the sample and from each other. In this case it was determined that the use of a basic mobile phase (0.1% ammonium hydroxide at pH 10) gave the greatest sensitivity for both analytes. The data displayed in Figure 2 show the analysis of a 15 pg/mL standard. Here we can see that the two compounds were clearly resolved, with the fluticasone propionate eluting at with a retention time of 3.06 minutes, and the salmeterol xinofoate eluting with a retention time of 3.26 minutes. The overall analysis time was 5 minutes → injection to injection. The lower limit of quantification for fluticasone propionate in plasma was determined to be 0.750 pg/mL, and 0.375 pg/mL for salmeterol xinafoate. The chromatographic performance for both target analytes showed excellent peak shapes and resolution from endogenous peaks in the chromatogram. 

Figure 2. LC-MS/MS chromatogram of fluticasone propionate and salmeterol xinafoate and their internal standards in a SPE plasma extract 15.0 pg/mL /7.5 pg/mL levels respectively.

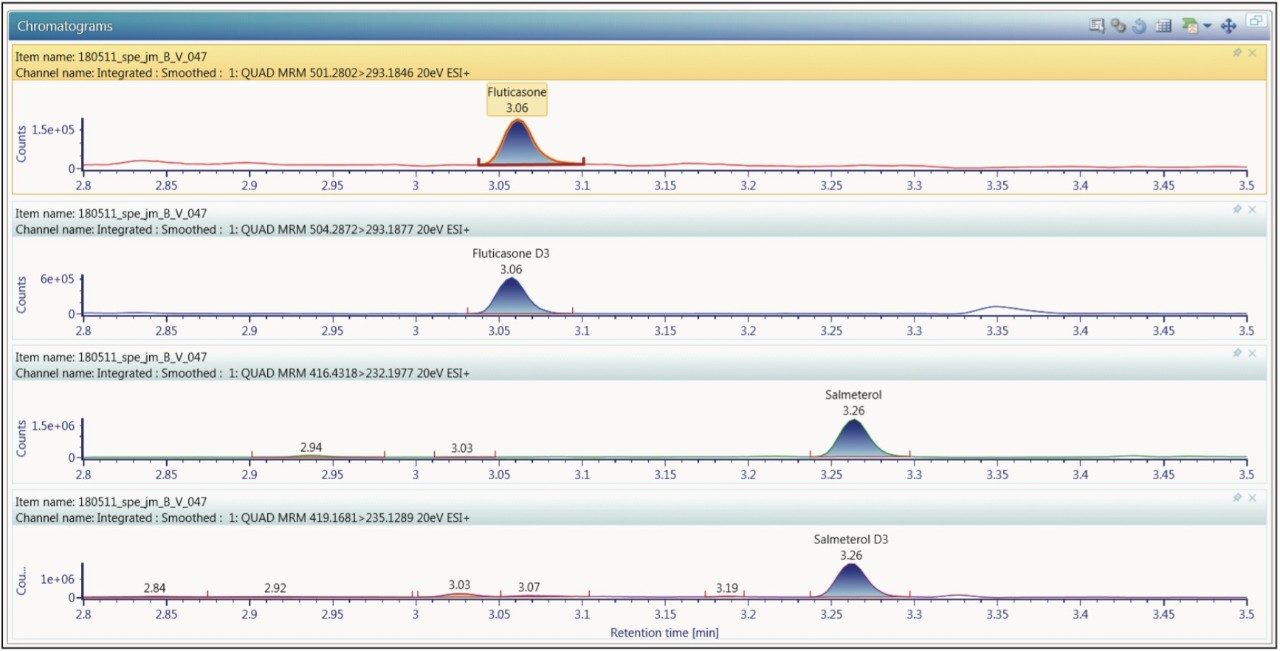
The sensitivity of a bioanalytical assay is dependent upon the efficiency of the extraction, the sharpness of the chromatographic peak, the separation of the analyte peak from co-eluting peaks in the chromatogram, and the sensitivity of the mass spectrometer. The Xevo TQ-S is equipped with a novel, state-of-the-art, ion transfer option that allows a greater number of ions to be sampled from the source and transferred to the mass analyzer. The sampling of more ions from the source would ordinarily mean the sampling of more chemical noise. However, with the Xevo TQ-S, its StepWave ion optics use two conjoined T-Wave ion guides to selectively extract the charged analyte ions from the neutral chemical. The neutral components are then directed to waste via the first pumping stage, allowing only the charged species to enter the analyzer. Using this approach it has been possible to increase the sampling of ion flux by a factor of 200, resulting in a significant increase in overall assay signal-to-noise, typically 10 to 30 fold over conventional instrumentation.

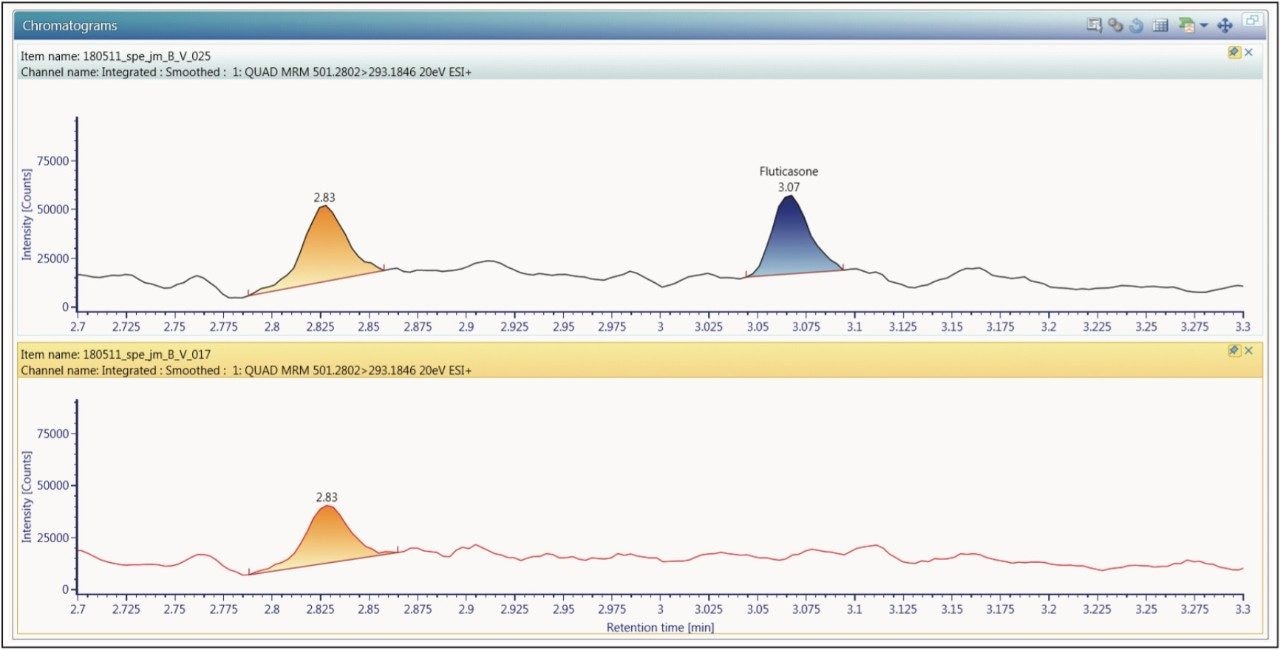
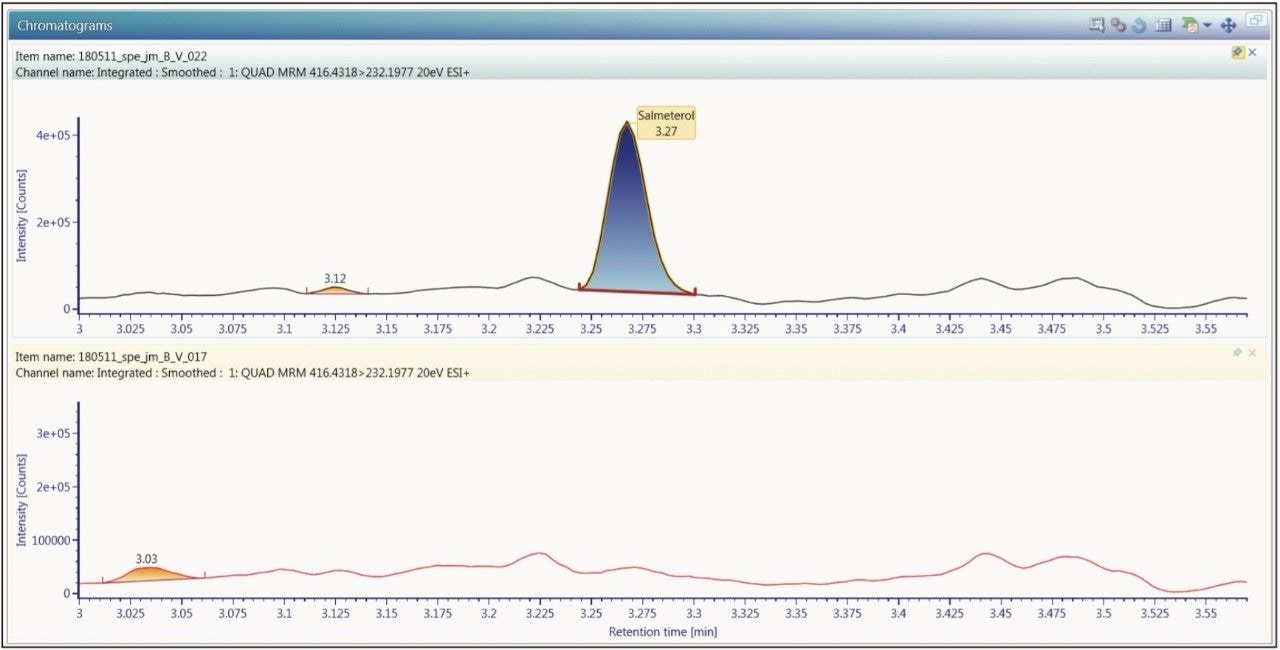
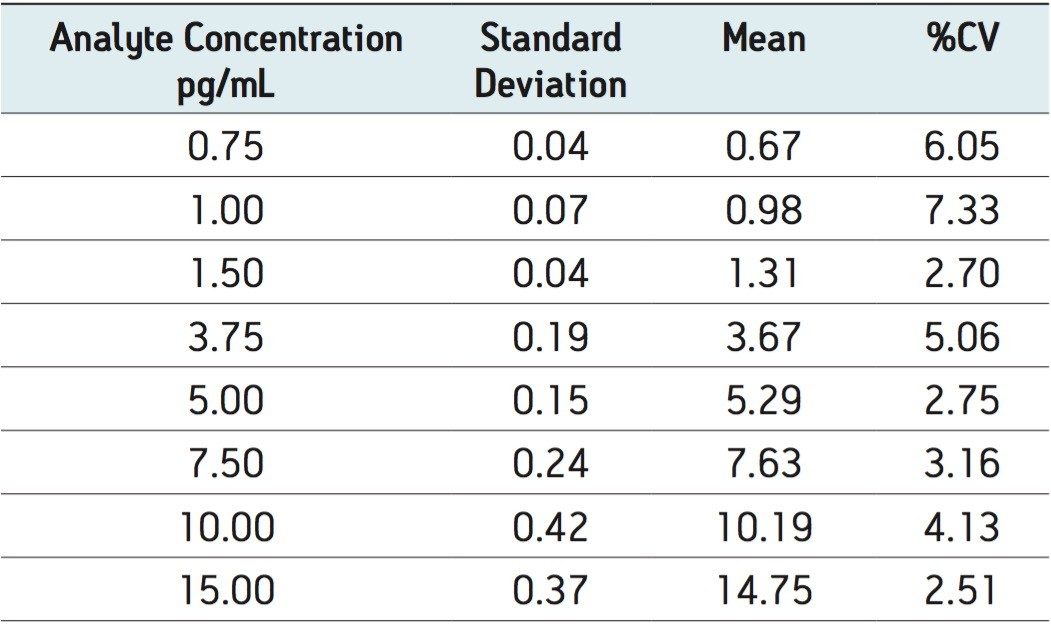
The extracted ion chromatogram for the 0.750 pg/mL fluticasone propionate standard is shown in Figure 3. The LLOQ standard is shown on the top trace and the extracted plasma blank chromatogram is shown on the lower trace, using the transition 501 → 293. The signal-to-noise for this standard was determined to be 5:1. The calibration line was shown to be linear over the range of 0.75 to 15.00 pg/mL with an R2 value of 0.994701 and an intercept of 0.0828. This level of sensitivity allows for the accurate determination of the pharmacokinetics of the fluticasone in plasma. In order to determine the reproducibility of the LC-MS/MS system, six replicate extractions were chromatographed at each concentration level, the data obtained are shown in Table 1. From the data displayed in the table we can see that the %CV for the LLOQ standard (0.750 pg/mL) was determined to be 6.05%. 

Figure 3. LC-MS/MS chromatogram of fluticasone propionate and blank plasma in a SPE extract. 0.750 pg/mL standard is shown on the top trace.

The limit of quantification for salmeterol xinafoate was determined to be 0.375 pg/mL. An extracted ion chromatogram for salmeterol xinafoate at 0.375 pg/mL standard and an extracted plasma blank extract are shown in Figure 4. The signal-to-noise for the 0.375 pg/mL salmeterol peak was determined to be 6:1. The calibration line was shown to be linear over the range of 0.375 to 7.500 pg/mL with an R2 value of 0.999499 and an intercept of 0.504. The reproducibility of the LC-MS/MS system for the analysis of salmeterol xinofaote was determined by the LC-MS/MS analysis of six replicate extractions at each concentration level. The data obtained are shown above in Table 2. From the data displayed in the table we can see that the %CV for the LLOQ standard (0.375 pg/mL) was determined to be 1.49%.

Figure 4. LC-MS/MS chromatogram of salmeterol xinafoate at 0.375 pg/mL and blank plasma in a SPE plasma extract. 0.375 pg/mL standard is shown on the top trace.

The applicability of the assay for routine use is heavily dependent upon the reproducibility of the methodology. The data displayed in Tables 1 and 2 illustrate the performance of the assay in terms of the back-calculated standard concentration. The data displayed in Figure 5 illustrate the variation in the internal standard response during the analysis of one batch of samples. These data suggest that the assay developed for the analysis of fluticasone propionate and salmeterol xinafoate is fit for purpose.

Figure 5. Variation in the internal standard response during the analysis of one  batch of samples.
Table 1. Assay reproducibility for fluticasone propionate in plasma.
Table 2. Assay reproducibility for salmeterol xinafoate in plasma.

Conclusion

A method was developed for the quantification of fluticasone propionate and salmeterol xinafoate in rat plasma using solid phase extraction followed by reversed phase chromatography and tandem quadrupole mass spectrometry. The lower limit of quantification for fluticasone propionate was determined to be 0.750 pg/mL, and the lower limit of quantification for salmeterol succinate was determined to 0.375 pg/mL. The coefficient of variation was determined to be 6.05% and 1.49% at the LLOQ for fluticasone propionate and salmeterol xinafoate respectively. 

  • The assay sensitivity was determined to be 0.750 pg/mL for fluticasone and 0.375 pg/mL for salmeterol.
  • The use of Oasis μElution SPE allowed the analyte to be eluted in just 50 μL and removed the need for evaporation to dryness.
  • The two analytes were readily separated from each other and the endogenous components in plasma.
  • The use of the StepWave ion guide in the Xevo TQ-S resulted in a 5- to 10-fold increase in sensitivity, compared to previous generations of mass spectrometers.

720004340, May 2012

Voltar ao início Voltar ao início