For pharmaceutical and biopharmaceutical companies, among other industries, Process Analytical Technology (PAT) is a critical component of the overall manufacturing process, relied upon to provide richer process understanding and consistent product quality at maximum yields with minimal waste.
PAT involves taking timely measurements throughout the production process to verify the quality of in-process batches and to understand performance in each of the critical steps of that process. Many different sensor technologies are employed throughout the manufacturing process to measure the attributes of the in-process batches. Deployment of appropriate sensors to monitor identified critical quality attributes (CQAs) can aid in maintaining process control and functioning well within the established design space of the operation.
Typically, process steps such as purification are assessed by spectroscopic sensors, which include near-infrared spectroscopy (NIR) or Raman spectroscopy. These techniques have the ability to provide real-time information about the purification process but lack the ability to effectively resolve and quantify multiple components in the effluent stream.
Performance of these sensors needs to be benchmarked against a reference standard, which in most instances is high performance liquid chromatography (HPLC) because it is a more selective and sensitive technique, with a broader linear dynamic range, and has the ability to quantify multiple components within complex samples.
HPLC is the most widely-used technique in pharmaceutical QC laboratories. However, its long run times and complex system operation have prevented it from being routinely used for atline or online analysis.
With the introduction of Waters UltraPerformance LC (UPLC) technology, it is now possible to achieve near real-time chromatographic analysis for in-process samples. UPLC is delivered in a system that includes integrated hardware and software, offering a simple design that requires little to no user input.
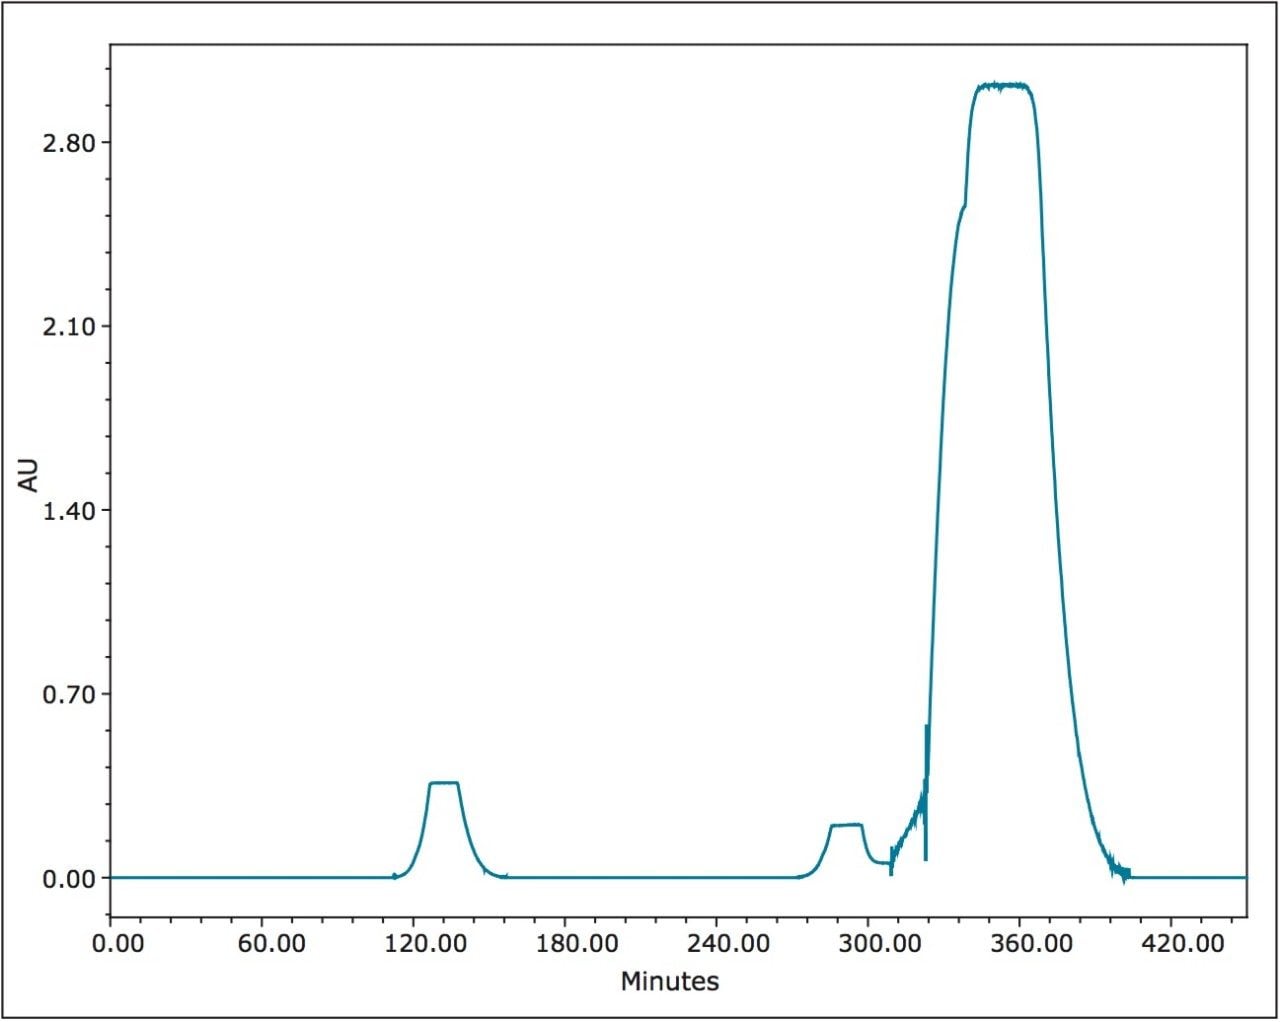
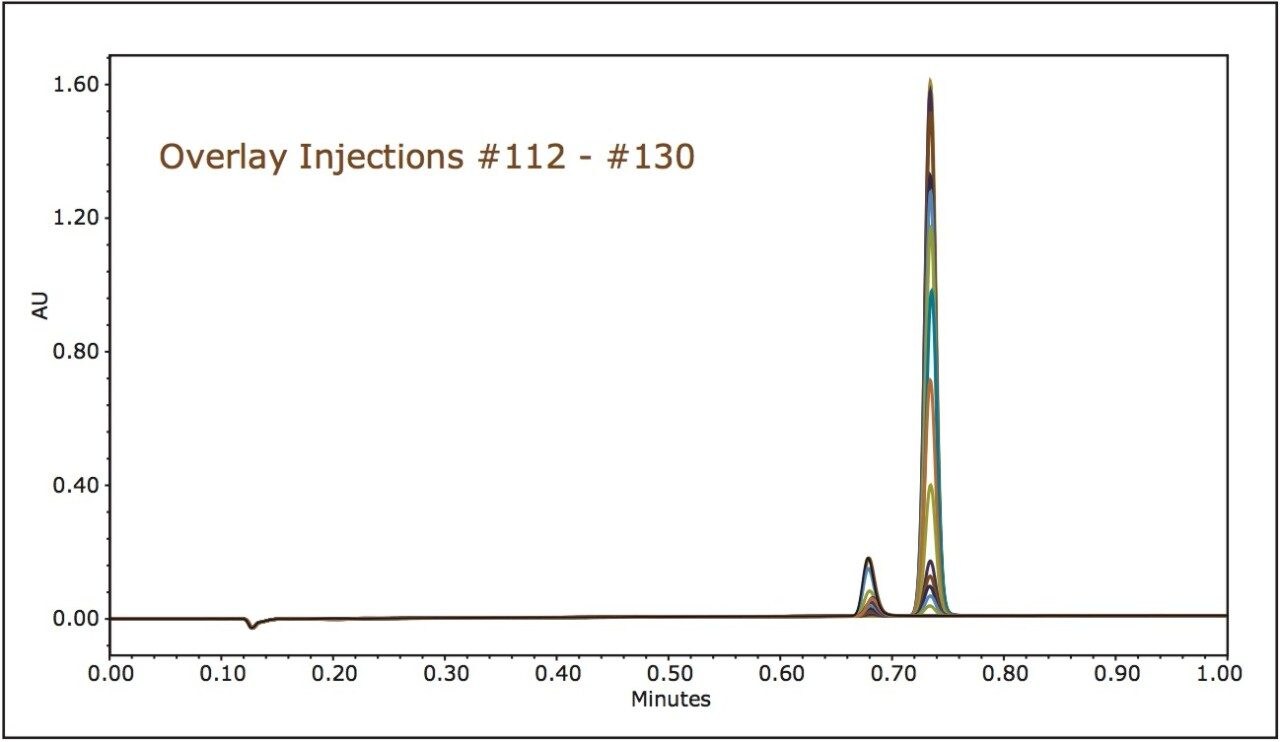
The PATROL UPLC Process Analysis System brings reference-standard methodology to process development and is directly scalable through commercial operations, eliminating the need to calibrate spectroscopic sensors or to send suspect samples to an off-line QC laboratory. This application note discusses the use of UPLC for monitoring effluent from a process purification column.