• Application Note

Analysis of Ketamine and Xylazine in Rat Tissues Using the ACQUITY UPLC with 2D Technology

Analysis of Ketamine and Xylazine in Rat Tissues Using the ACQUITY UPLC with 2D Technology

  • Malorie Mella
  • Brendan Schweitzer
  • Sabra R. Botch-Jones
  • Claude R. Mallet
  • Boston University School of Medicine
  • Waters Corporation

For forensic toxicology use only.

Abstract

This application demonstrates the automated and fast method development capability of the ACQUITY UPLC with 2D Technology for the analysis of ketamine and xylazine in rat tissues.

The quantification limit was set at 50 ppt using a 1 g of sample. The micro extraction protocol offered the option to evaluate several elution parameters in a short time period. The elution optimization was completed within a 4 hours hands-on work and the 2D LC results were analyzed using an over-night run multi-methods sample list (18 hours). With the extraction protocol optimized, the final protocol produced a clean extract in 30 minutes without any evaporation to dryness and reconstitution into initial mobile phase conditions. The reversed-phase/ion exchange extraction protocol gave a 90% recovery average for both drugs.

Benefits

  • Fast extraction protocol (30 min)
  • Trace level detection (ppt)
  • 90 second homogenization

Introduction

In the field of veterinary medicine, xylazine is FDA approved as an animal tranquillizer and often used in combination with ketamine. Since both drugs exhibit anesthetic properties, their recreational usage is on the rise in several countries. Recently, the cocktail was reported as a date rape drug. This increase in illicit usage prompted a re-classification of ketamine as a Schedule III compound of the United States Controlled Substance Act. In post-mortem toxicology casework, complex matrices can be difficult to analyze due to time-consuming extraction processes. Typically, in most tissue applications, liquid-liquid extraction (LLE) and solid-phase extraction (SPE) are used for de-fatting cleanup/concentration steps. With more complex matrices, a more robust extraction and cleanup methodology is an absolute must in order to reach the desired target limits of detection (LOD). The analysis of xylazine and ketamine in biological tissue specimens (heart, kidney, spleen, brain, lung, stomach) entails several analytical challenges, predominately during the extraction phase. As with all Class C matrices (solids), the sample must undergo a complete disruption of the cell membrane to expose the inner portion of tissue cells. The homogenization step is thus the first step to extract a target analyte into a liquid solution for further clean up and concentration. Most forensic laboratories still employ extensive and time-consuming sample preparation protocols to reach sub parts per billion (ng/mL or ppb) levels.

In recent years, advances in analytical capabilities with hyphenated instrumentation platforms have enabled sensitivity and efficiency to detect trace levels of analytes. As such, the bottleneck resides with the sample preparation techniques, some of which have not been updated for decades. Traditional solid-phase extraction techniques require a lengthy evaporation step, which will inevitably delay a complete forensic investigation. A micro extraction protocol combined with a multi-dimension chromatography solution can decrease sample preparation time without sacrificing the quality seen with current single dimension chromatography techniques.1,2,3

Experimental

Chromatography and MS/MS conditions

Loading conditions

Column:

Oasis HLB 20 μm–40 mg (2.1 x 5 mm) (custom packing)

Loading:

MilliQ water (pH 7, no additives)

Flow rate:

2 mL/min

At-column dilution:

5% (0.1 mL/min loading pump and 2 mL/min diluting pump)

UPLC conditions

UPLC system:

ACQUITY UPLC with 2D Technology configured for “Trap & Elute” with at-column dilution

Runtime:

10 min

Column:

ACQUITY UPLC BEH C18, (p/n 186002350) 2.1 x 50 mm, 1.7 μm

Column temp.:

60 °C

Mobile phase A:

Water + 0.5% formic acid

Mobile phase B:

Acetonitrile + 0.5% formic acid

Elution:

5 minute linear gradient from 5% (B) to 95% (B)

Flow rate:

0.500 mL/min (Elution pump)

Injection volume:

100 μL

MS conditions

MS system:

XEVO TQ-S

Ionization mode:

ESI positive

Capillary voltage:

3.0 kV

Cone voltage:

90.0 V

Source temp.:

150 °C

Desolvation temp.:

550 °C

Desolvation gas:

1100 L/hr

Cone gas:

50 L/hr

Two MRM transitions (quantification and confirmation) for ketamine and xylazine were selected and optimized. The MRM conditions are listed in Table 1.

Table 1. MRM transitions for ketamine and xylazine.

For this application, finding the optimum extraction and chromatographic condition for this multi-residue analysis posed a significant challenge. As seen in Figure 1, xylazine and ketamine share a common rigid aromatic structure. The chromatographic conditions were tested on several trapping column chemistries (Oasis HLB, XBridge C18 and XBridge C8) and separation chemistries (BEH C18). The loading (low pH, high pH, and neutral pH) and eluting mobile phase (MeOH + 0.5% formic acid and ACN + 0.5% formic acid) were also optimized using an automated 6x6 process.

Figure 1. Chemical structure of xylazine and ketamine.

Biological tissue specimens, including brain, heart, lung, liver, kidney, and spleen were taken from 10 rats, following xylazine and ketamine administration prior to being euthanized. After homogenization, the tissue homogenate was centrifuged at 4000 rpm for 5 minutes and the supernatant collected and diluted in 100 mL of MilliQ water. The extraction process was performed on pre-conditioned mixed mode reversed-phase/ion exchange sorbent Oasis MCX 6 cc Vac Cartridge, 150 mg Sorbent per Cartridge, 30 μm Particle Size. The mixed mode approach yields two eluting fractions, one fraction comprised of neutral and acidic entities and the other fraction concentrating the analytes with basic functionalities. The cartridge was washed with 2 mL water with 0.1 N HCl, followed by 2 mL of MeOH with 2% formic acid. The target analytes were eluted with 2 mL 100% MeOH with 5% formic acid (See Figure 2). From an acetonitrile stock solution of 100 ppb, 20 μL of ketamine D6 was added to the final extract to attain a final internal standard (IS)  concentration of 1 ppb.

Figure 2. Extraction protocol for xylazine and ketamine in rat tissue.

Results and Discussion

Method development

The first step in this application focused on the optimization of several key parameters of the first and second dimension chromatography conditions. As see in Figure 3, optimizing the loading pH and retention strength on the first dimension ensures an effective retention in a tight and narrow band. Next, the optimization of the elution strength (pH and polarity) will produce quantifiable peak shape for target analytes on the second dimension. The optimization process presented in Figure 4 showed a good response for xylazine with the Oasis HLB trap material. In some instances, a target analyte may show distorted peak shapes or low intensities no matter which conditions are used during the optimization process. Consequently, the method limit of detection (LOD) may fall short of a target value. Additional parameters can be adjusted to ensure proper mass transfer during loading and elution phase. One in particular is the sorbent bed mass on the first dimension. Two sorbent bed masses (40 mg vs 80 mg) were evaluated for the retention and elution of ketamine and xylazine.

Figure 3. 6x6 Method optimization with 36 permutation.
Figure 4. Results for method 6 and 15 with 40 mg and 80 mg Oasis HLB bed mass.

As seen in Figure 5, the 40 mg bed mass gave higher intensities due to faster mass transfer between the mobile and stationary phases in the first dimension. Therefore, the final protocol will use a pH 7 loading onto a 40 mg HLB on the first dimension, followed by an elution with acetonitrile at pH 3 onto a BEH C18 analytical column. The final separation showed excellent Gaussian peak shapes for both xylazine and ketamine. However, for a water spike, lower intensities are usually expected due to secondary interactions with the active sites, most likely due to ion exchange retention with the glass vial surface. The ionic interaction can be eliminated by simply changing the diluent. In this case, methanol and acetonitrile diluents both gave higher intensities.

Figure 5. Results for MeOH, ACN, and water spike using method 6.

SPE Extraction Evaluation

Once the LC and MS optimization phase was completed, the next step focused on the extraction and sample cleanup of the application. In this instance, since the target matrix is very high on the complexity scale (Class C matrix), the extraction protocol will require a robust cleanup methodology and an evaluation of optimum extraction conditions during the homogenization process. Therefore, the first step is to choose a solid phase extraction (SPE) protocol with a superior cleanup capability. In Figure 6, two SPE sorbents are depicted for the extraction of xylazine and ketamine in 100 mL water spike at 1 ppb. The results clearly show higher recoveries (>90% MeOH elution) using the mixed mode sorbent. The next phase of the extraction focused on linking the solid/liquid extraction of the sample tissue with the enrichment process using the mixed mode SPE.

Figure 6. Recovery comparison Oasis HLB vs Oasis MCX.

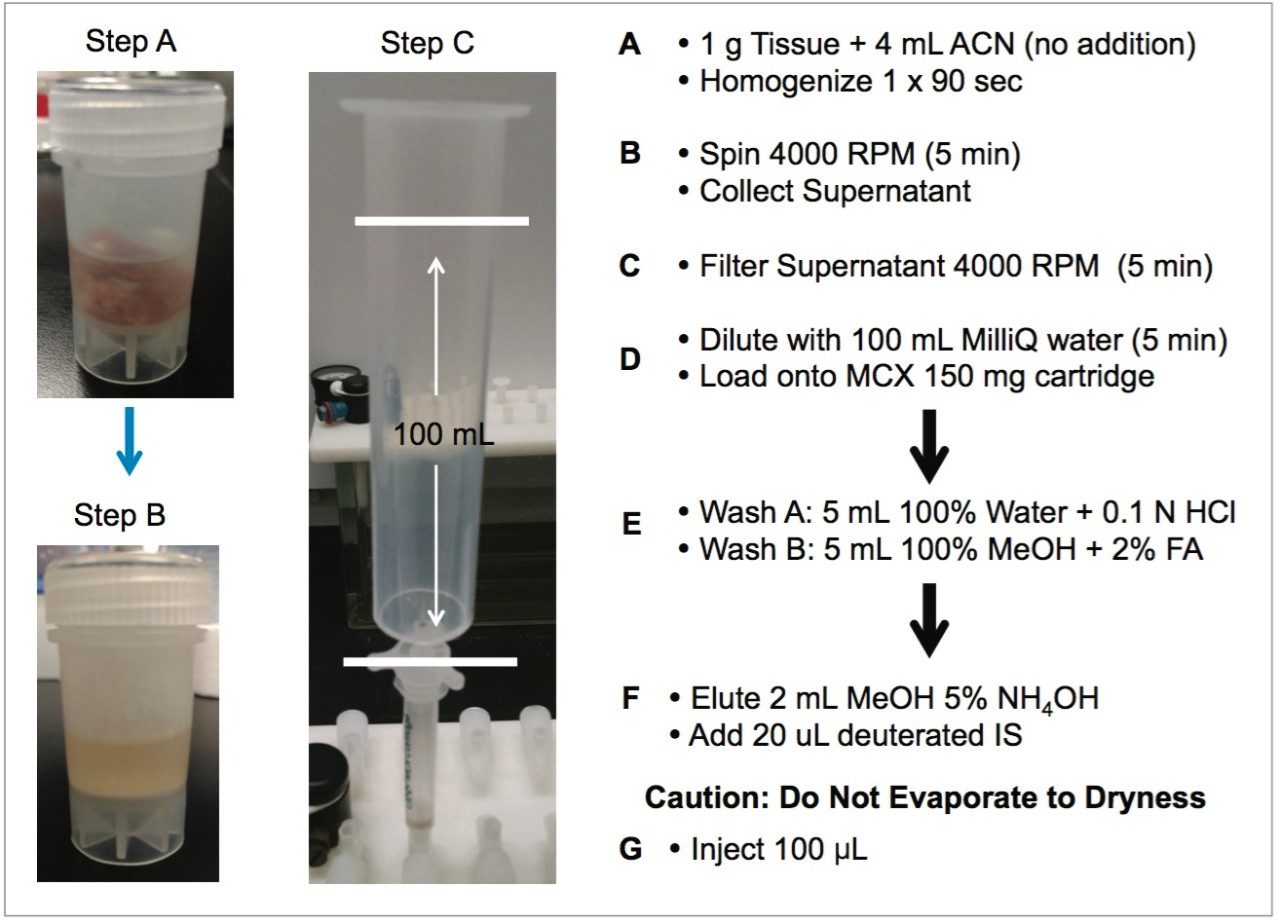
In most cases, acidic methanol or acetonitrile are the popular choices to extract a target analyte from a solid matrix. The homogenization process is typically performed with a common kitchen blender or using a hand-held homogenizer (ex: Polytron). Those techniques can be cumbersome and are difficult to apply to small mass samples. In recent years, novel developments with ceramic or stainless steel ball bearings in combination with high speed orbital shakers have shown the possibility to reach complete cell membrane breakdown in less than 60 seconds. With variable cycle speed, this novel homogenization protocol can process sample sizes from 0.1 to 5.0 grams. In this application, the mass range for the rat brain, heart, lung, liver, kidney, and spleen sample was between 0.2 and 0.8 grams. At this stage of the application, once a sample is completely homogenized, the sample is centrifuged, which will create a solid pellet on the bottom of the tube with the organic supernatant above. The organic supernatant is then decanted. Depending on the extraction conditions (pH and polarity), the target analyte is expected to be in solution and un-bound in the extraction solvent. In some applications, this crude extract can be used directly for quantification, however there is a high risk the raw sample extract will seriously reduce the robustness of the LC-MS/MS performance after a few injections.

In traditional SPE protocols, when the target analyte is dissolved in a high percentage of organic solvent, the supernatant is usually evaporated to dryness and reconstituted in an aqueous diluent for further cleanup. In instances where an evaporation to dryness step is needed, there is a risk of evaporative loss or possible re-dissolution issues. An effective way to avoid this lengthy step is to simply dilute the organic supernatant in a large aqueous volume at an organic/water ratio of less than 5%. A water volume between 100 and 200 mL is more than adequate to reach low organic ratio without any risk of breakthrough on the trapping column during loading phase. It may be perceived as a drawback, since the loading volume is quite large. However, with a loading flow rate at 10mL/min and using a large bore SPE barrel (6 cc with 150 mg bed mass), a 100 mL sample can be concentrated in 10 minutes, while evaporating to dryness can take several hours to complete.

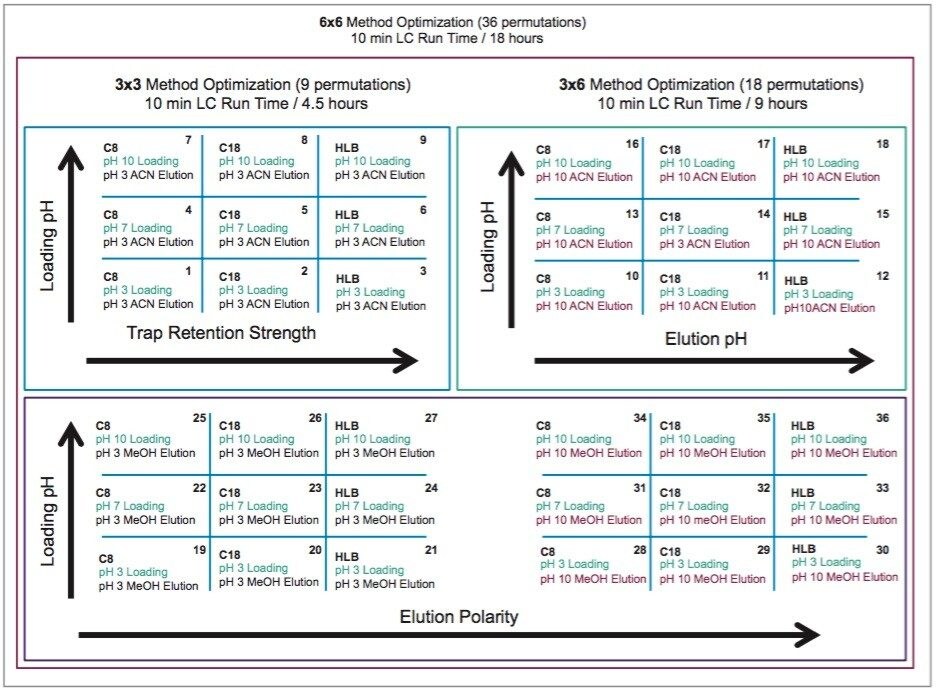
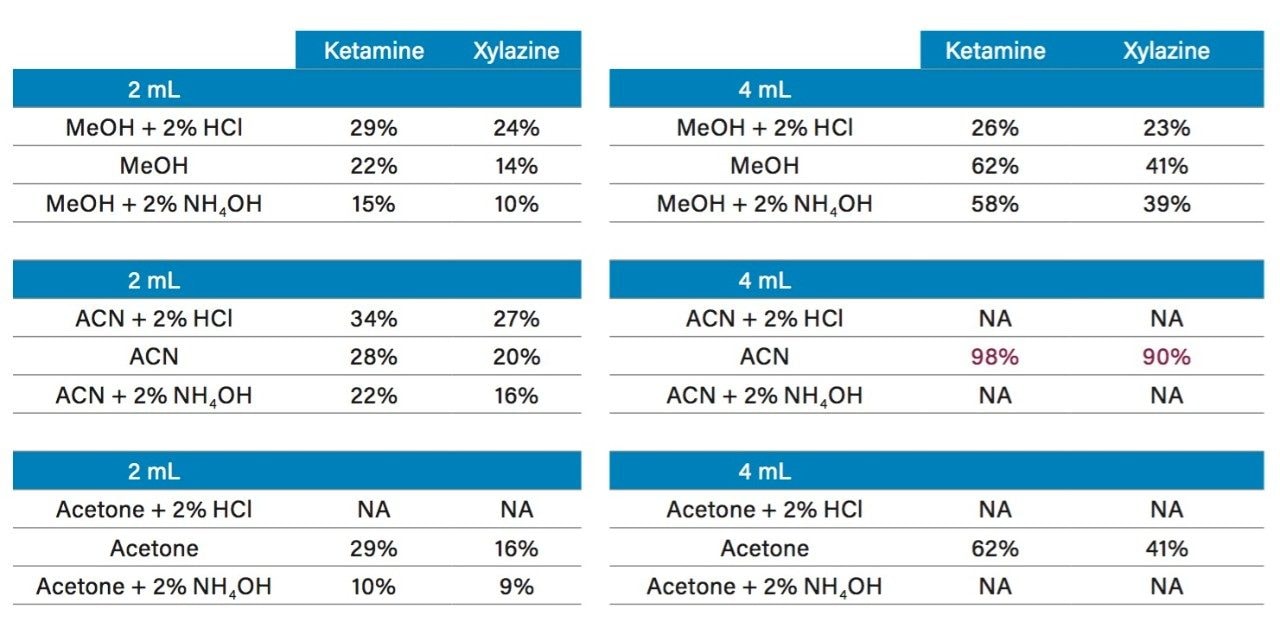
In this application, several organic solvents (MeOH, ACN, acetone), pH conditions (HCl vs NH4OH), and volume-to-mass ratio (2 mL vs 4 mL) were evaluated for extraction purposes while keeping the loading organic/water ratio below 5%. For this portion of the work, a 1 gram spiked calf liver sample was used for each optimization parameter. The results revealed one extraction condition in particular gave excellent recoveries (see Table 2), while other extraction conditions gave recovery values below 50%. In some samples, the solid/liquid extraction produced highly complex extracts, which subsequently created a rapid blockage during loading phase. Those extraction conditions were reported as non-available (NA) in Table 2. In keeping with an extraction time objective of 30 minutes or less, those conditions were not pursued further, however additional cleanup prior to the SPE loading could be beneficial (dispersive SPE, filtration, high speed centrifugation, etc.) thus resolving any potential clogging issues.

Table 2. Recovery percentage for MeOH, acetone, and ACN at pH 3, 7, and 10.

Tissue Quatification

Once the extraction protocol was fully optimized, the final phase of the application focused on the quantification of xylazine and ketamine in animal tissue. When analyzing highly complex sample types (Class C matrix or solids samples), the extraction recoveries are most often overwhelmed by matrix effect, which can lead to either suppression or enhancement in the MS detector. These effects are related to the ability of the extraction protocol to remove interferences from the raw sample.

In this work, the extraction protocol relies on a dilution effect (50:1) to avoid the time consuming evaporation to dryness. With the solvent exchange step eliminated, the organic extract from the homogenization process can simply be diluted to reduce the organic content below 5% (optimum value for loading without breakthrough effect during the trapping phase). However, large volume loading will lead to an enrichment effect, which, if poor water quality is utilized, will lead to possible enrichment of additional sources of interferences. For this reason, optima grade water was used for the dilution step. As seen in Figure 7, when comparing the post spike deuterated ketamine D4 IS from a 100 mL blank optima grade water sample to an un-extracted standard, the area counts showed a manageable matrix effect of 10%. The rationale for adding a deuterated internal standard post spike was chosen for several reasons. The extraction protocol was crafted with a maximum time objective of less than 30 minutes, which limits the number of extraction steps. Further cleanup steps can be added, which in this instance will most likely require a dual extraction process with extensive clean-up. For this application, using an optimized reversed-phase/ion exchange protocol gave encouraging results with chromatograms from a liver extract showing an interference free and stable baseline. The signal intensity for a sample with a concentration of 1 ppb was also very strong, suggesting a LOD in the low part-per-trillion range (ppt). After calculating a matrix effect of 42% for a liver extract from ketamine D4, the recovery values calculated from ion ratio (target/internal standard) gave values of 98% and 93% for ketamine and xylazine in liver extract, respectively. The calibration curves (0.05 to 10 ppb range) in liver extracts gave excellent linearity with R2 values of 0.998 for both xylazine and ketamine (See Figure 8).

Figure 7. Recovery calculation for water matrix vs calf liver matrix.
Figure 8. Calibration curve for ketamine and xylazine.

The results for the biological specimens (spleen, kidney, brain, heart, and liver) are listed in Table 3. Representative chromatograms for each biological specimen for xylazine and ketamine are shown in Figure 9. The quantification MRM traces demonstrated a well defined Gaussian peak shape for both target analytes with minor interferences. The calibration curves can be extended to 10 ppt for quantification; values below this threshold were reported as detected at trace level (DTL). Also, when dealing with tissue analysis, it is expected to encounter variability from subject and tissue type within the same animal species. This variability can cause fluctuations during the extraction and analysis and subsequently have an impact on the method’s robustness and the overall analytical performance. In this application, the quantification MRM traces for 6 sample cases including kidney, spleen, heart, and brain contained only minor interferences, no major peak co-elution, and absence of baseline distortion (see Figure 10). The chemistries used for this application gave an excellent performance analyzing well over 1000 sample injections.

Table 3. Recovery percentage for xylazine and ketamine in rat heart, liver, kidney, spleen, and brain.
Figure 9. Recovery of ketamine and xylazine in rat liver, heart, brain, kidney, and spleen.
Figure 10. Extracted ketamine TIC’s for cases 4 through 9 in rat kidney, brain, spleen, and heart.

Conclusion

This application demonstrated the automated and fast method development capability of the ACQUITY UPLC with 2D Technology for the analysis of ketamine and xylazine in rat tissues. The quantification limit was set at 50 ppt using a 1 g of sample. The micro extraction protocol offered the option to evaluate several elution parameters in a short time period. The elution optimization was completed within a 4 hours hands-on work and the 2D LC results were analyzed using an over-night run multi-methods sample list (18 hours). With the extraction protocol optimized, the final protocol produced a clean extract in 30 minutes without any evaporation to dryness and reconstitution into initial mobile phase conditions. The reversed-phase/ion exchange extraction protocol gave a 90% recovery average for both drugs.

References

  1. Mallet, C.R., Botch-Jones, S., J. Anal. Toxicology, 1–11, August 25, 2016.
  2. Mallet, C.R. Multi-Dimensional Chromatography Compendium: Trap & Elute vs AT-column Dilution, 720005339EN (2015).
  3. Mallet, C.R., Analysis of Pharmaceuticals and Pesticides in Bottled, Tap, and Surface Water Using the ACQUITY UPLC with 2D Technology, Waters Corporation,720005339EN (2014).

720005810, September 2016

Voltar ao início Voltar ao início