This application demonstrated the disruptive nature of the ACQUITY UPLC System with 2D-LC Technology with the Xevo TQD Mass Spectrometer. The application targeted the analysis of microcystin RR, LR, and YR in bottled, tap, and surface water. The limit of detection in this study was 50 ppt with a 10:1 enrichment from the extraction protocol (15 min total) and a 200:1 enrichment from the at-column dilution option, for a total of 2000:1.
Algae bloom is the result of a rapid accumulation of cyanobacteria in freshwater and other ecosystems. Their presence is predominantly linked to excess nutrients (fertilizers) from water runoff.1 In some instances, harmful blooms can pose a serious health threat to humans and animals, and may also negatively impact several economic activities (fisheries, recreational parks, water treatment plants, etc). The health risk stems from the ability of cyanobacteria to produce neurotoxins, which through skin contact and water consumption can lead to several illnesses and even death.2 Microcystins are the most detected of cyanotoxins and, in 1998, the World Health Organization (WHO) set a guideline value of 1 ppb for total microcystin LR in drinking water.3 While several analytical procedures can be found in the literature using various affinity techniques, liquid chromatography with mass spectrometry detection is the most common approach for the analysis of microcystins in water matrix. As seen in Figure 1, microcystin RR, LR, and YR share a common zwitterion backbone with a single R group. Their complex ring structure poses an additional level of difficulty because of a low abundance of fragment ions for MRM transitions. If a trace-level detection is required (sub ppb), it can be challenging to meet required guidelines in the analysis of microcystins in a water matrix.
Water analysis brings a wide range of analytical challenges, especially during sample preparation. This is mainly due to its matrix complexity, from drinking water quality to waste water. As such, the removal of interferences and isolation of a target analyte usually requires extensive and laborious extraction protocols. If an extraction protocol fails to address the removal of interferences, it will ultimately lead to a high level of matrix co-elution in the final extract. As a consequence, the quantification will show poor recoveries, and detection will be affected by matrix effects. With trace-level requirements, an enrichment step is a necessity, thus creating a potential amplification effect.
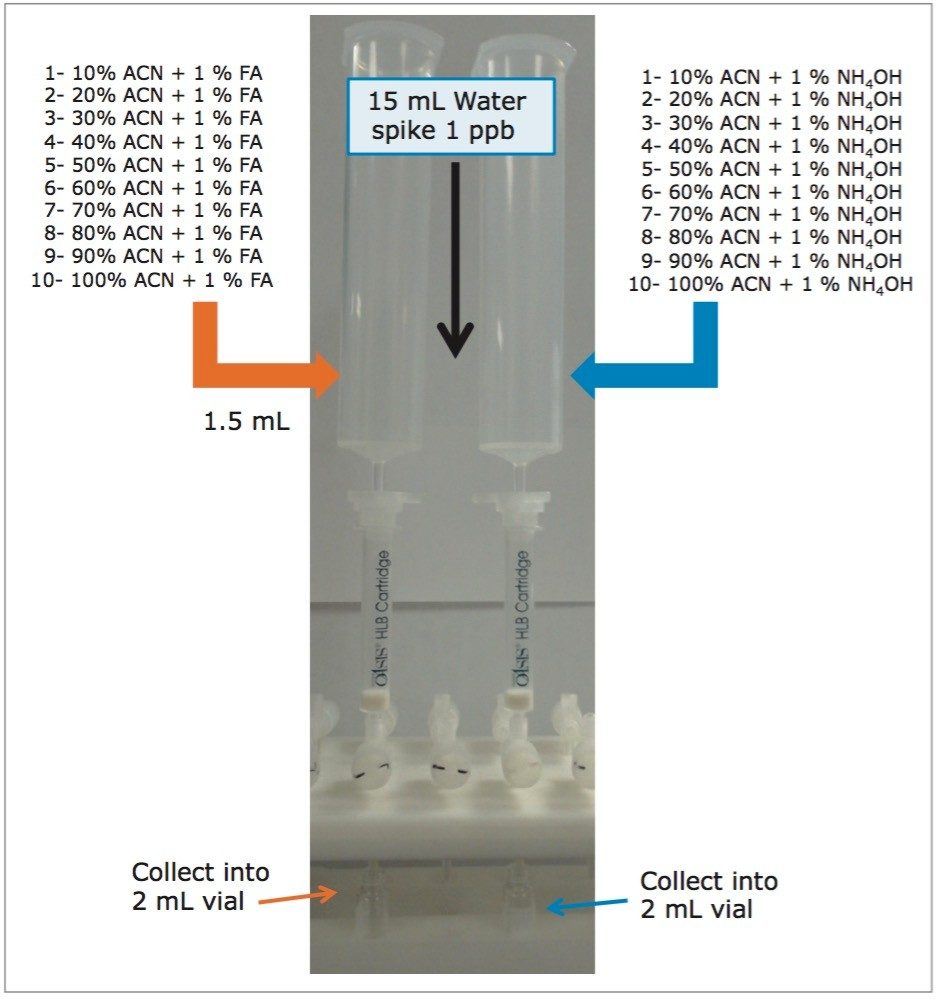
Most extraction protocols designed for drinking water (low complexity) are ill equipped to produce acceptable results for surface water samples (high complexity). From this perspective, microextraction protocol can offer acceptable recoveries for a wide range of matrix diversity. ACQUITY UPLC Systems with 2D-LC Technology4,5 offer the same analytical performance regarding recoveries, linearity, robustness, and lifetime, but at the microextraction level. The smaller sample volume allows faster loading time, by an average of less than 10 minutes. With the 2D's at-column dilution configuration, aqueous and organic extracts can be loaded and captured on a trap column with high efficiencies. The injection volume for this configuration is not a limitation, and gives the option to inject as much as needed to reach target detection limits.
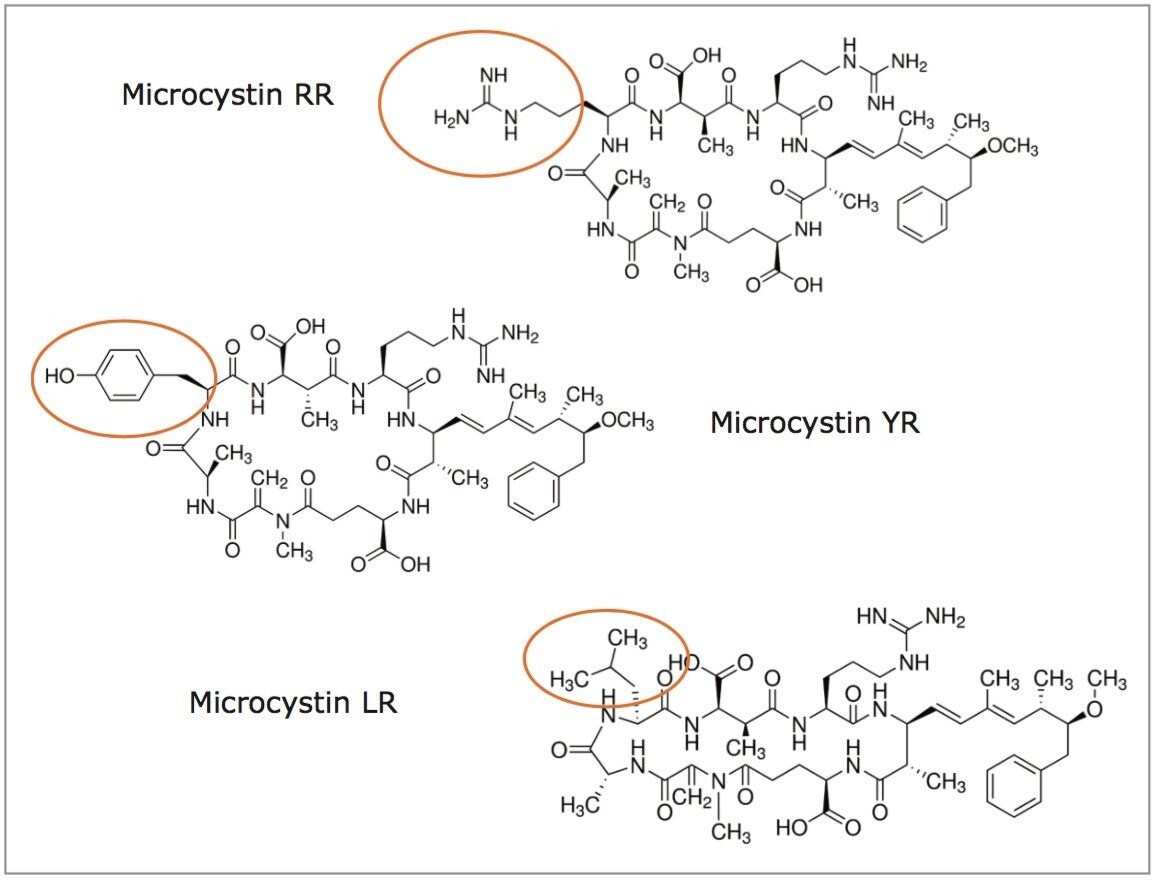
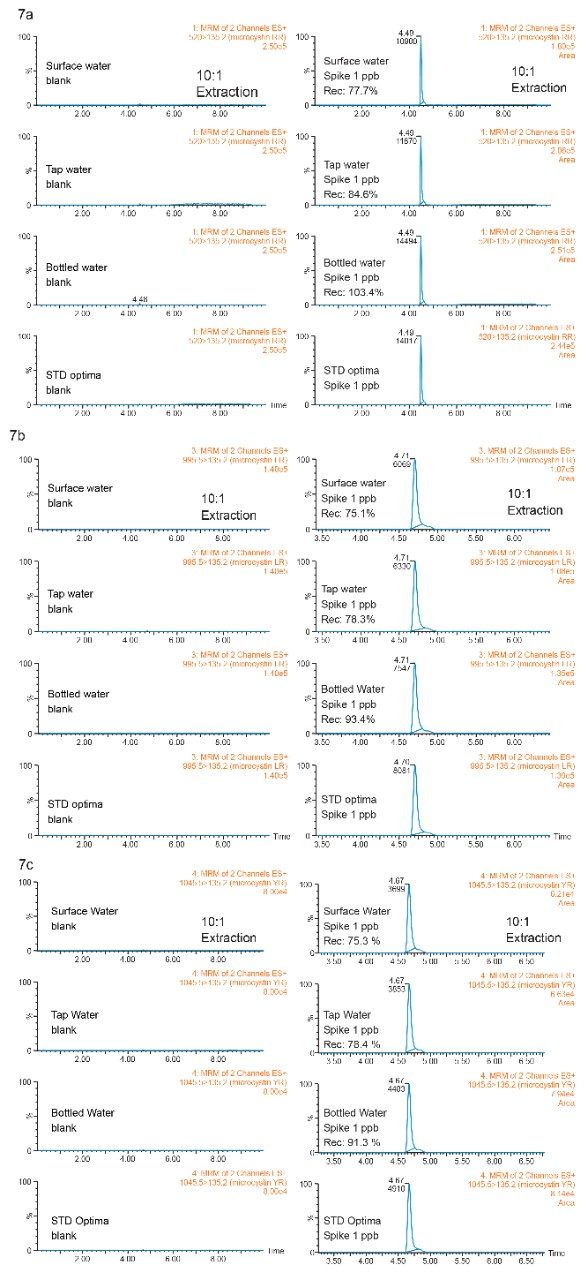
In this application note, a sequential microextraction protocol was evaluated for the analysis of microcystin RR, LR, and YR in bottled, tap, and surface water. The entire extraction protocol was completed in less than 15 minutes.
Two MRM transitions (quantification and confirmation) for all microcystins were selected and optimized. The MRM conditions are listed in Table 1. For this application, finding the optimum extraction and chromatographic condition for this multi-residue analysis poses a difficult challenge. As shown in Figure 1, the microcystins RR, LR, and YR have a zwitterionic structure (dipolar ion). The chromatographic conditions were tested on several trapping chemistries (Oasis HLB, XBridge C18, and XBridge C8) and separation chemistries (BEH C18 and HSS T3). The loading (low pH, high pH, and neutral pH) and eluting mobile phase (MeOH + 0.5% formic acid and ACN + 0.5 % formic acid) were also optimized using an automated process. The extraction process was performed using a reversed-phase sorbent with a 3-cc Oasis HLB SPE barrel using a sequential elution. The sorbent was conditioned by using 5 mL of methanol followed by 5 mL of water. The water samples (15 mL) were loaded at a flow rate of 10 mL/min. The cartridge was washed with 2 mL 10% acetonitrile with 1% formic acid. The microcystins were eluted with 1.5 mL of 50% acetonitrile with 1% formic acid. The internal standard was added at that step. From an acetonitrile stock solution of 1000 ppb, 15 μL of nodularin was added to the final extract (final IS concentration at 5 ppb).
Column: |
Oasis HLB 20 μm |
Loading: |
MilliQ Water (pH 7, no additives) |
Flow rate: |
2 mL/min |
At-column dilution: |
5% (0.1 mL/min pump A and 2 mL/min pump B) |
UPLC system: |
ACQUITY UPLC 2D-LC configured for “Trap and Elute” with AT-column dilution |
Runtime: |
10 min |
Column: |
ACQUITY UPLC BEH C18, 2.1 x 50 mm, 1.7 μm |
Column temp.: |
60 °C |
Mobile phase A: |
Water + 0.5 % formic acid |
Mobile phase B: |
Acetonitrile + 0.5% formic acid |
Elution: |
5 min linear gradient from 5% (B) to 95% (B) |
Flow rate: |
0.500 mL/min (pump C) |
Injection volume: |
250 μL |
MS system: |
Xevo TQD |
Ionization mode: |
ESI+ |
Capillary voltage: |
3.0 kV |
Cone voltage: |
90.0 V |
Source temp.: |
150 °C |
Desolvation temp.: |
550 °C |
Desolvation gas: |
1100 L/hr |
Cone gas: |
50 L/hr |
The concept of sequential microextraction is designed to capture the retention behavior of a target analyte in response to various extraction parameters (sorbent strength, elution polarity, solubility, etc). By collating the results, optimized conditions can be selected to excise a region of interest during extraction. This approach is an added benefit when using a microextraction protocol. Within 60 minutes, several elution conditions (>20 cuts) can be performed, which is quite impractical to produce with a traditional large sample extraction protocol (too time-consuming). The sequential extraction begins with a water standard spiked of microcystin at 1 ppb. A 15-mL volume of water was loaded onto two Oasis HLB 3 cc SPE cartridges (See Figure 2).
Previously, a series of elution solutions were created by increasing the ratio of organic solvent-to-water. The incremental elution strength of these solutions reveals the chromatography profile of a target analyte. In this application, the elution solvent chosen was acetonitrile, with the incremental set from 10% up to 100% (increments of 10%). Since microcystins exhibit a zwitterionic structure (amine and carboxylic acid moities), two sets of elution solutions (first set added with 1% formic acid and second set added with 1% ammonium hydroxide) were created to evaluate the elution profile at pH 3 and pH 10. By neutralizing one functionality over the other, the sequential elution can display additional information as to which retention mechanism is used by the target analyte (weak vs strong or single vs dual). The sequential elution results for microcystin RR, LR, and YR are tabulated in Figure 3A, 3B, and 3C, respectively. The sequential elution for microcystin RR indicates a high polar nature due to the fact that the molecule is completely eluted off the HLB sorbent with only 20% acetonitrile (see Figure 3A). When the elution profile for low pH and high pH are compared, microcystin RR was eluted in a single fraction (20% acetonitrile) under low pH conditions, but can be seen into the 20% and 30% fractions (50/50) under high-pH conditions. This elution behavior suggests that the acidic moities of the structure show a stronger retention on the polymer stationary phase. The retention profiles of microcystin LR and YR, however differ noticeably from microcystin RR. First, both LY and YR are eluted at higher organic fraction – in this instance about 95% was eluted at 40% acetonitrile under acidic conditions. This observation confirms the unique contribution of the R group for microcystin RR, LR, and YR (see Figure 1). With microcystin RR, the R group adds another amine functionality to the structure. As for microcystin LR and YR, their R groups are neutral moities, although the phenolic R group of microcystin YR could potentially create retention time or elution shift. Second, under basic elution, both LR and YR were eluted in lower organic fractions (20% acetonitrile at 95% recovery). No signals were measured in organic fractions higher than 40%. These results offer either a collective or fractionation elution option. In this application, the collective elution of all three microcystins was selected and the elution was performed by selecting the 10% acetonitrile with 1% formic acid for the minimum cut, and 50% acetonitrile with 1% formic acid for the maximum cut.
With the extraction protocol optimized for all three microcystins, the next phase evaluate the detection limit, linearity, and recovery for bottled, tap, and surface water samples. Since microcystins RR, LR, and YR have a rigid ring structure, the optimization for a high abundance fragment ion for quantification is a difficult task. As seen in Figures 4a, 4b, and 4c, the MRM transitions show a common fragment ion at low mass with a weak intensity for all three microcystin. If trace-level detection is required, the extraction protocol will therefore be the main focal point of the analysis.
With a multi-dimensional chromatography configuration, a simple and effective enrichment process (10:1) was coupled to a high-volume injection (250 μL) and reached low ppt range, as seen in Figure 5. The chromatograms on the left show the response factor of microcystins RR, LR, and YR at 50 ppt in a water matrix (un-extracted) with a 250-μL injection volume. The 10x enrichment with the same injection volume shows a signal-to-noise ratio over 100:1 for microcystin YR, LR, and RR, thus indicating acceptable quantification performance (>10σ).
The linearity curve in Figure 6 shows a linear fitting with a 1/X weight for all three microcystins. Nodularin was used as internal standard. The r2 values for microcystin RR, LR, and YR were calculated at 0.998, 0.995, and 0.997, respectively. The 1 ppb MRL requirement for microcystin in water from the WHO falls in the high end of the calibration curve.
The level of interferences between all three samples type can have adverse effect on the overall performance of the optimized extraction protocol. Although the extraction method was optimized using high quality water, as the amount of interferences increases (from bottled to surface water sample), the analytical performance of the extraction protocol will ultimately decrease and yield poor extraction efficiencies. This is the case when dealing with trace-level extraction protocol with large-volume sample loading (1000:1 enrichment ratio). As the complexity increases, extra wash steps must also be added to keep recoveries within acceptable range, thus keeping potential matrix effect at negligible level.
With a reduced enrichment ratio (10:1) from the extraction protocol, the clean up step can be effective for a wider range of sample complexity (low, intermediate, and high). The recovery results are tabulated in Figure 7.
The recoveries in bottled, tap, and surface water samples were calculated against optima grade water standards (extracted calibration curve). The bottled water sample gave recovery values for all three microcystins in the 90% to 104% range, as to be expected with low complexity sample. The unexpected 75% to 85% recoveries for tap and surface water samples gives clear indication to the overall performance of the extraction protocol.
This application demonstrates the disruptive nature of the ACQUITY UPLC System with 2D-LC Technology with the Xevo TQD Mass Spectrometer. The application targeted the analysis of microcystin RR, LR, and YR in bottled, tap, and surface water. The limit of detection in this study was 50 ppt with a 10:1 enrichment from the extraction protocol (15 min total) and a 200:1 enrichment from the at-column dilution option, for a total of 2000:1. The recovery data for bottled, tap, and surface water samples using a microextraction protocol shows comparable results to applications with macroextraction protocols.
720005249, July 2017