• Application Note

Rapid Analysis of Pharmaceuticals in Human Tissues Using the ACQUITY UPLC with 2D Technology

Rapid Analysis of Pharmaceuticals in Human Tissues Using the ACQUITY UPLC with 2D Technology

  • Malorie Mella
  • Brendan Schweitzer
  • Sabra R. Botch-Jones
  • Claude R. Mallet
  • Philip Kemp
  • Kacey Cliburn
  • Dennis Canfield
  • Waters Corporation
  • Boston University School of Medicine
  • Federal Aviation Administration - Civil Aerospace Medical Institute

For forensic toxicology use only.

Abstract

This application demonstrated the automated and fast method development capability of the ACQUITY UPLC with 2D Technology for the analysis of pharmaceuticals in human tissue samples.

Benefits

  • Fast extraction protocol (45 min)
  • Trace level detection (ppt)
  • 90 sec homogenization

Introduction

According to the Scientific Working Group for Forensic Toxicology (SWGTOX), the field of forensic toxicology handles the analysis of drugs or chemicals in biological materials, and the interpretation of those results for medico-legal purposes.1 In this field, forensic toxicologists often work with medical examiners to perform postmortem toxicological analyses on blood or biological tissues of deceased individuals in order to determine cause and manner of death.1 Because these results are relied upon in a court of law, validity, reliability, accuracy and precision of the analytical techniques used to perform these analyses are essential. 

The core focus of a forensic toxicology laboratory is the accurate identification and quantitation suspected drugs or chemicals in biological samples. The target matrix can vary between blood, plasma, urine, saliva, vitreous fluid, hair, nails, and organs such as brain, heart, lung, liver, kidney, spleen, and stomach contents. The Forensic Toxicology Research Team at the Federal Aviation Administration performs such analyses on samples from victims of fatal aircraft accidents to provide insight to the analysis of accident causation.2 Aircraft accidents and crashes are often brutal enough to severely impair any human remains, which is why the toxicologists must rely on more complex biological tissues for analysis, i.e. brain, heart, lung, liver, kidney, spleen, etc. Additionally, they must have the ability to detect and measure many substances, from drugs and alcohol, to toxic gases and industrial chemicals.2 Therefore, there is a need to develop multi-residue analyses and efficient sample preparation methods in order to analyze samples in a timely manner. 

The analytical techniques currently available are divided into two  categories, some platforms are used for screening methods (qualitative) and other solutions are used for confirmation methods (quantitative). Most laboratories are usually equipped with gas chromatography (GC) or liquid chromatography (LC) hyphenated to a mass spectrometer (MS). For several decades, GC-MS was the tool of choice for bio-analysis. With the introduction of atmospheric pressure ionization technique, LC-MS is now the most popular technique in the field of forensic toxicology.

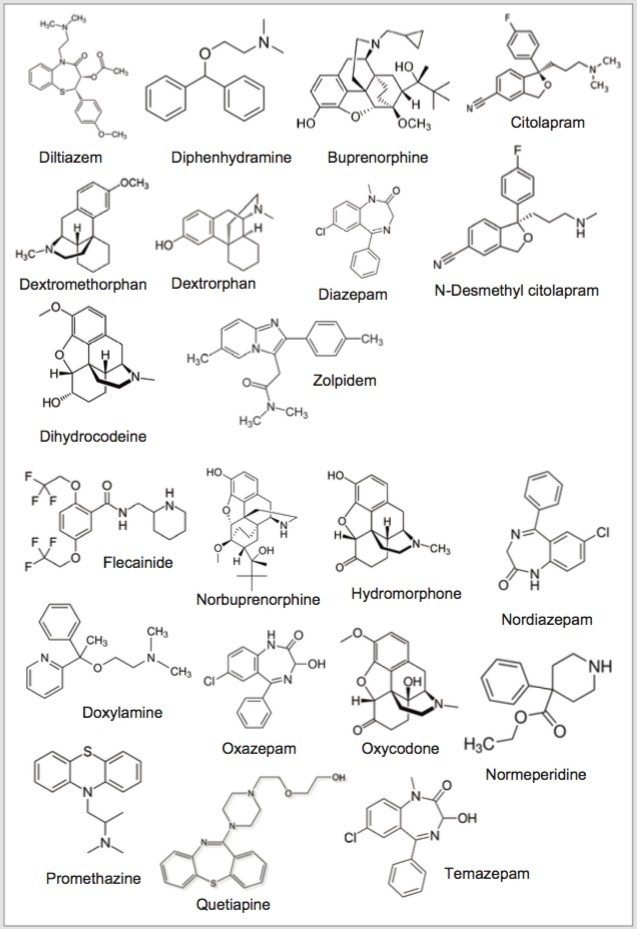
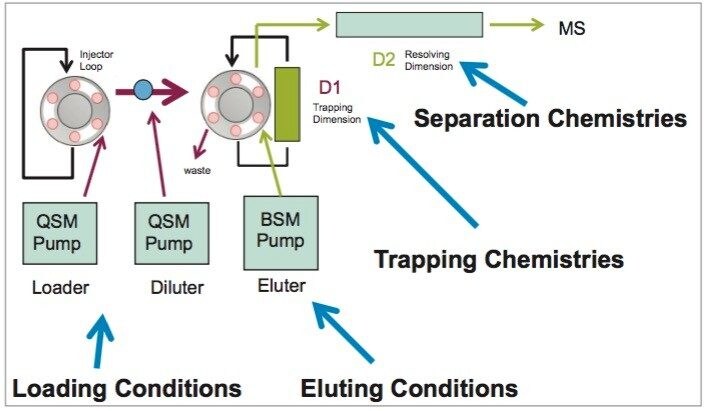
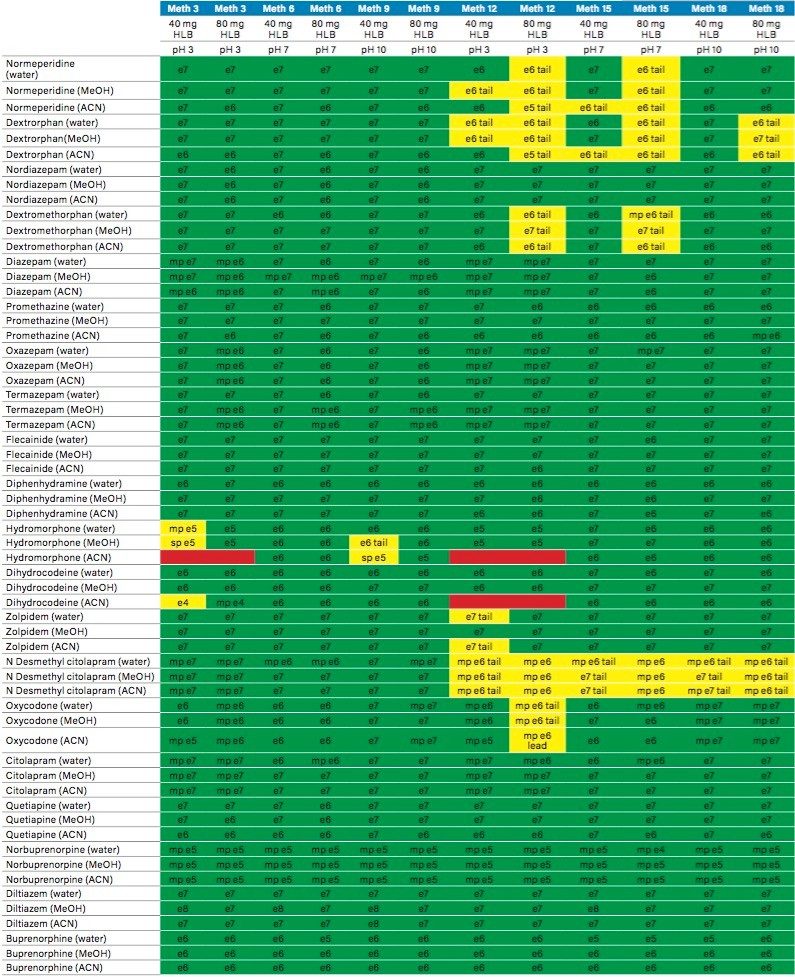
Detection and quantification of drugs in complex matrices is difficult to accomplish due to time-consuming extraction processes, and the difficulty to detect an analyte at trace levels. A robust extraction and clean up methodology, in which a homogenization step precedes, is a must in order to reach a target limit of detection (LOD) and to maintain instrument performance. The use of advanced hyphenated instrumentation platforms, such as UPLC-MS/MS has allowed analysts to detect trace levels of analytes. Traditional extraction techniques used in most laboratories are decades old and do not have the robustness to produce quality results. A micro extraction protocol combined with a multi-dimensional chromatography (2D LC-MS/MS) can decrease sample preparation time without sacrificing the quality seen with current single dimension chromatography techniques.3,4,5

Experimental

Two MRM transitions (quantification and confirmation) for all drugs were selected and optimized. The MRM conditions are listed in Table 1. All human biological specimens used for this study were provided by the Federal Aviation Administration (FAA). 

Table 1. MRM transitions for target analytes.

For this application, finding the optimum extraction and chromatographic condition for this multi-residue analysis posed a significant challenge. As seen in Figure 1, the chemical diversity for the target analyte in the study covers a wide range of polarities. The chromatographic conditions were tested on several trapping chemistries (Oasis HLB, XBridge C18 and XBridge C8) and separation chemistries (BEH C18). The loading (water at low pH, high pH, and neutral pH) and eluting mobile phases (MeOH + 0.5% formic acid and ACN + 0.5% formic acid) were also optimized using an automated 6x6 process.  

Figure 1. Chemical structure for target analytes.

The homogenization process started by measuring 1 g of tissue followed by an addition of 4 mL of acetonitrile in a 15 mL plastic tube (See Figure 2). The tissue sample was homogenized using a high speed impact process of 6000 rpm with ceramic ball bearings for approximately 90 seconds. The acetonitrile homogenate was centrifuged at 4000 rpm for 5 min and the supernatant collected for further extraction. The final extracts were filtered using a 0.45 µm size PTFE filter, and then diluted in 100 mL of MilliQ water. The sample clean up process was performed on two pre-conditioned mixed mode reversed-phase/ion exchange sorbent (6 cc Oasis MCX SPE barrel and 6 cc Oasis WCX SPE barrel). The MCX ion exchange mixed mode cartridge utilizes a strong embedded acidic group to capture basic functionality, while the WCX ion exchange mixed mode sorbent utilizes a weak acidic group to provide the same retention capability for basic analyte.

Figure 2. Final extraction protocol for human tissue samples.

The mixed mode approach yields two eluting fractions, one fraction comprised of neutral and acidic entities and the other fraction concentrating the analytes with basic functionalities. The MCX cartridge was washed with 2 mL Water with 0.1 N HCl, followed by 2 mL of MeOH with 5% formic acid. The target analytes were eluted with 2 mL 100% MeOH with 5% ammonium hydroxide. The WCX cartridge was washed with 2 mL Water with 20mM triethylamine buffer, followed by 2 mL of 100% MeOH. The target analytes were eluted with 2 mL 100% MeOH with 5% formic acid. From an acetonitrile stock solution of 100 ppb, 20 µL of an internal standard (IS) mix (nordiazepam D5, doyxlamine D5, temazepam D5, hydromorphone D5, dihydrocodeine D5, N Desmethylcitolapram D5) was added to each 2mL elution volume to attain a final internal standard (IS) concentration of 1 ppb. 

The use of a 2D LC-MS/MS technology eliminates the need for an evaporation step in the extraction method. The manual extraction and sample preparation of the tissue samples was completed in less than one hour. The analysis was performed using 100µL of the  final organic solvent (ACN) extracts.

Chromatography and MS/MS conditions

Loading conditions

Column:

Oasis HLB 20 μm - 40 mg (3.9 x 5 mm)

Loading:

MilliQ Water (pH 7)

Flow rate:

2 mL/min

AT-column dilution:

5% (0.1 mL/min Loading pump and 2 mL/min Diluting pump)

UPLC conditions

UPLC system:

ACQUITY UPLC with 2D Technology configured for “Trap and Elute” with AT-column dilution

Runtime:

10 min

Column:

ACQUITY UPLC BEH C18, 2.1 x 50 mm, 1.7 μm

Column temp.:

60 °C

Mobile phase A:

Water + 0.5% formic acid

Mobile phase B:

Acetonitrile + 0.5 % formic acid

Elution:

5 minute linear gradient from 5% (B) to 95% (B)

Flow Rate:

0.500 mL/min (Elution pump)

Injection volume:

100 μL

MS conditions

MS System:

Xevo Q-ST TQ-S

Ionization mode:

ESI Positive

Capillary voltage:

3.0 kV

Cone voltage:

90.0 V

Source temp.:

150 °C

Desolvation temp.:

550 °C

Desolvation gas:

1100 L/hr

Cone gas:

50 L/hr

Results and Discussion

2D LC method development

The analysis of started with the chromatography optimization of the 2D LC-MS/MS. The 2D LC-MS/MS is setup as depicted in Figure 3. This configuration was constructed with two quaternary pumps and one binary pump. The binary pump was set for gradient elution and the quaternary pumps were plumbed for “AT-column dilution” to create two distinct streams (loader and dilutor). The loader pump was set 0.1 mL/min for loading the extracts from the injection loop onto a 50 µL mixer, while the dilutor pump was set at 2 mL/min flow rate for dilution following a re-focusing effect on the trap column. From the chemical structures of the target analytes, a high retention strength sorbent material (Oasis HLB, 40mg) was selected for the trap column, while a high XBridge Hybrid C18 sorbent (BEH C18) was chosen for the analytical column. The next phase of the optimization was to select the trapping and elution conditions. As seen in previous publications, a 6x6 2D LC evaluation grid gives an excellent starting point to provide an overview of the chromatographic behavior for a target analyte. For this application, the 2D LC optimization process focused with methods 3, 6, 9, 12, 15, and 18. The results are tabulated in Table 2. The color coded chart was created to identify which analytical conditions give the best chromatographic profile with a quick visual survey. The green box depicts a Gaussian peak shape for quantification analysis. The yellow box was used to flag chromatography issues, such as peak split, tailing, shoulder or leading profiles. Finally, the red box indicates an absence of signal, most likely due to breakthrough effect during loading phase on the trap column or poor elution from the trap onto the analytical column. Additional parameters can be adjusted to ensure proper mass transfer during loading and elution phase. One parameter in particular is the sorbent bed mass on the first dimension. Two sorbent bed masses (40 mg vs 80 mg) were evaluated for the retention and elution of the target analytes. As shown in Table 2, method 9 using an HLB 80 mg bed mass and method 6 using HLB 40 or 80 mg provided the best chromatography performance for all 21 target analytes. 

Figure 3. 2D LC configuration with AT-column dilution (3 pumps design).
Table 2. 6x6 grid results.

The rationale behind the selection of Method 6 related to the fact that the loading conditions for the target analytes on the trap column can be done at pH 7, while Method 9 utilize a high pH additive (NH4OH). Therefore, as cost saving measures, the final protocol will use a pH 7 loading onto an 40 mg HLB on the first dimension, followed by an elution with acetonitrile at pH 3 onto a BEH C18 analytical column (See Figure 4). The final separation showed excellent Gaussian peak shapes for all analytes. However water spikes exhibited lower intensities, which is expected due to secondary interactions with the active sites, most likely due to ion exchange retention with the glass vial surface. The ionic interaction can be eliminated by simply changing the diluent. In this case, methanol and acetonitrile diluents both gave higher intensities (See Figure 5).

Figure 4. Method 6 chromatogram at 1 ppb in acetonitrile.
Figure 5. Results for method  3, 6, and 9 with 40 mg HLB  bed mass for Diphenhydramine. 

SPE extraction evaluation

After selecting the optimum 2D LC conditions, the work focused on the extraction optimization. The first step of the process targeted the choice of the sorbent. In this scenario, a mixed mode sorbent (Reversed Phased/Cation Exchange, Oasis MCX) was selected since all target analytes contain an amine functionality in their chemical structures. Hence, the evaluation started with two sorbent masses (60 and 150 mg) as presented in Table 3. The workflow started by loading a 2 mL water spike at 1 ppb and proceeded with a pH 3 water wash to ionize the basic compounds so they are captured onto the cation exchange portion of the sorbent. With target basic analyte secured, the reversed phase portion of the sorbent was eluted with a pH 3 high organic solvent wash. In this instance, a 100% Methanol with 2% formic acid was used for the secondwash. The elution of the basic analyte was performed with 100% acetonitrile with 2% ammonium hydroxide. The high pH value neutralizes the amine functionality, thus releasing  all basic analytes from the cation exchange sorbent. The last wash and the final elution were collected to monitor if all analytes were in fact retained as predicted. As seen in table 2, the 60 mg sorbent bed showed signs of breakthrough for oxazepam, temazepam and N Desmethylcitolapram. When compared to a 150 mg sorbent bed, oxazepam and temazepam exhibited no breakthrough during the Methanol wash. However at this point in the evaluation, it was clear that several analytes exhibited poor recovery with the MCX cartridge. These issues were resolved by selecting a mixed mode sorbent with a reversed phased portion and a weak cation exchange portion (Oasis WCX). The methodology is similar, but the wash step and elution are governed by pH to ionize or neutralize the weak cation exchanger on the sorbent, as opposed to the analyte itself. The side by side comparison between MCX and WCX is presented in Table 4. As shown, Normeperidine, Dextrorphan, Dextromethorphan, N-Desmethylcitolapram and Norbuprenorphine, all show poor recoveries when using a strong cation exchanger. For two analytes, the results show a 10x signal difference between MCX and WCX. For those problem analytes, a dual methodology was crafted and two target analytes were used as markers (Citolapram and Diphenhydramine) for recovery evaluation purpose. 

Table 3. Recovery values for MCX 60 mg versus MCX 150 mg cartridge.
Table 4. Recovery values for WCX 150 mg vs MCX 150 mg cartridge.

The next phase of the application was to optimize the solid-liquid extraction of the solid sample (tissue) and evaluate the proper loading condition onto the mixed mode SPE sorbent. Store-bought calf liver was used for the sample preparation optimization, in order to preserve the human tissue specimens. When analyzing tissue samples, the homogenization process is typically performed with a common kitchen blender or a hand-held homogenizer (ex: Polytron). Those techniques can be cumbersome and are difficult to apply to small mass samples. In recent years, novel developments with ceramic or stainless steel ball bearings in combination with high speed orbital shakers have shown the ability to reach complete cell membrane breakdown in less than 60 seconds. With variable cycle speed, this novel homogenization protocol can process sample sizes from 0.1 to 5 grams. In this application, the mass range of tissue sample was set at 1.0 grams with to 4 mL extraction solvent ratio. In Figure 6, various organic solvents (acetonitrile, methanol, acetone) and pH range (2,7 and 10) were evaluated to measure which extraction conditions give maximum recovery percentage. In this application, the extraction of tissue with acetonitrile with no additives gave the highest signal. 

Figure 6. Optimization of the solid-liquid homogenization process.

Once the tissue sample was completely homogenized, it was centrifuged which produced a solid pellet on the bottom of the tube with the organic supernatant above. The organic supernatant was then filtered and decanted. Depending on the extraction conditions (pH and polarity), the target analyte is expected to be in solution and un-bound in the extraction solvent. In some applications, this crude extract can be used directly for quantification, however there is a high risk the raw sample extract will seriously reduce the robustness of the LC-MS/MS performance after a few injections. In traditional SPE protocols, when the target analyte is dissolved in a high percentage of organic solvent, the supernatant is usually evaporated to dryness and reconstituted in an aqueous diluent for further clean up. In instances where an evaporation-to-dryness step is needed, there is a risk of evaporative loss or possible re-dissolution issues. An effective way to avoid this lengthy step is to simply dilute the organic supernatant in a large aqueous volume at an organic/water ratio of less than 5%. A water volume between 100 and 200 mL is more than adequate to reach low organic ratio without any risk of breakthrough on the trapping column during loading phase. It may be perceived as a drawback, since the loading volume is quite large. However, with a loading flow rate at 10 mL/min using a large bore SPE barrel (6 cc with 150 mg bed mass), a 100 mL sample can be concentrated in 10 min, while evaporating to dryness can take several hours to complete.

The chromatograms in Figure 7 show the chromatography profile for an acetonitrile standard, water extracted standard and a spiked liver sample at 1 ppb level using the finalized extraction protocol. It is worth mentioning the stable baseline in both the water and liver extract, which is an indication that the extraction protocol, completed in 30 minutes, is producing a very clean extract. Table 5 depicts the overall recovery ratio for a liver tissue sample. Results demonstrated that 18 analytes have recovery values, measured against a post spiked deuterated internal standard (liver ion ratio recovery), within an acceptable range of 75% to 110%. The other analytes still show recovery ratio above 50%. The overall performance of both extraction methods gave an excellent linearity range as shown in Table 6. The R2 values for all analytes ranged from 0.995 to 0.999 values. The limit of detection (LOD)  for all analytes was set at 0.001 ng/mL (3x Sigma value).

Figure 7. MCX vs WCX Chromatogram for MeOH std, water extracted std water, and matrix match extracted std for Diphenhydramine. 
Table 5. Recovery values for water extract vs calf liver extract.
Table 6. Linear range and detection limits. 

Sample quantification

When analyzing highly complex sample types (class C matrix or solid samples), extraction recoveries are most often overwhelmed by matrix effects, which can lead to either suppression or enhancement in the MS detector. These effects are related to the inability of the sample clean up protocol to fully remove interferences from the raw sample. 

In this work, the extraction protocol relied heavily on the use of a mixed mode sorbent using two trapping mechanisms. In this application, the Oasis MCX and WCX both have a reverse phase and cation exchange ligands to fractionate target basic analytes from neutral and acidic interferences. As seen in Figures 8 and 9, the MCX and WCX extracts for citolapram in various human tissue sample showed outstanding clean chromatograms at concentration values between 1.0 and 0.05 ppb.

Figure 8. MCX chromatograms for tissue samples.
Figure 9. WCX chromatograms for tissue samples.

The results for the analyses of biological specimens (heart, brain, lung, liver, kidney, and spleen) are presented in Table 7. The extracts were quantified against a matrix match standard (calf liver) with a corresponding deuterated internal standard. The results were quantified within the linear range of 0.01 to 10 ng/mL. Therefore, some tissue extracts were subjected to a 100:1 dilution step before injection, to avoid flat top peak shape due to detector saturation. From the case studies in this application, case 7 tested positive for dextromethorphan (cough suppressant) and case 5 tested positive for flecainide (antiarrythmic agent). Also, case 2 tested positive for citolapram (antidepressant). As seen, since citolapram was selected as an efficiency marker for the MCX and WCX protocols, the results show comparable and precise performances for a variety tissue samples. The column chemistries used for this application gave an excellent performance analyzing well over 1000 sample injections.

Table 7. Quantification values for human tissue samples.

Conclusion

This application demonstrated the automated and fast method development capability of the ACQUITY UPLC with 2D Technology for the analysis of pharmaceuticals in human tissue samples. The quantification limit was set at 10 ppt using a 1.0 g of sample. The micro extraction protocol offered the option to evaluate several elution parameters in a short time period. The elution optimization was completed within a 4 hrs hands-on work and the 2D LC results were analyzed using an over-night run using a multi-methods sample list (18 hrs). With the extraction protocol optimized, the final protocol produced a clean extract in 30 minutes without any evaporation to dryness and reconstitution into initial mobile phase conditions. 

References

  1. The Forensic Toxicology Council. What is Forensic Toxicology? www.swgtox.org, 2010.
  2. https://www.faa.gov/data_research/research/med_humanfacs/aeromedical/forensictoxicology/
  3. Mallet, C.R., Botch-Jones, S., J. Anal. Toxicology, August 25, 1–11, 2016. 
  4. Mallet, C.R, Multi-Dimensional Chromatography Compendium: Trap and Elute vs AT-column dilution, 720005339EN (2015).
  5. Mallet, C.R., Analysis of pharmaceuticals and pesticides in bottled, tap, and surface water using the ACQUITY UPLC with 2D Technology, Waters Corporation, 720005339EN (2014).

720005896, January 2017

Voltar ao início Voltar ao início