• Application Note

UPLC-MS/MS Analysis of Dihydrotesterone, Dehydroepiandrosterone, Testosterone, Androstenedione, 17-Hydroxyprogesterone, and Progesterone in Serum for Clinical Research

UPLC-MS/MS Analysis of Dihydrotesterone, Dehydroepiandrosterone, Testosterone, Androstenedione, 17-Hydroxyprogesterone, and Progesterone in Serum for Clinical Research

  • Dominic Foley
  • Lisa J. Calton
  • Waters Corporation

For research use only. Not for use in diagnostic procedures.

Abstract

This application note describes a clinical research method utilizing Oasis MAX μElution Plate technology for the extraction of dihydrotesterone (DHT), dehydroepiandrosterone (DHEA), testosterone, androstenedione, 17-hydroxyprogesterone (17-OHP), and progesterone from serum. 

Benefits

  • Analytical selectivity of the chromatographic method provides separation of isobaric species
  • UPLC-MS/MS enables high sample-throughput using multi-well plate automation
  • Excellent agreement to EQA mean values for testosterone, androstenedione, 17-OHP, and DHT

Introduction

Steroid hormones encompass a large class of small molecules that play a central role in metabolic processes, such as regulation of sexual characteristics, blood pressure, and inflammation. Measurement of these steroids by immunoassay can be prone to analytical interference as a result of cross reactivity of reagent antibodies with structurally related steroid hormones and synthetic derivatives. UltraPerformance LC - tandem mass spectrometry–tandem mass spectrometry (UPLC-MS/MS) can provide analytically sensitive, accurate, and precise measurement of these steroid hormones.

Here we describe a clinical research method utilizing Oasis MAX μElution Plate technology for the extraction of dihydrotesterone (DHT), dehydroepiandrosterone (DHEA), testosterone, androstenedione, 17-hydroxyprogesterone (17-OHP), and progesterone from serum, which has been automated using the Tecan Freedom EVO 100/4 liquid handler. Chromatographic separation was performed on an ACQUITY UPLC I-Class System using a CORTECS UPLC C18 Column, followed by detection on a Xevo TQ-S micro Mass Spectrometer (Figure 1). In addition, we have examined External Quality Assessment (EQA) samples for testosterone, androstenedione, 17-OHP, and DHT to evaluate the bias and therefore suitability of the method for analyzing these steroids for clinical research.

Figure 1. The Waters ACQUITY UPLC I-Class/Xevo TQ-S micro System.

Experimental

LC conditions

System:

ACQUITY UPLC I-Class (FTN)

with Column Heater (CH)

Needle:

30 μL

Column:

CORTECS UPLC C18

1.6 μm, 2.1 × 50 mm

(P/N 186007093)

Pre-column:

In-line filter

(P/N 205000343)

Mobile phase A:

Water with 0.05 mM ammonium fluoride

Mobile phase B:

Methanol

Needle wash solvent:

Methanol

Wash time:

10 s

Purge solvent:

40% methanol(aq)

Column temp.:

50 °C

Injection volume:

20 μL

Flow rate:

See Table 1

Gradient:

See Table 1

Run time:

6.3 min

MS conditions

System:

Xevo TQ-S micro

Resolution:

MS1 (0.75 FWHM), MS2 (0.5 FWHM)

Acquisition mode:

Multiple Reaction Monitoring (MRM)

(see Table 2 for details)

Polarity:

ESI+

Capillary:

3.0 kV

Source temp.:

150 °C

Desolvation temp.:

600 °C

Inter-scan delay:

Automatic

Inter-channel delay:

Automatic

Data management

MassLynx v4.1 Software with TargetLynx Application Manager

Sample preparation

DHT, DHEA, testosterone, androstenedione, 17-OHP, and progesterone certified reference solutions and stable labelled internal standards for DHT, testosterone, androstenedione, 17-OHP, and progesterone were purchased from Sigma Aldrich (Poole, UK). DHEA stable labelled internal standard was purchased from QMX Labs (Thaxted, UK).

Calibrators and Quality Controls (QCs) were prepared in a surrogate matrix of 1% Bovine Serum Albumin (BSA) in Phosphate Buffered Saline (PBS). DHT calibrators were prepared over the range of 0.09–34 nmol/L. QC concentrations were 0.17, 3.4, and 26 nmol/L. DHEA calibrators were prepared over the range of 1.0–69 nmol/L with QCs at 3.1, 6.9, and 52 nmol/L. Testosterone calibrators were prepared over the range of 0.017–69 nmol/L, with QCs at 0.052, 3.5, and 52 nmol/L. Androstenedione calibrators were prepared over the range of 0.09–350 nmol/L, with QCs at 0.26, 7.0, and 262 nmol/L. 17-OHP calibrators were prepared over the range of 0.08–303 nmol/L, with QCs at 0.23, 6.1, and 227 nmol/L. Progesterone calibrators were prepared over the range of 0.06–64 nmol/L, with QCs at 0.19, 3.2, and 48 nmol/L.

Note: To convert SI units to conventional mass units divide by 3.47 for testosterone (nmol/L to ng/mL), 3.49 for androstenedione (nmol/L to ng/mL), 3.03 for 17-OHP (nmol/L to ng/mL), 3.47 for DHEA (nmol/L to ng/mL), 3.18 for progesterone (nmol/L to ng/mL), and 3.45 for DHT (nmol/L to ng/mL).

Sample extraction

Sample extraction was performed using a liquid handler. Samples were centrifuged at 4000 g for 5 minutes prior to extraction. To 100 μL of sample; 25 μL of internal standard solution (containing 34.5 nmol/L DHT-13C3, 34.7 nmol/L DHEA-13C3, 17.4 nmol/L testosterone-13C3, 35.0 nmol/L androstenedione-13C3, 76 nmol/L 17-OHP-13C3, and 16 nmol/L progesterone-13C3), 200 μL methanol and 450 μL water were added, mixing after each reagent addition. Samples were centrifuged for 5 minutes at 4000 g.

An Oasis MAX μElution Plate (P/N 186001829) was conditioned and equilibrated with 150 μL methanol and water, respectively. An aliquot of each of the pre-treated samples (600 μL) was loaded into individual wells and slowly pulled through the plate. Consecutive washes with 100 μL of *1% (v/v) formic acid in 15% (v/v) acetonitrile(aq) and 100 μL *1% (v/v) ammonia in 15% (v/v) acetonitrile(aq) were performed to reduce potential ionic interference. Analytes were eluted using 35 μL of 60% acetonitrile (aq), followed by the addition of 35 μL of water.

*Prepared weekly

Method conditions

Table 1. Gradient table for the separation of the steroid hormones. Operating backpressure at the initial conditions was approximately 5500 psi.
Table 2. MRM parameters for DHT, DHEA, testosterone, androstenedione, 17-OHP, progesterone, and their stable isotope labelled internal standards. Dwell times were set to automatic with 20 points across the peak over 6 seconds. Qualifier ion conditions are in parentheses. MS scan window was 3 to 5 minutes with the time period outside this diverted to waste.

Results and Discussion

No significant interferences were observed at the retention time of DHT, DHEA, testosterone, androstenedione, 17-OHP, and progesterone when each of these steroids and seven other structurally related compounds with similar polarities were individually examined (21-hydroxyprogesterone, DHEAS, estrone, estradiol, 17-hydroxypregnenolone, and pregnenolone). No significant interference (recovery within }15%) for DHT, DHEA, testosterone, androstenedione, 17-OHP, and progesterone was observed when other endogenous compounds were examined (albumin, bilirubin, uric acid, intralipid, triglycerides, and cholesterol).

No significant system carryover was observed from high concentration samples into subsequent blank injections. A 1:5 dilution was successfully employed on high concentration samples, providing a mean accuracy of 108%, 113%, 107%, 93%, 96%, and 108% for DHT, DHEA, testosterone, androstenedione, 17-OHP, and progesterone, respectively, with RSDs ≤10%.

Analytical sensitivity investigations were performed using steroids spiked into 1% BSA in PBS over five days across and below the calibration range (n=40 at each concentration). The method would allow for precise quantification (<20% RSD) at 0.034 nmol/L for DHT, 0.17 nmol/L DHEA, 0.007 nmol/L for testosterone, 0.035 nmol/L for androstenedione, 0.030 nmol/L for 17-OHP, and 0.016 nmol/L for progesterone. The S/N (PtP) was >10 at each of these concentrations, except for DHT, DHEA and testosterone were S/N was >10 at 0.09 nmol/L, 0.35 nmol/L, and 0.017 nmol/L respectively.

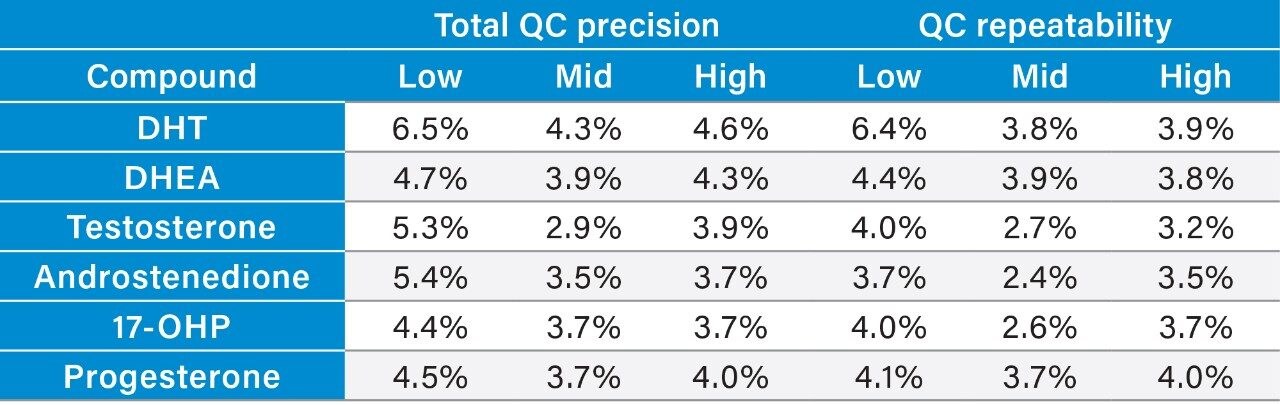
Total precision was determined by extracting and quantifying five replicates of three level QC material per day over five separate days (n=25). Repeatability was assessed by analyzing three replicates at each QC level. The total precision and repeatability is shown in Table 3. Low, mid, and high concentrations were 0.17, 3.4, and 26 nmol/L for DHT; 3.1, 6.9, and 52 nmol/L for DHEA; 0.052, 3.5, and 52 nmol/L for testosterone; 0.26, 7.0, and 262 nmol/L for androstenedione; 0.23, 6.1, and 227 nmol/L for 17-OHP; 0.19, 3.2, and 48 nmol/L for progesterone.

The method was shown to be linear for DHT (0.09–35 nmol/L), DHEA (0.17–69 nmol/L), testosterone (0.017- 69 nmol/L), androstenedione (0.035–350 nmol/L), 17-OHP (0.03–303 nmol/L), and progesterone (0.016–32 nmol/L) when different ratios of high and low concentration pools of the analytes were combined and analyzed. In addition, calibration lines in spiked 1% BSA in PBS were linear with coefficient of determinations (r2) >0.99 for all analyses.

Table 3. Total precision and repeatability for the analysis of DHT, DHEA,  testosterone,androstenedione, 17-OHP, and progesterone.

Matrix effect investigations for DHT, DHEA, testosterone, androstenedione, 17-OHP, and progesterone were performed using individual donor serum samples (n=6). The matrix factor calculated is shown in Table 4. Normalized matrix factor calculations, based on the analyte:internal standard response ratio demonstrated that the internal standards compensated for any ion suppression observed.

Table 4. Mean (range) matrix factor and %RSD based on both peak area and analyte:internal standard response ratio.

Accuracy was assessed for testosterone, androstenedione and 17-OHP through the analysis of EQA samples from UK NEQAS. The data obtained was compared to the mass spectrometry method mean for the samples and Deming regression was performed (Table 5). Bland-Altman agreement for testosterone, androstenedione, and 17-OHP demonstrated a mean method bias within ± 5.6%, demonstrating excellent agreement with the EQA mass spectrometry method mean for the steroid hormones (Figures 2A–C).

Table 5. Deming regression comparing the Waters UPLC-MS/MS method to the EQA scheme MS method for testosterone, androstenedione, and 17-OHP. P values <0.05 would indicate statistically significant bias.
Figure 2. Bland-Altman agreement comparing the Waters UPLC-MS/MS method to the EQA scheme MS method mean for (a) testosterone, (b) androstenedione, and (c) 17-OHP.

Accuracy for DHT was assessed through the analysis of Royal College of Pathologists of Australasia Quality Assurance Program (RCPA QAP) samples (n=4). Altman-Bland agreement demonstrated a mean bias of 4.9% (range -3% to 18%) for the samples compared to target values and a mean bias of 1.1% (range -4% to 7%) compared to the all laboratory mean (n≥8).

Comparison to an independent LC-MS/MS method for the analysis of DHT was performed using 32 samples. Bland-Altman agreement demonstrated a mean bias of -6.6% with the independent LC-MS/MS clinical research method, as seen in Figure 3. An example of method analytical sensitivity for low concentration steroid hormones in serum from the comparison is seen in Figure 4.

Figure 3. Bland-Altman agreement comparing the Waters UPLC-MS/MS method to an independent LC-MS/MS clinical research method for the analysis of DHT.
Figure 4. Low steroid hormone concentrations in serum containing androstenedione, testosterone, 17-OHP, DHEA, DHT, and progesterone.

Conclusion

An analytically sensitive and selective clinical research method has been developed for the analysis of DHT, DHEA, testosterone, androstenedione, 17-OHP, and progesterone in serum using the Xevo TQ-S micro.

The Xevo TQ-S micro enables this method to provide sufficient analytical sensitivity to analyze low levels of DHT, DHEA, testosterone, androstenedione, 17-OHP, and progesterone by using only 100 μL sample volume. Excellent levels of precision across the calibration range have been demonstrated. Accuracy assessment using EQA samples has shown the method provides excellent agreement for testosterone, androstenedione, 17-OHP, and DHT. Automation of the analytical method in combination with sample tracking capabilities of the liquid handler, through the use of the Tecan File Converter and MassLynx LIMS Interface, improves laboratory workflow and reduces sample handling, which alleviates the potential for operator error.

Acknowledgements

We would like to thank Professor Brian Keevil and colleagues at the University Hospital of South Manchester (UHSM), UK for providing samples for comparison purposes.

720006320, November 2019

Voltar ao início Voltar ao início