• Application Note

Method Development Tools for More Efficient Screening of Biopharmaceutical Method Conditions Using the ACQUITY Arc Bio System Part 1 of 2: Screening Multiple RPLC Columns for High Throughput Analysis

Method Development Tools for More Efficient Screening of Biopharmaceutical Method Conditions Using the ACQUITY Arc Bio System Part 1 of 2: Screening Multiple RPLC Columns for High Throughput Analysis

  • Brooke M. Koshel
  • Robert E. Birdsall
  • Ying Qing Yu
  • Waters Corporation

Abstract

This work demonstrates how the ACQUITY Arc Bio System can be used for simplifying method development. By incorporating the CM-A and CM-Aux column compartment modules with column switching capabilities, long sample sets can be queued up to screen various columns and method parameters in a timelier manner with minimal user intervention.

Benefits

  • Extended column switching capabilities for high throughput screening of multiple column chemistries and method conditions
  • Simplified peak tracking with the ACQUITY QDa Mass Detector for efficient monitoring of targeted peptides

Introduction

Although reversed-phase liquid chromatography (RPLC) is the most prevalent assay in many analytical laboratories, developing new methods for extracting the most information possible from these assays remains a challenge. Analytes are becoming increasingly more complex, and with an abundance of RPLC columns commercially available, it can be overwhelming for an analyst to determine which chemistries are the most appropriate for the intended analyte and application. Whether separating impurity components, performing quality control, or resolving various components of a complex mixture, screening multiple columns and method conditions is a critical piece of RPLC method development.

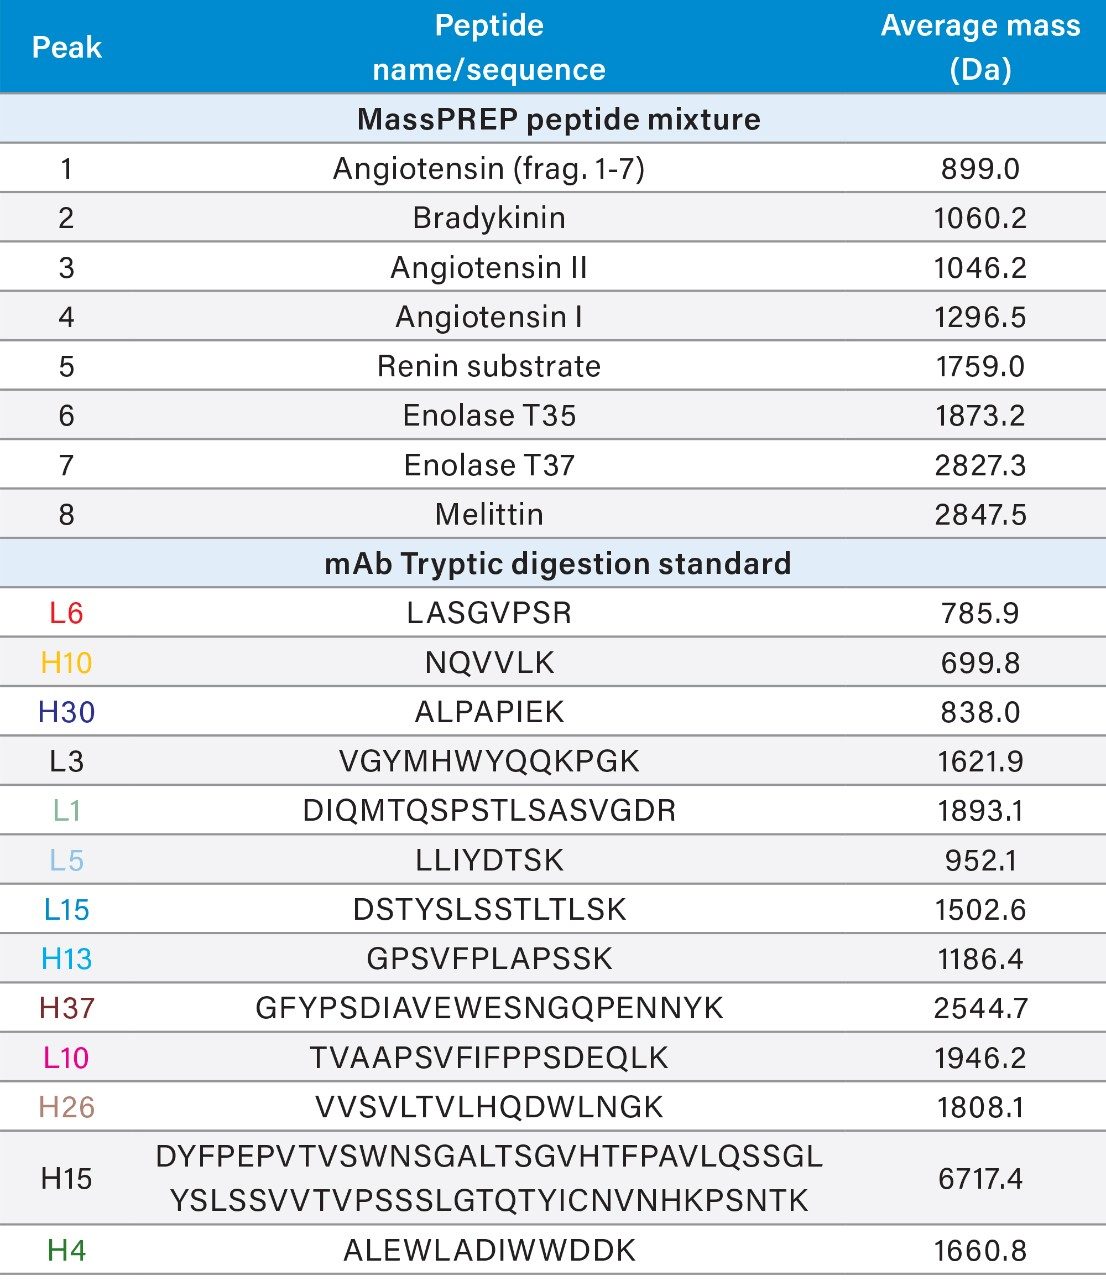
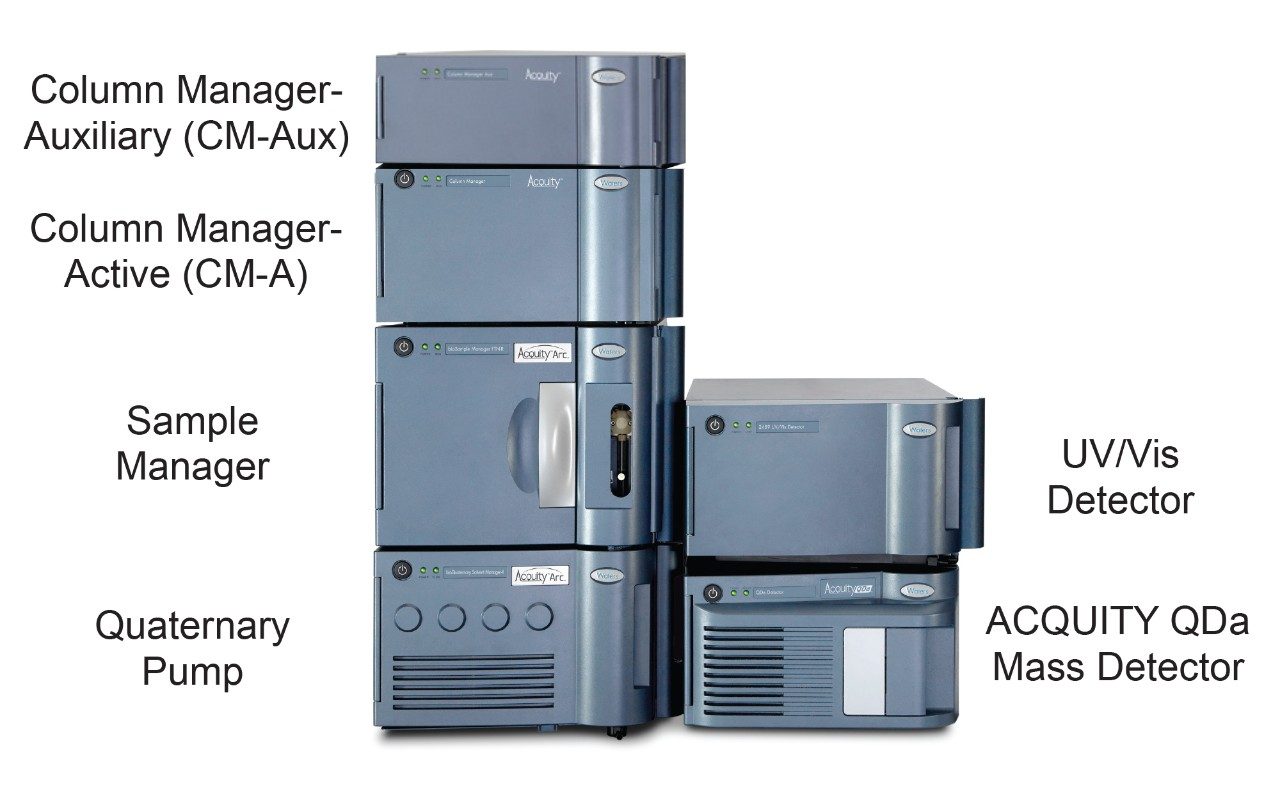
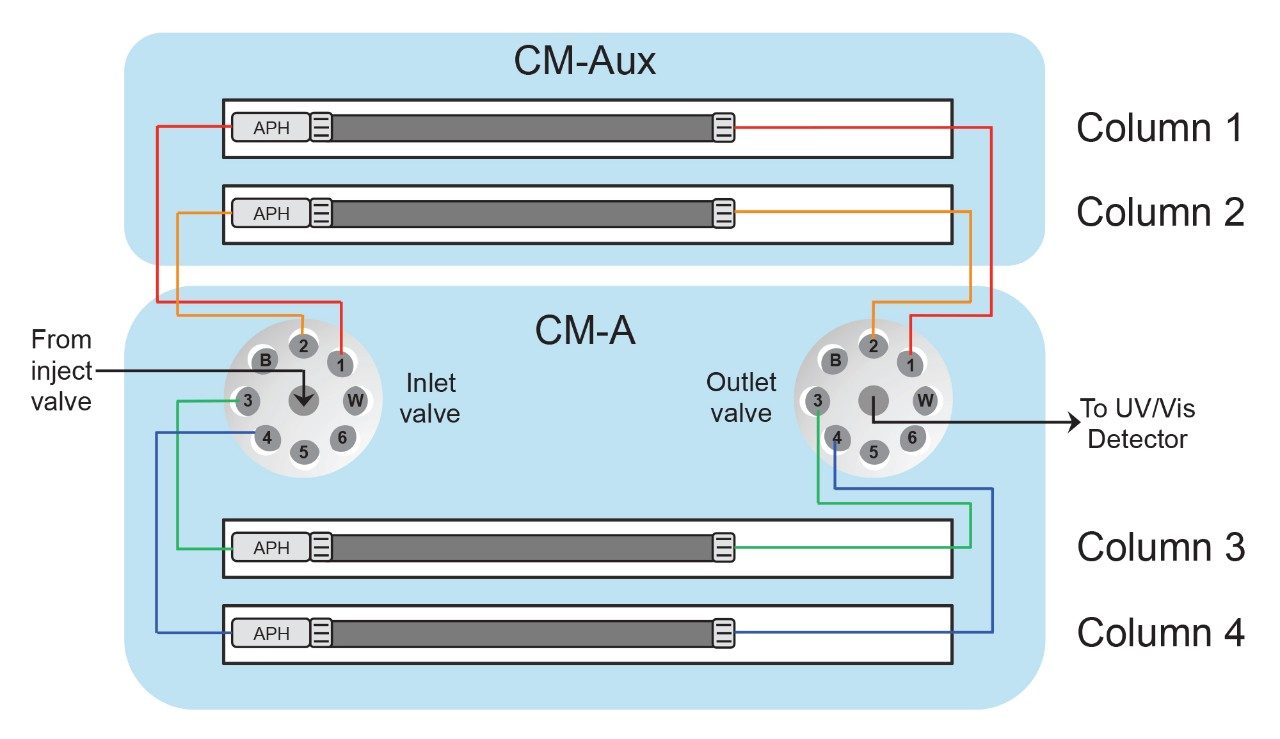
The objective of this two-part application note series is to demonstrate how features of the Waters ACQUITY Arc Bio System can help scientists work more efficiently and effectively. In part 1, peptide mapping is used to demonstrate how four columns can be screened in a single sample set through the use of column switching valves. Column chemistries were selected to intentionally highlight key differences in elution behavior, and by incorporating the ACQUITY QDa Mass Detector, selectivity of targeted peptides can be monitored across the respective columns. In part 2, column switching capabilities and buffer preparation technology are used to show how changes in pH and ionic strength impact size exclusion chromatography (SEC) and ion exchange chromatography (IEX). By incorporating features such as column switching and buffer preparation technology, multiple columns and method conditions can be screened in series in a timelier manner within a single sample set.

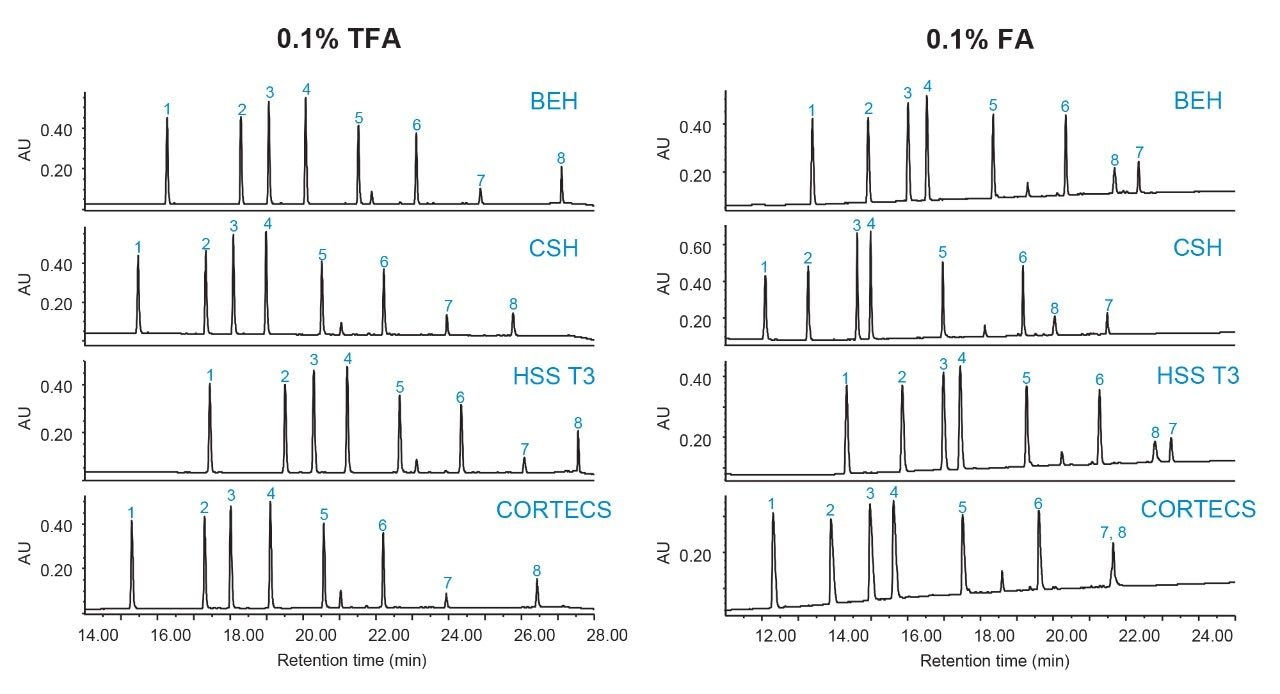
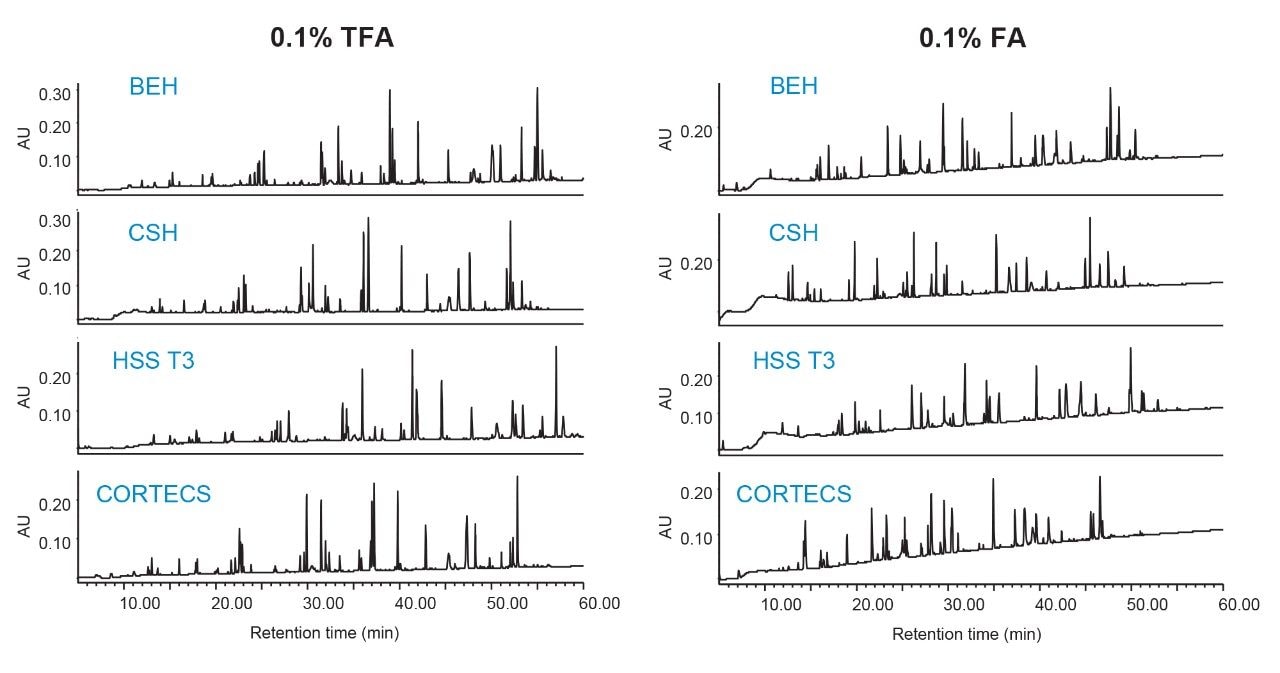
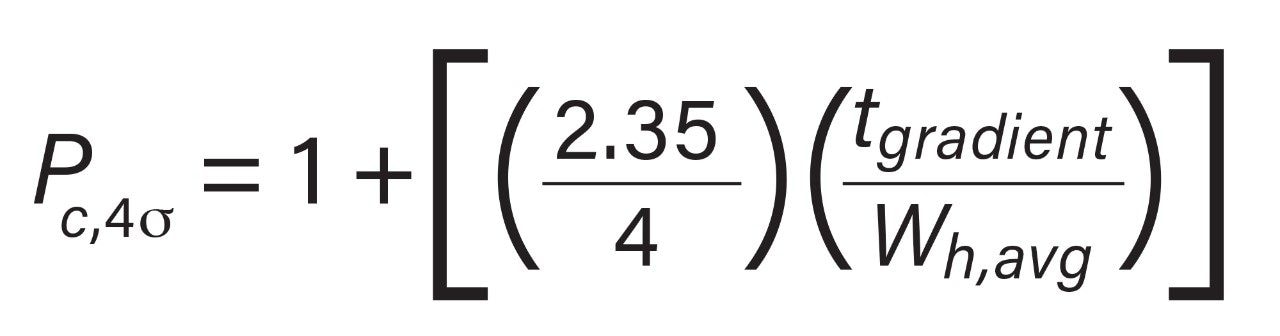
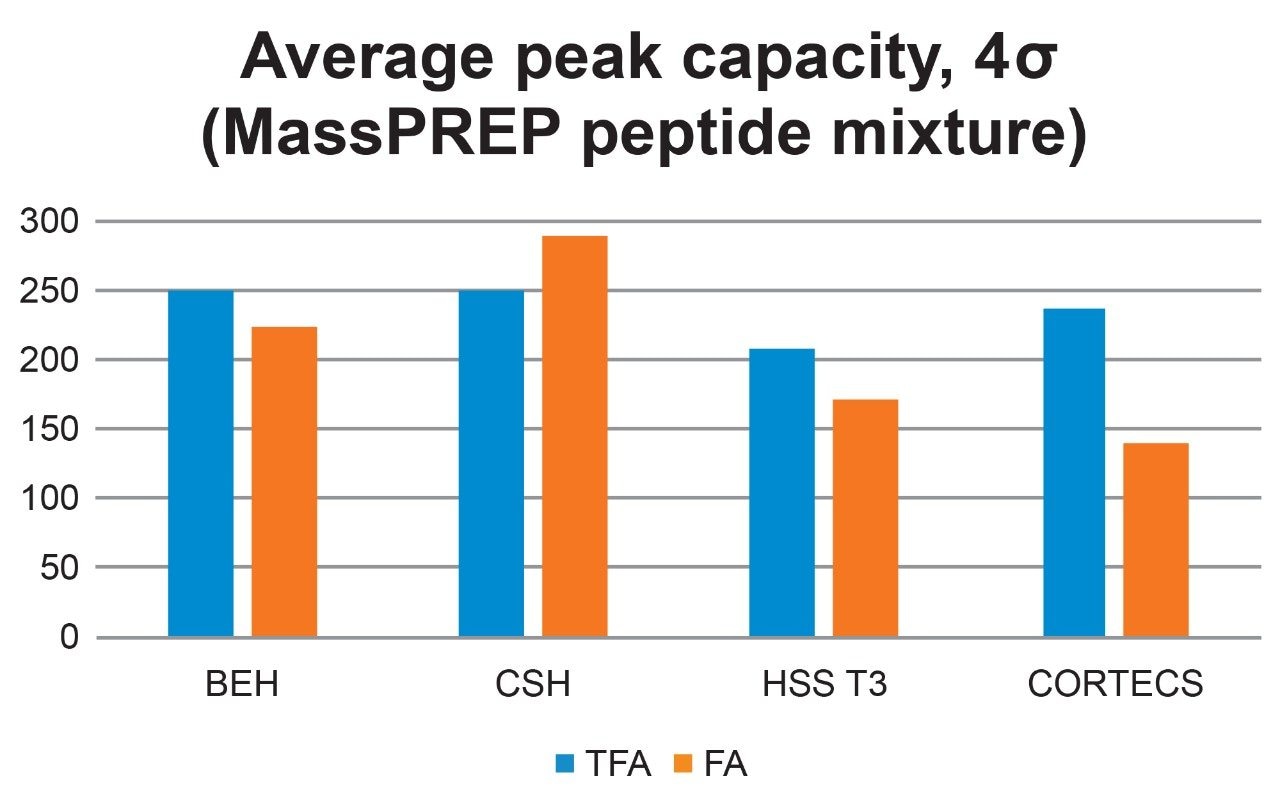
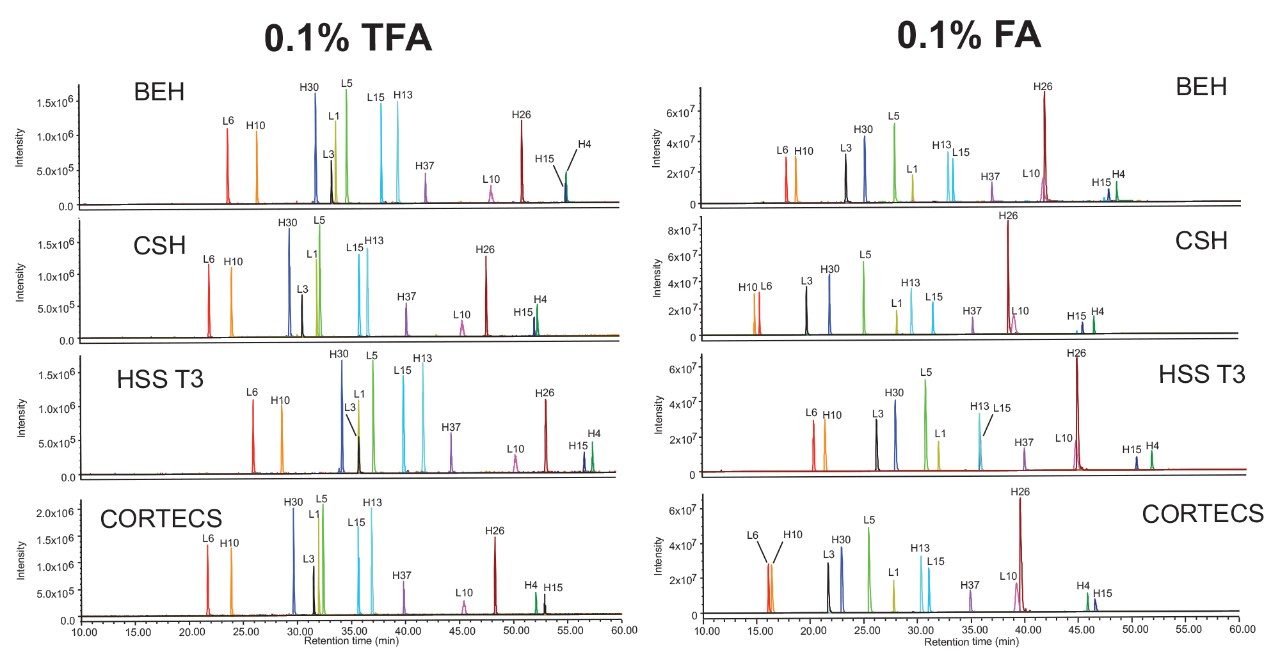
In this study, stationary phase and mobile phase additives are evaluated as two important parameters effecting RPLC method performance. By selecting four column chemistries with diverse characteristics and using the two most common mobile phase additives, a high-level screening protocol can be conducted to determine which chemistries and conditions should be further evaluated. Peak capacity is used as a metric to evaluate column performance across all four columns in both trifluoroacetic acid (TFA) and formic acid (FA). Selectivity differences can be reported for selected peptides of a NIST mAb tryptic digest standard using the ACQUITY QDa Mass Detector. By tracking peptides of interest, methods for targeted monitoring can be further developed.

Experimental

Sample description

Waters MassPREP Peptide Mixture (p/n: 186002337) was reconstituted in 100 μL of water to give a final sample concentration of ~15 μg/mL per peptide. Waters mAb Tryptic Digestion Standard (p/n: 186009126), a reduced and alkylated tryptic digest of the NIST mAb, was reconstituted in water to a concentration of ~0.5 μg/μL. Multiple vials of each standard were pooled and aliquoted so that sample composition was consistent between TFA and FA sample sets. (Table 1 contains peptide identification or sequence information and average mass for selected peptides.)

LC conditions

LC system:

ACQUITY Arc Bio System with CM-A and CM-Aux

Detector:

2489 UV/Visible (UV/Vis) Detector

Columns:

XBridge BEH C18 XP, 130 Å, 2.5 μm, 4.6 × 150 mm

XSelect CSH C18 XP, 130 Å, 2.5 μm, 4.6 × 150 mm

XSelect Peptide HSS T3 C18, 100 Å, 2.5 μm, 4.6 × 150 mm

CORTECS C18, 90 Å, 2.7 μm, 4.6 mm × 150 mm

Wavelength:

214 nm

Injection volume:

40 μL (peptide standard) 30 μL (mAb tryptic digest)

Column temp.:

60 °C

Flow rate:

0.600 mL/min

Mobile phase A:

Water, 0.1% TFA (v/v) or Water, 0.1% FA (v/v)

Mobile phase B:

Acetonitrile, 0.1% TFA (v/v) or Acetonitrile, 0.1% FA (v/v)

Gradient:

0.5 to 45.0% B over 20 minutes (peptide standard) 0.5 to 45% B over 60 minutes (mAb tryptic digest)

MS conditions

MS system:

ACQUITY QDa Mass Detector, performance model

Ionization mode:

ESI+, MS scan

Mass range:

300–1250 Da

Capillary voltage:

1.5 kV

Cone voltage:

10 V

Probe temp.:

600 °C

Data management

Empower 3 Chromatography Data Software SR2, FR4

Table 1. Peptide standards and associated molecular weight information. NIST mAb digest peptides are designated light chain (L) or heavy chain (H) origin.

Results and Discussion

An ACQUITY Arc Bio System with a CM-A column manager and associated CM-Aux unit was used to configure four-column switching with an ACQUITY QDa Mass Detector placed in line post optical detection (Figure 1). In this configuration, the CM-A module acts as the master to the auxiliary unit and houses the valves for column selection. Both the CM-A and CM-Aux can accommodate two 4.6 × 150 mm columns. A second CM-Aux unit can also be incorporated to house two additional columns for up to six 4.6 × 150 mm columns, although an additional auxiliary unit was not configured in this study.

Figure 1. The ACQUITY Arc Bio System is configured with CM-A and CM-Aux column compartment modules, which can accommodate up to four 4.6 × 150 mm columns. The CM-A module acts as the master to the auxiliary unit, and houses the valves for column selection. An ACQUITY QDa Mass Detector is configured post-optical detection.

Because of the many RPLC columns available, it can often be challenging to select the best one for the intended analyte and application. In peptide mapping, narrow peaks and minimal peak tailing are desirable for obtaining the maximum amount of information from a chromatogram. Although TFA yields greater peak capacities compared to FA, there is an obvious trade-off in MS sensitivity, should MS be required in the analysis. In an effort to better understand the balance between chromatographic and mass spectrometric performance, both optical and MS performance were evaluated using four different column chemistries in both TFA and FA.

Figure 2 further details the plumbing diagram used for four-column switching.  From Figure 2, flow is directed from the injection valve through one of four columns, as selected by the user, before finally reaching the detectors. Because retention time and peak shape will be compared across columns, it is important that all inlet and outlet tubing connections have the same dimensions to ensure that dwell volume and extra column dispersion are held constant. Column selection can be designated in the Empower console or indicated in the instrument method. This allows for all valve switching between columns to be carried out automatically by the Empower software so that manual determination of valve-switching events is avoided. This is especially helpful when creating larger and more complex sample sets.

Figure 2. Column manager configuration and plumbing diagram for screening four columns. Flow is directed from the injection valve through one of four columns to the optical detector. Column selection is indicated by the user in the instrument method so that valve switching is carried out automatically through the Empower software. Colored tubing represents one of four independent flow paths through the user-selected column, while black tubing represents a shared flow path. All inlet and outlet tubing uses the same dimensions, so that dwell volume and extra column dispersion are maintained across all columns.

In the first set of experiments, FA was used to run a short 20-minute gradient with the Waters MassPREP Peptide Mixture. A single sample set can be used where programmed column switching allows for all four columns to be conditioned and screened in series. A longer 60-minute gradient was then used to evaluate the Waters mAb Tryptic Digestion Standard. The same set of experiments were then conducted in TFA. Because TFA is a strong acid, the column and system must be properly conditioned when switching from TFA to FA. Although a quaternary pump offers the potential to screen FA and TFA in the same sample set, through the ability to select from four mobile phase reservoirs with the standard system configuration, this work used dedicated columns for each additive or ion-pairing agent to minimize crosstalk.

Figures 3 and 4 show chromatographic results in TFA and FA for the peptide standard mix and NIST mAb digest standard across a diverse set of column chemistries: ethylene bridged hybrid (BEH), charged surface hybrid (CSH), high strength silica with proprietary T3 bonding (HSS T3), and solid-core CORTECS. (For more information on particle technology and chemistries, please visit waters.com.) As expected, TFA results show lower baseline noise and narrower peak widths (evidenced by higher peak capacities, Figure 5). HSS T3 is the most retentive column used, and peaks have longer elution times. By incorporating the ACQUITY QDa Mass Detector, peaks were readily monitored across column chemistries and method conditions to evaluate changes in selectivity. An example is shown in Figure 3 where selectivity differences for the peptide standard were observed between TFA and FA in which enolase T37 and melittin elute in the opposite order in FA, and even co-elute in FA when using the CORTECS Column.

Figure 3. Comparison of MassPREP Peptide Mixture chromatographic results in TFA and FA for BEH, CSH, HSS T3, and CORTECS column chemistries. (Table 1 contains peptide identification and molecular weight information.)
Figure 4. Comparison of NIST mAb digestion standard chromatographic results in TFA and FA for BEH, CSH, HSS T3, and CORTECS column chemistries. (Table 1 contains select peptides and molecular weight information.)

Because the peptide standard mix is not a complex sample and shows well resolved peaks, it is useful in determining peak capacity for each of the peptides across the different column chemistries. Figure 5 reports the average peak capacity at 4σ of the peptide standard under each of the conditions tested, and is reported according to the following equation:

Where tgradient is the gradient time and wh,avg is the average peak width at half-height. Peak capacity is consistently high in TFA across all column chemistries and is the lowest in FA with CORTECS. It is also worth noting that peak capacity is reported as an average and that individual peptides may trend differently under one set of conditions compared to another.1

Figure 5. Average peak capacity of peptide standards in TFA and FA for BEH, CSH, HSS T3, and CORTECS column chemistries. (Table 1 contains peptide identification and molecular weight information.)

The NIST mAb digestion standard was used to demonstrate selectivity differences across the column chemistries. The ACQUITY QDa Mass Detector was used to collect full scan data for both TFA and FA data sets. XICs of selected peptides (Table 1) are shown in Figure 6.

Figure 6. Comparison of NIST mAb digestion standard ACQUITY QDa Mass Detector results in TFA and FA for BEH, CSH, HSS T3, and CORTECS column chemistries. XICs of targeted peptides indicate selectivity differences in TFA and FA across the different column chemistries. (Table 1 contains select targeted peptides and molecular weight information.)

Peptides were selected based on elution throughout the chromatograms of the selected chemistries and method conditions and are not representative of all tryptic peptides. Should full sequence coverage be desired, high resolution characterization would be required. Although general elution patterns between TFA and FA show some similarities, a number of coelutions are present. For example, the L10 and H26 peptides partially coelute in all FA experiments but are well resolved in TFA. The H15 and H4 peptides also show changes in elution order among the different chemistries. It can be envisioned that, if any of these coelutions were a critical pair in a targeted peptide map, a column should be selected that maximizes resolution between the peptides of interest. FA is also shown to provide greater sensitivity, which must also be a consideration when monitoring lower abundance species. The ACQUITY Arc Bio System allows a user to screen multiple columns in series to more readily determine which column and mobile phase additive is most appropriate for the intended analyte and application. After conducting a high level screening protocol, the method can be further optimized as needed.

Conclusion

This work demonstrates how the ACQUITY Arc Bio System can be used for simplifying method development. By incorporating the CM-A and CM-Aux column compartment modules with column switching capabilities, long sample sets can be queued up to screen various columns and method parameters in a timelier manner with minimal user intervention. In peptide mapping, targeted peptides were monitored with the ACQUITY QDa Mass Detector across four different column chemistries in both TFA and FA. By calculating peak capacity and monitoring coelutions, more informed decisions can be made for selecting the column best suited for a given analysis. Column switching is a useful tool for rapidly screening method conditions for a more streamlined approach to method development.

References

  1. Koza, S. M. and Chambers, E. E. Selecting a Reversed-Phase Column for the Peptide Mapping Analysis of a Biotherapeutic Protein. Waters Application Note, 720005924EN, 2017.

720006847, April 2020

Voltar ao início Voltar ao início