AOAC Method Transfer: Determination of Phenolic Compounds in Dietary Supplements and Dietary Ingredients Containing Echinacea Using the Arc™ HPLC and UV-Vis Detector
Abstract
Phenolic compounds such as caftaric acid, chlorogenic acid, cynarin, echinacoside, and cichoric acid are commonly found in dietary supplements and dietary ingredients containing echinacea. The method in this application note is a direct method transfer of AOAC Official Method 2018.08.1 The official method describes the minimum recommended performance characteristics to be used to evaluate the successful set-up of the method. The use of an Arc HPLC System coupled with ultraviolet/visible light (UV/Vis) detection, combined with a CORTECS™ T3 Analytical Column and Empower™ 3 Chromatography Data System (CDS) software, demonstrated a method transfer which meets the requirements of the AOAC method for the determination of phenolic compounds in echinacea tea, capsules, and liquids.
Benefits
- Use of the Arc HPLC results in the transferred method having a shorter analysis time, lower flow rate, and less solvent consumption, supporting increased laboratory efficiency
- The CORTECS T3 Column improved the separation of closely eluting compounds, method reproducibility, and accuracy, surpassing the minimum recommended performance characteristics of the AOAC method
- Simple gradient liquid chromatography (LC) method transfer using the Waters™ Column Calculator tool
Introduction
Phenolic compounds such as caftaric acid, chlorogenic acid, cynarin, echinacoside, and cichoric acid are commonly found in echinacea supplements and are most often used for the prevention and treatment of upper respiratory tract infections, such as common colds and the flu, and as an immune stimulant.2 Echinacea was the most frequently used nonvitamin/nonmineral dietary supplement and natural product among adults and children.3 The variety of echinacea products has continued to grow as its use has become increasingly popular. The AOAC published Standard Method Performance Requirements (SPMRs) with AOAC Official Method 2018.08 Phenolic Compounds in Dietary Supplements and Dietary Ingredients Containing Echinacea HPLC-UV First Action 2018. The SPMR describes the minimum recommended performance characteristics to be used to evaluate methods. This application note demonstrates the successful transfer of AOAC method 2018.08 onto an Arc HPLC System coupled with UV-Vis detection, a CORTECS T3 Column, and Empower 3 CDS software.
Experimental
Materials and Reagents
Standard Compounds
Caftaric acid, chlorogenic acid, cynarin, and echinacoside were obtained from Cayman Chemical. The cichoric acid standard was obtained from Fisher Scientific.
Reagents
Acetonitrile and methanol (HPLC grade) were obtained from Honeywell Research Chemicals.
Phosphoric acid LiChropur™, 85% from Supelco.
Water from PureLab flex ELGA system (LabWater United States of America)
Products containing the phenolic compounds were purchased from local retailers (Massachusetts).
Sample Preparation
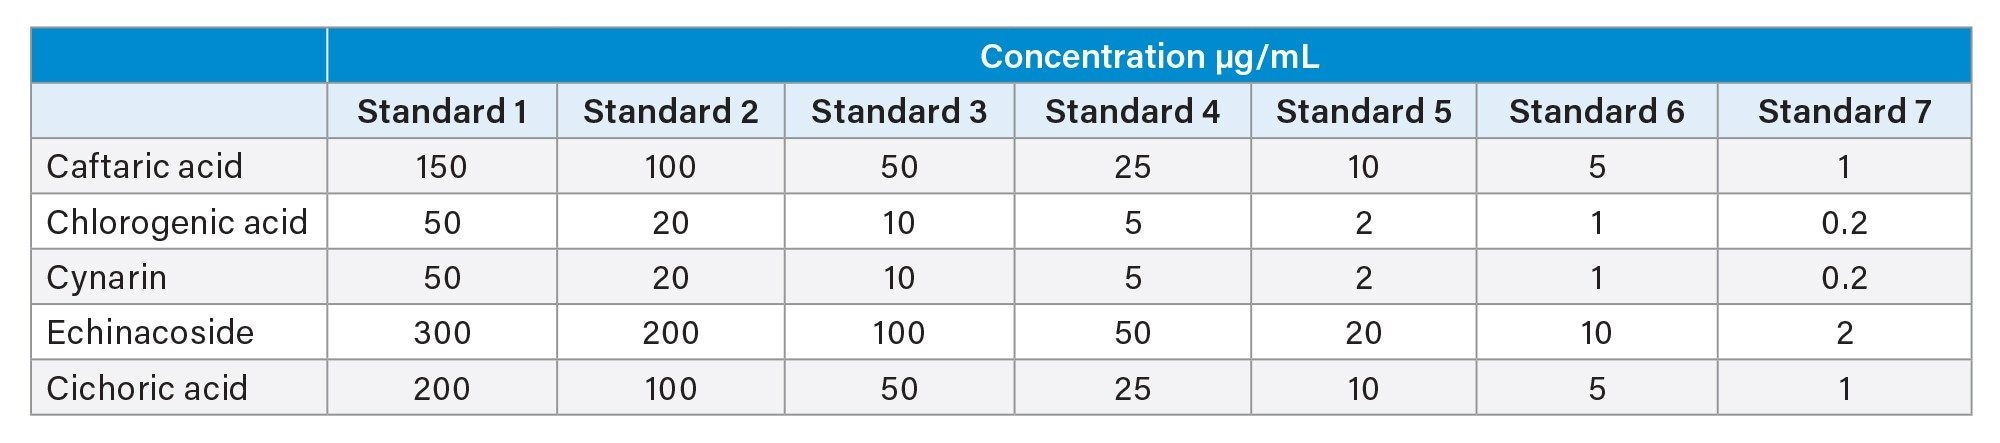
Preparation of calibration standards: Individual standards were prepared at 1000 µg/mL in 60:40 (v/v) methanol:water and stored at -20 °C.
The calibration concentration range of the standards is described below.
Sample preparation: as outlined in the AOAC method
LC Conditions
|
LC system: |
Arc HPLC System |
|
Detection: |
PDA single wavelength at 330 nm 2998 PDA Spectrum 200–600 nm |
|
Vials: |
LCGC Certified Clear Glass, Max Recovery, with Cap and Preslit PTFE/Silicone Septum, 1.5 mL (p/n: 186000327C) |
|
Filter: |
Syringe Filter 0.2 μm PTFE (p/n: WAT200556) |
|
Column(s): |
CORTECS T3 Column, 120 Å, 2.7 µm, 3 mm x 100 mm, (p/n: 186008489) |
|
Column temperature: |
25 °C |
|
Sample temperature: |
5 °C |
|
Injection volume: |
3 μL for tea and capsule and 2 μL for concentrate liquid sample |
|
Flow rate: |
1.18 mL/min |
|
Mobile phase: A: |
0.1% phosphoric acid in water |
|
Mobile phase B: |
acetonitrile |
|
Sample diluent: |
60:40 methanol:water |
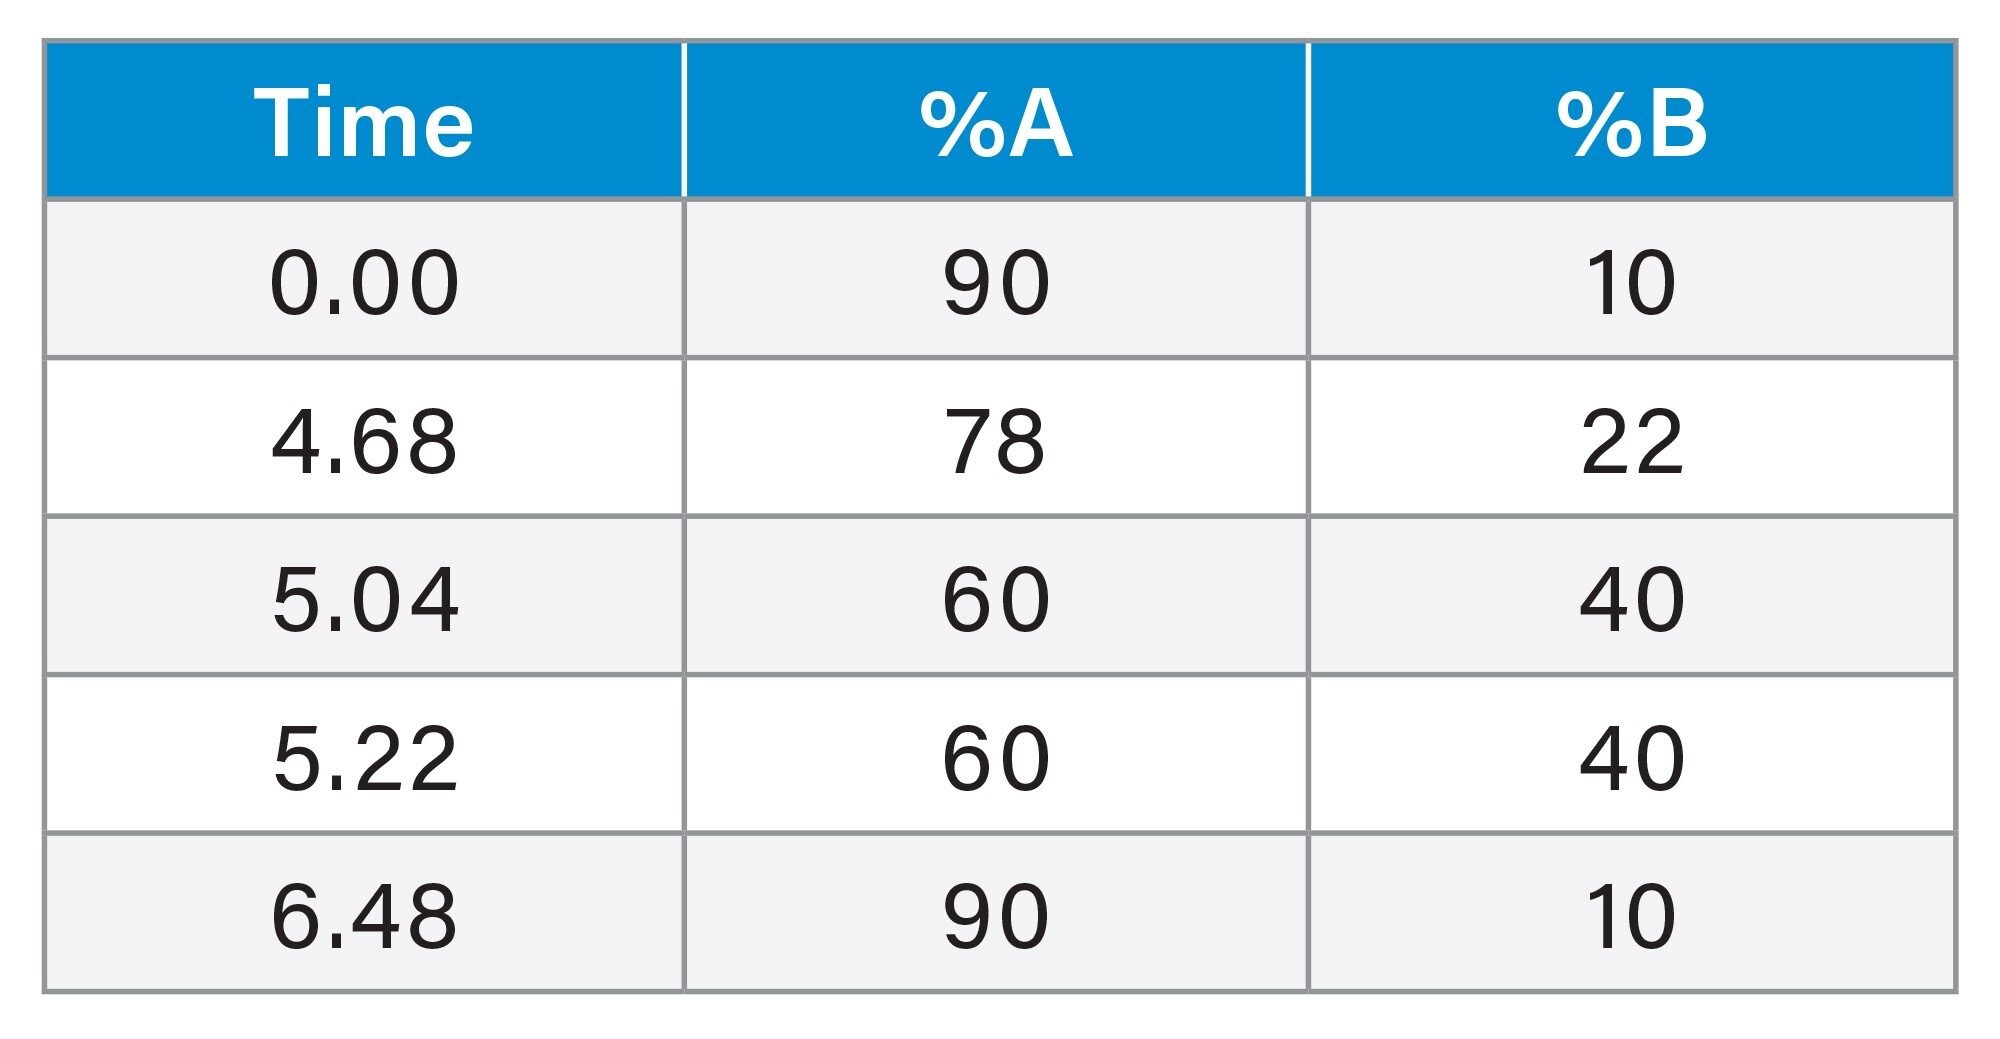
Gradient from the Method Transfer
Results and Discussion
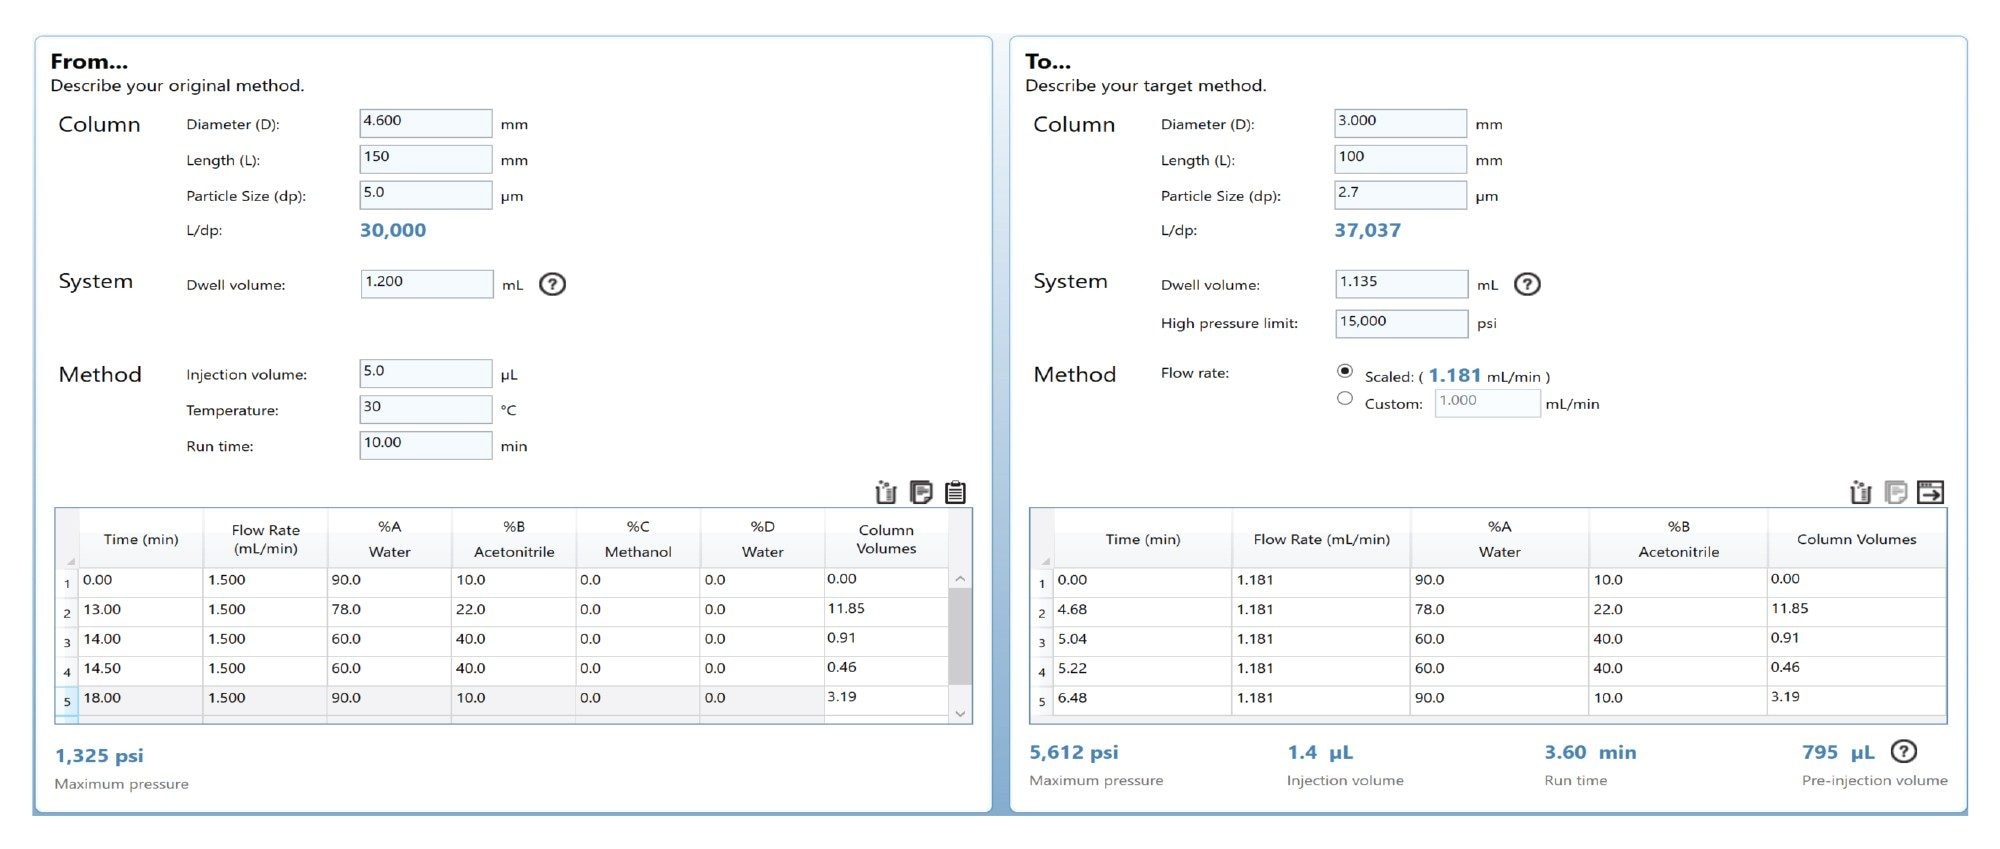
Using the Waters Column Calculator 2.0 tool,4 the liquid chromatography method conditions were transferred and correctly scaled in terms of column dimensions, gradient column volumes, system dwell volume, and injection volume onto a CORTECS T3 Column. The column in the AOAC method uses a 5 µm particle size, C18 reversed-phase column, however, the use of the modern Arc HPLC System allows for the use of a CORTECS T3 with a 2.7 µm particle size. The benefits of the smaller particle size allow for a reduction in the length of the column whilst still retaining the required chromatographic performance. This results in a shorter run time and reduces mobile phase consumption. Figure 1 shows the column calculator tool used to transfer the original gradient to the CORTECS T3 Column.
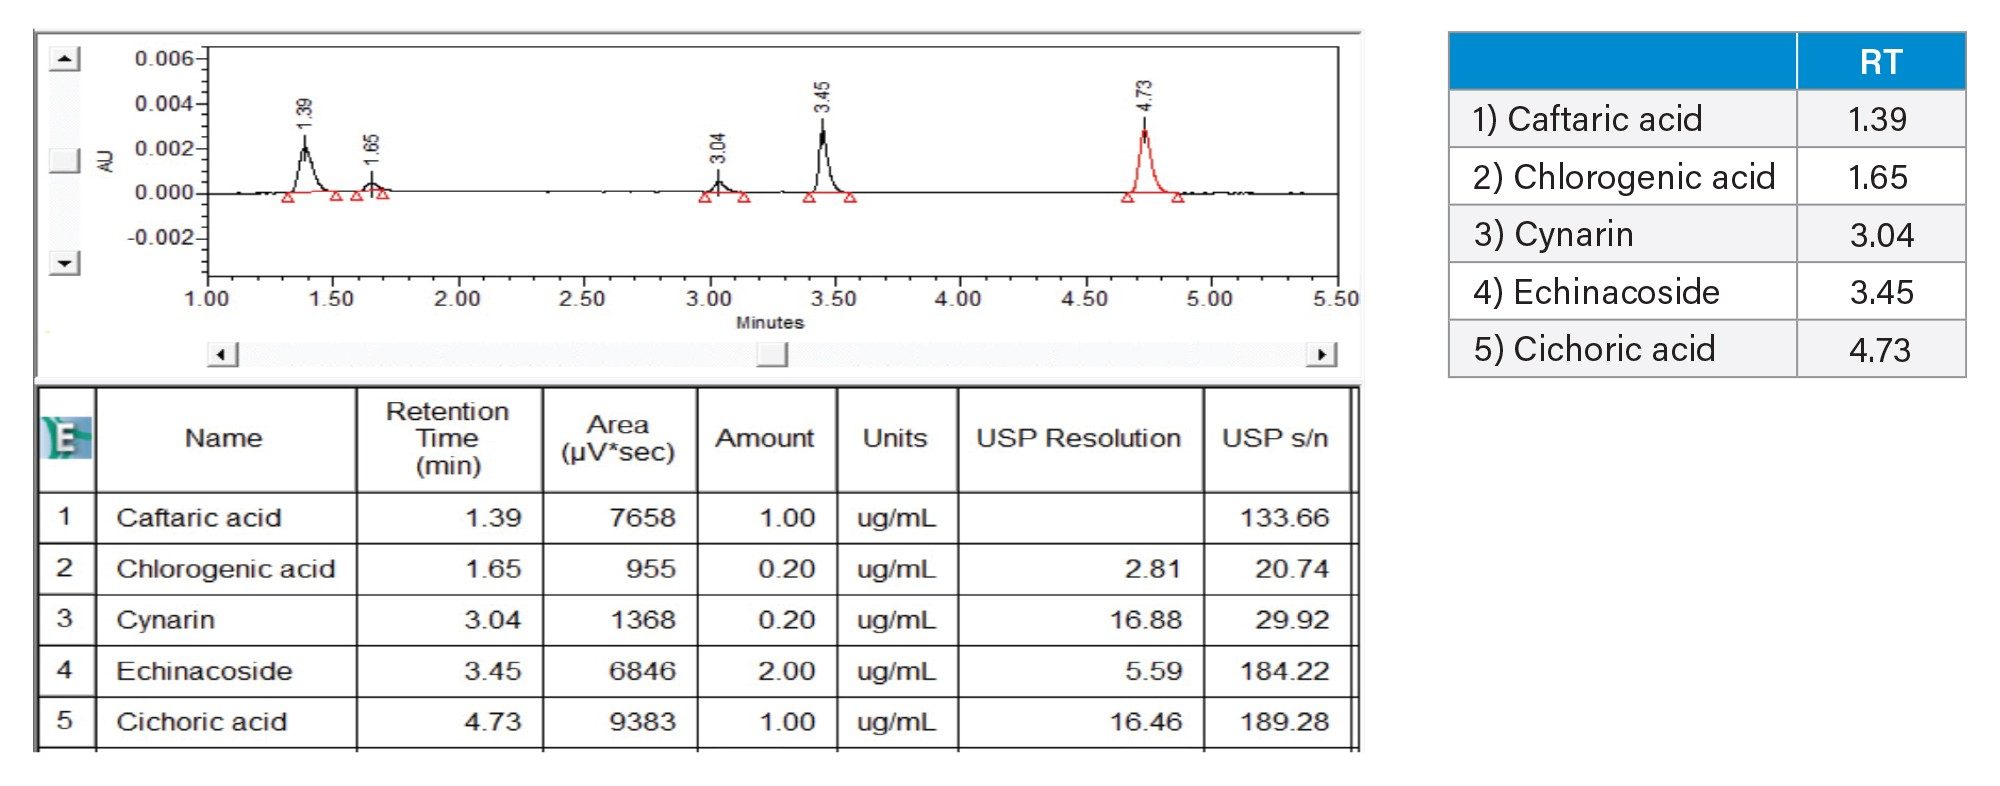
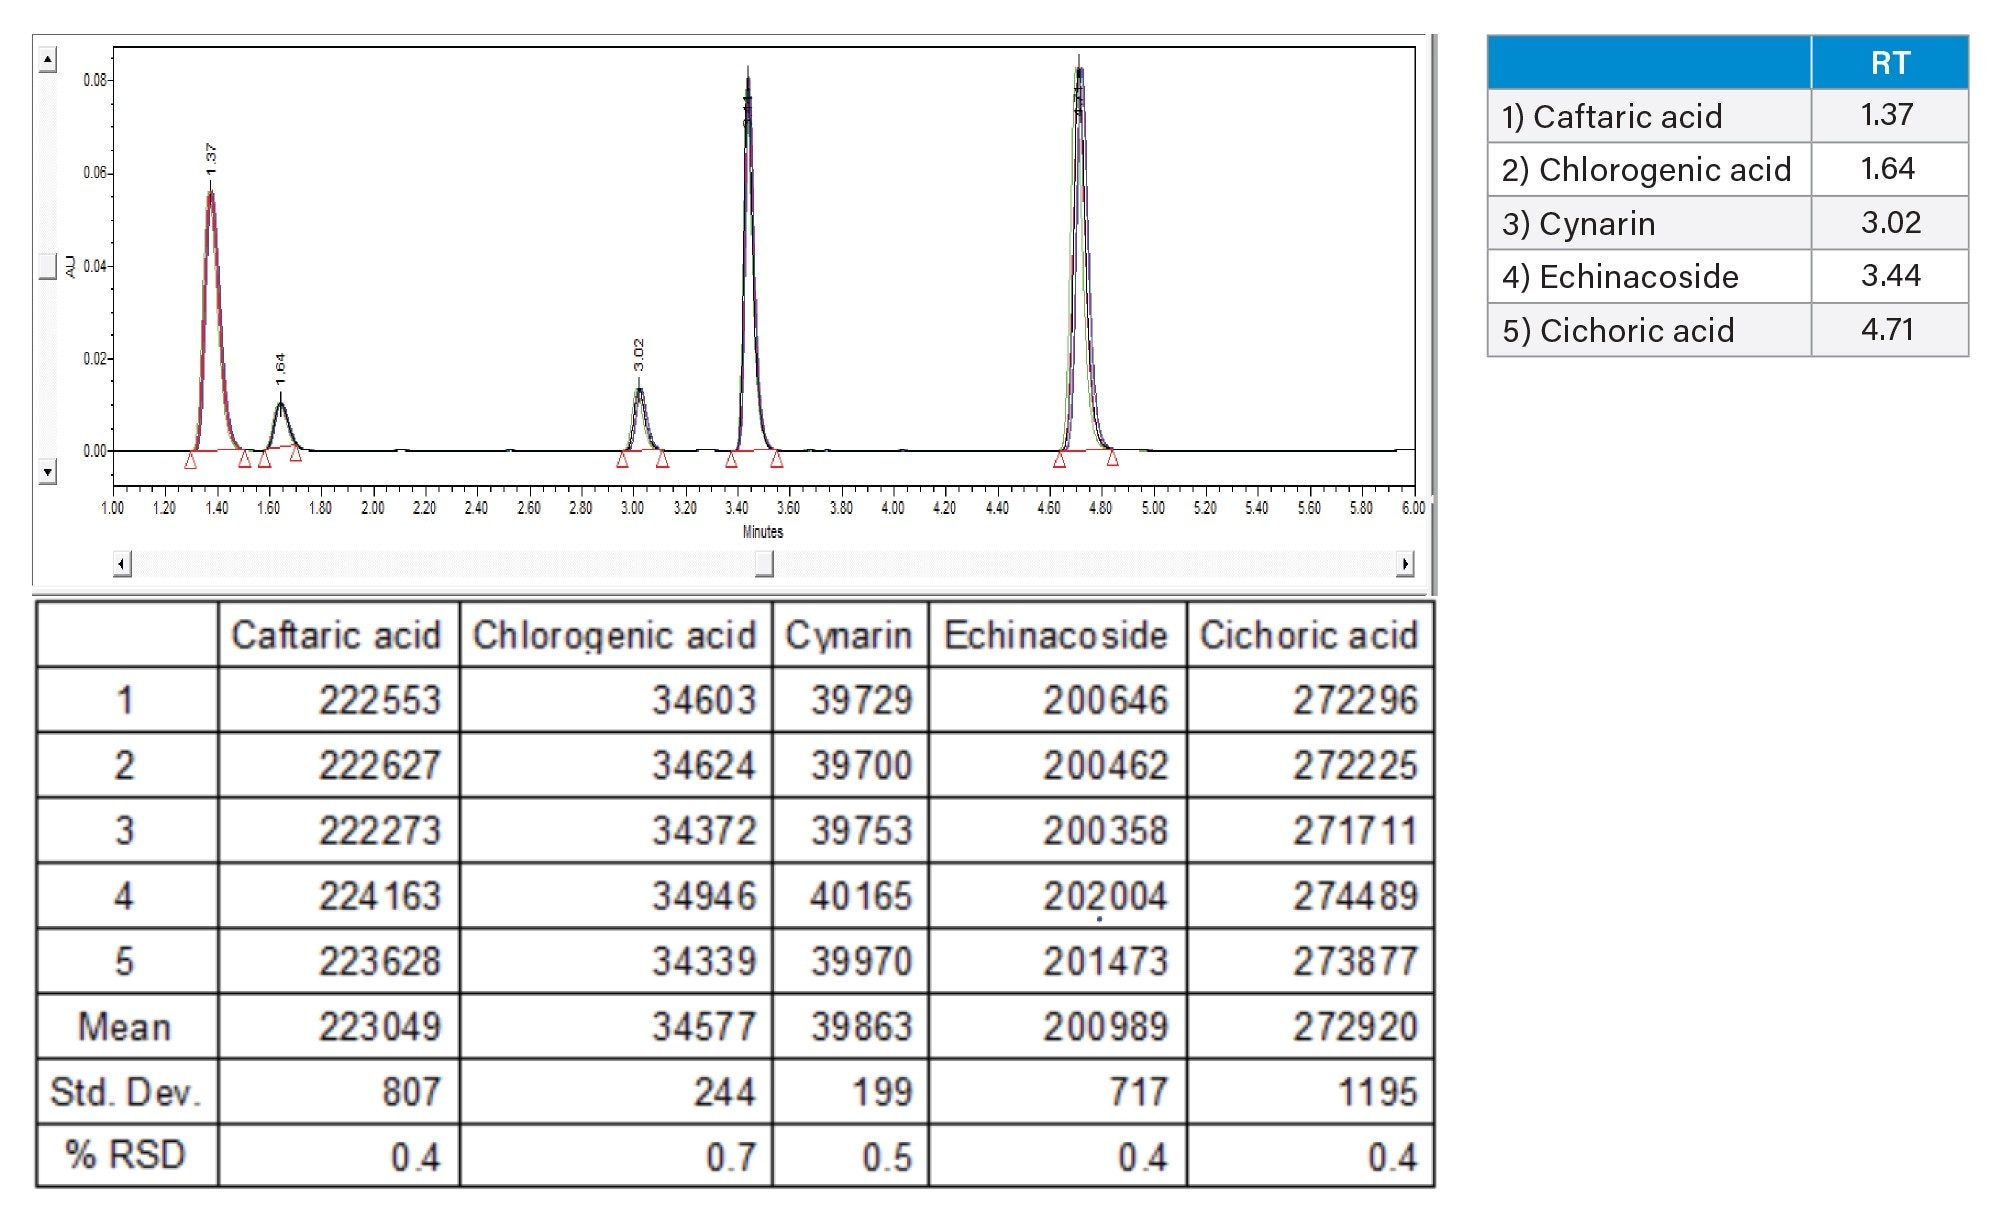
Signal to noise, resolution and tailing factor of the lowest calibration standard #7 were determined using the Empower CDS software. The resolution of all phenolic compounds studied here was ≥2.8. The limit of detection (LOD) and limit of quantitation (LOQ) of the method were below calibration standard #7. The chromatogram of separation for the phenolic compounds of calibration standard #7 on the CORTECS T3 Column is shown in Figure 2.
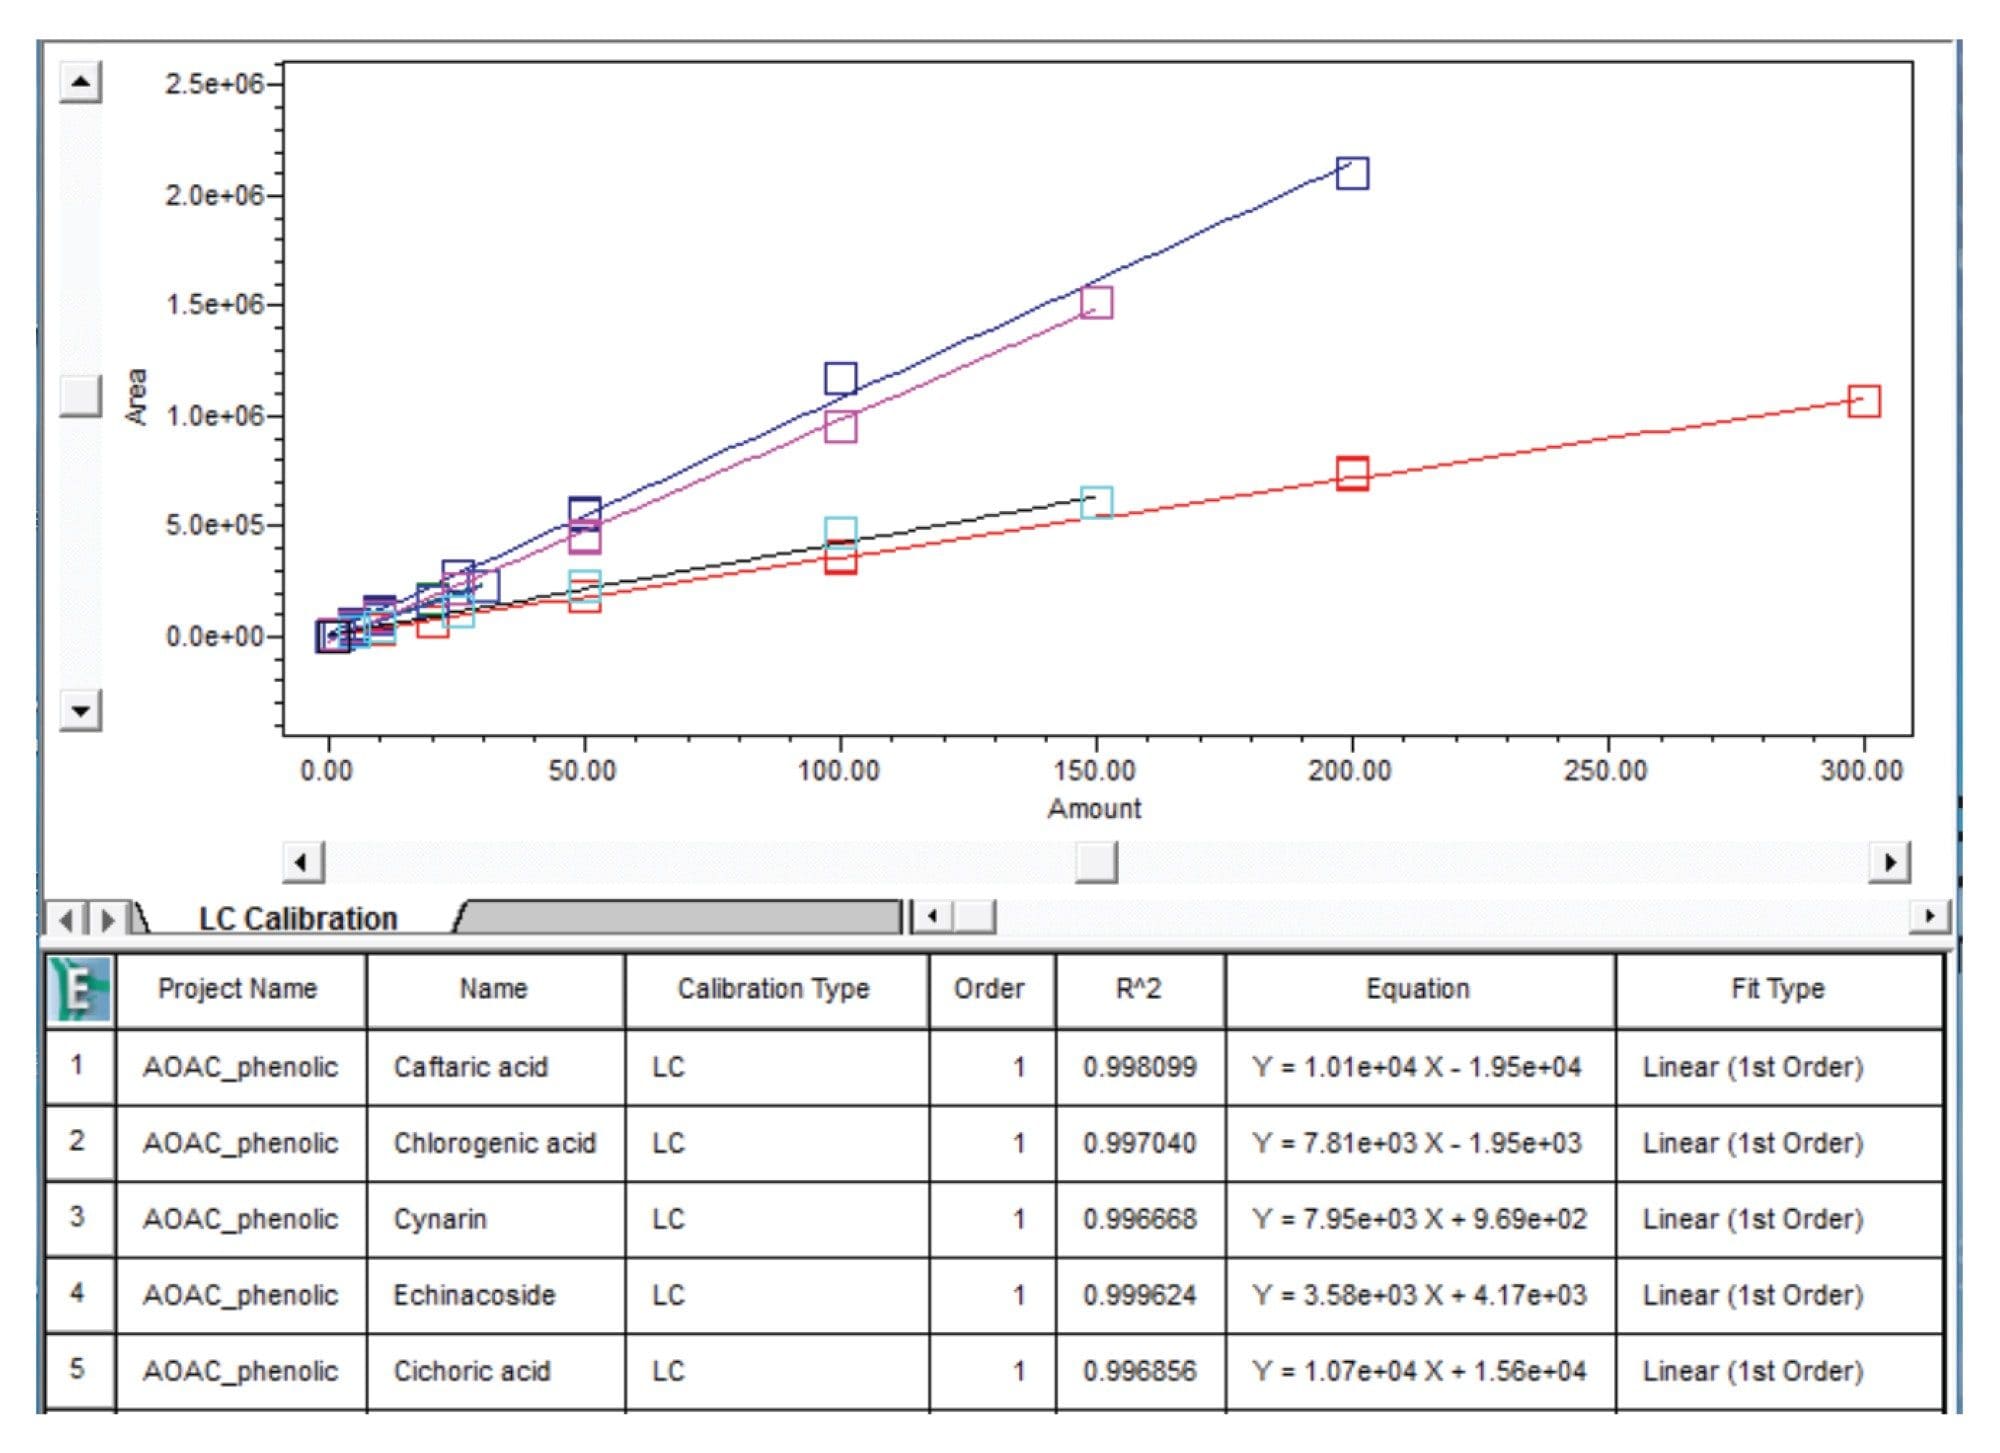
Calibration Curve: Linearity, the Precision of Area, and Retention Time
The multi-point calibration curves for phenolic compounds were prepared as described in the sample preparation section of the AOAC method. The calibration curves showed good linearity (R2≥0.995) and are shown in Figure 3.
System Suitability
The determination of system suitability is recommended in the AOAC method by injecting five replicates of calibration standard #4. The chromatogram of calibration standard #4 is shown in Figure 4 along with the %RSD achieved from the five replicate injections. The %RSD of the area of each phenolic compound were all <0.7%, well within the SMPR limits laid out in the official method.
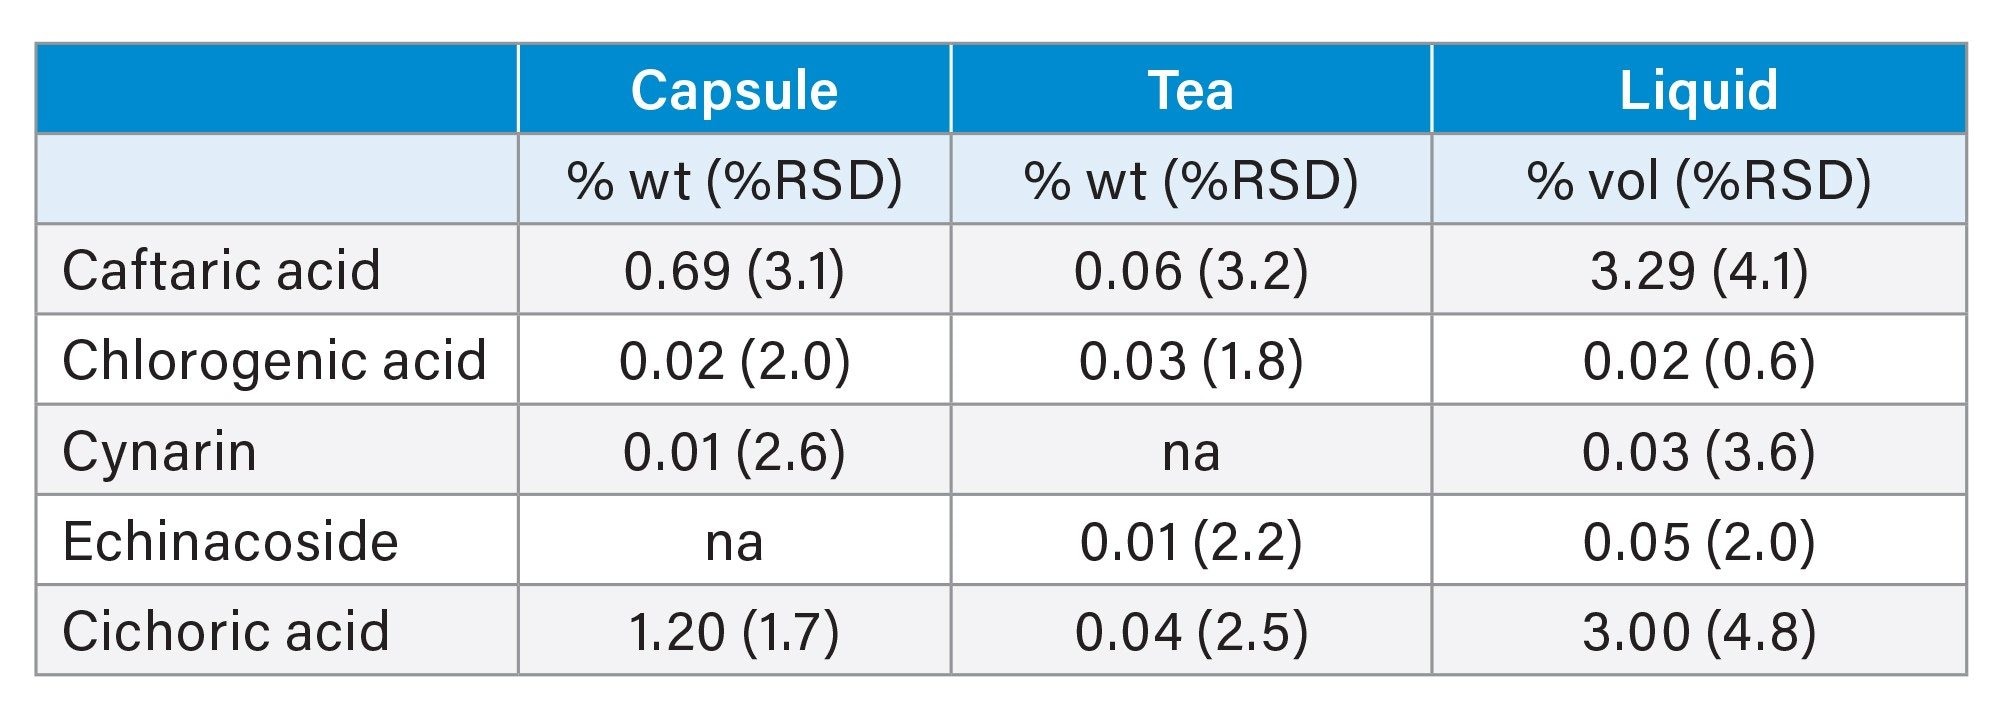
Analysis of Phenolic Compound Products
Samples were prepared in three replicates, and the amount of each phenolic compound was calculated by the percent weight of the echinacea capsules and tea. For the liquid echinacea, the result was calculated by percent volume. The quantitative results with %RSD for the analysis of the phenolic compound-containing products is shown in Table 1.
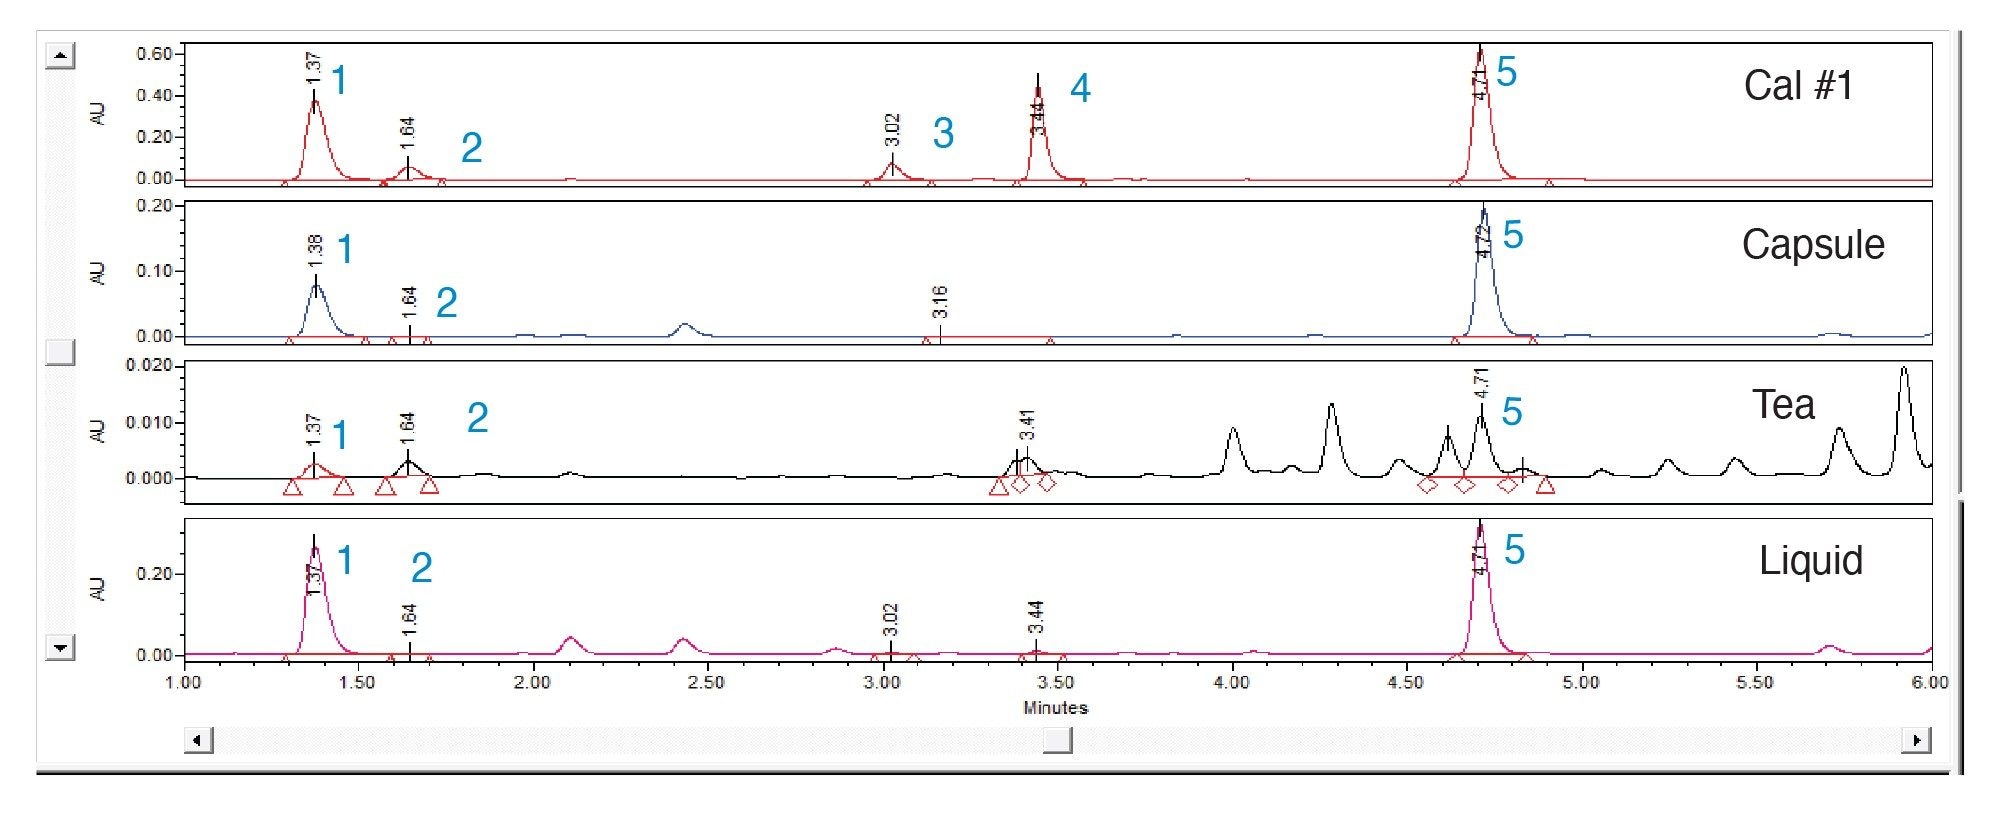
A representative chromatogram of the analysis of phenolic compound-containing products is shown in Figure 5.
Conclusion
This application note summarizes the successful method transfer of AOAC Method 2018.08 onto an Arc HPLC System using a CORTECS T3 Column with a 2.7 µm particle size. The use of solid-core column technology has enabled improvements in the separation between caftaric acid and chlorogenic acid as well as between cynarin and echinacoside. The increased separation efficiency achieved using the CORTECS T3 Column not only allows for easier integration of the targeted compound peaks, but also provided better separation between the target compounds and other matrix co-extractives present in the tested samples. An example of this can be observed in the chromatogram of the tea sample. Along with the improvements to the separation, the run time has been reduced from eighteen minutes to just under seven minutes, resulting not only in a shorter analysis time but also a reduction in mobile phase usage. The gradient method conditions and injection volume were correctly scaled using the Waters Column Calculator. The transfer of the method onto the Arc HPLC and CORTECS T3 Column showed excellent resolution, reproducibility, accuracy, and linearity and met the requirements set out in the SMPR for the method. Overall, the advantages of this transferred method onto the Arc HPLC and CORTECS T3 Column include a shorter run time, lower flow rate, less solvent consumption, and an improved separation of the phenolic compounds.
References
- AOAC Official Method 2018.08 Phenolic Compounds in Dietary Supplements and Dietary Ingredients Containing Echinacea HPLC-UV First Action 2018.
- David S, Cunningham R. Echinacea for the prevention and treatment of upper respiratory tract infections: a systematic review and meta-analysis. Complementary Therapies in Medicine. 2019; 44:18–26.
- Barnes PM, Bloom B, Nahin RL. National Center for Health Statistics. [accessed August 25, 2011]; Vital Health Stat. 2008 Series No.12, http://www.cdc.gov/nchs/data/nhsr/nhsr012.pdf.
- Column Calculator Version 2.0 Release Notes (waters.com).
720007726, September 2022