Direct LC-MS Characterization of Glycoform Distribution and Low Molecular Weight Impurities in mAb Process from Ambr® 15 Bioreactors
Abstract
Full characterization of Critical Quality Attributes (CQAs) in biotherapeutic proteins during upstream development is often limited to a handful of high-performing cultures due to high instrument demand and consequently long core lab turn-around times. Although protein A purification or other affinity enrichment approaches are frequently used for liquid chromatography-mass spectrometry (LC-MS) characterization of biotherapeutic proteins, elimination of this step reduces sample preparation complexity, and time from sampling to analysis. In this application note, we demonstrated a streamlined and robust mAb product monitoring method. The mAb fermentation samples were collected directly from an Ambr® 15 running a CHO process. The analytical method was developed on a small bench top LC-MS system, for rapid mAb glycoform confirmations and mAb purity assessments. This developed method is high throughput capable and has the potential to be a fully automated platform for mid-process intraday monitoring of CQAs.
Benefits
Rapid characterization of glycoform distribution and low molecular weight impurities of Ambr® 15 cell cultures using the BioAccord™ LC-MS System without preceding affinity purification
Introduction
Advances in cell culturing techniques have resulted in the development of increasingly complex biotherapeutic molecules, including classes such as bispecific antibodies, fusion proteins, and drug-antibody conjugates. Production of these more complex hybrids is especially nuanced as they tend to mispair and aggregate with higher frequency than do monoclonal antibodies. Selection of appropriate clones and process conditions that reduce these qualities minimizes risk that an unsuitable clone or set of growth conditions will lead to a problematic candidate downstream.
Due to the complexity of new molecules, factors such as aggregation and mis-pairing propensity may be better suited to drive selection of an ideal candidate than traditional titer measurements alone. Bypassing the commonly used protein A purification step provides a simplified workflow for intact mass analysis ideal for use with Ambr® systems in upstream development and clone selection laboratories. This approach is uniquely feasible by paring the robustness and ease of use of the BioAccord LC-MS System and high-throughput automation of the Ambr® multiparallel bioreactor system.
Characterization of dominant glycoforms and low molecular weight impurities is commonly approached using reverse phase liquid chromatography coupled with mass spectrometry for intact mass analysis. High resolution mass spectrometry enables accurate measurement of the masses of the therapeutic and combinations of the relatively abundant glycoforms as well as other post-translational modifications. Identification of these proteoforms is typically possible with good confidence down to a relative abundance of 1–5% with minimal sample preparation. Characterization of LMW impurities has been approached by a number of analytical techniques, including SDS-PAGE, size exclusion chromatography, hydrophilic interaction chromatography (HILIC) coupled with mass spectrometry, and reverse phase liquid chromatography mass spectrometry.1,2 Of these, reverse phase LC-MS offers rapid analysis time, high system robustness, and high information content. This combination of characteristics makes it especially attractive for adoption by upstream laboratories. Here, a simple and direct approach for analyzing glycoform distribution and low molecular weight impurities is demonstrated for a monoclonal-antibody development experiment conducted on a 24 way Ambr® 15 system.
Evaluation of clonal candidates’ productivity and media strategies using the Ambr® 15 and Ambr 250 High Throughput multiparallel bioreactors, is a common approach in upstream process development. Daily assessment of titer and media metabolites is streamlined using the Ambr® automated liquid handler allowing for the generation of numerous samples. Due to logistical constraints present in the traditional sample pipeline, analysis of biotherapeutic CQA’s is typically performed for only a subset of samples after harvest. CQA data is then passed from the analyst to the upstream scientist, in many cases weeks after the culture run is completed. This traditional workflow restricts the total number of samples taken and precludes many CQA’s from use as process monitoring metrics or as process control drivers. Bringing the BioAccord LC-MS into the upstream lab in concert with Ambr® systems increases throughput and reduces the total data turnaround time from weeks to less than 24 hours.
Experimental
Cell Culture Conditions
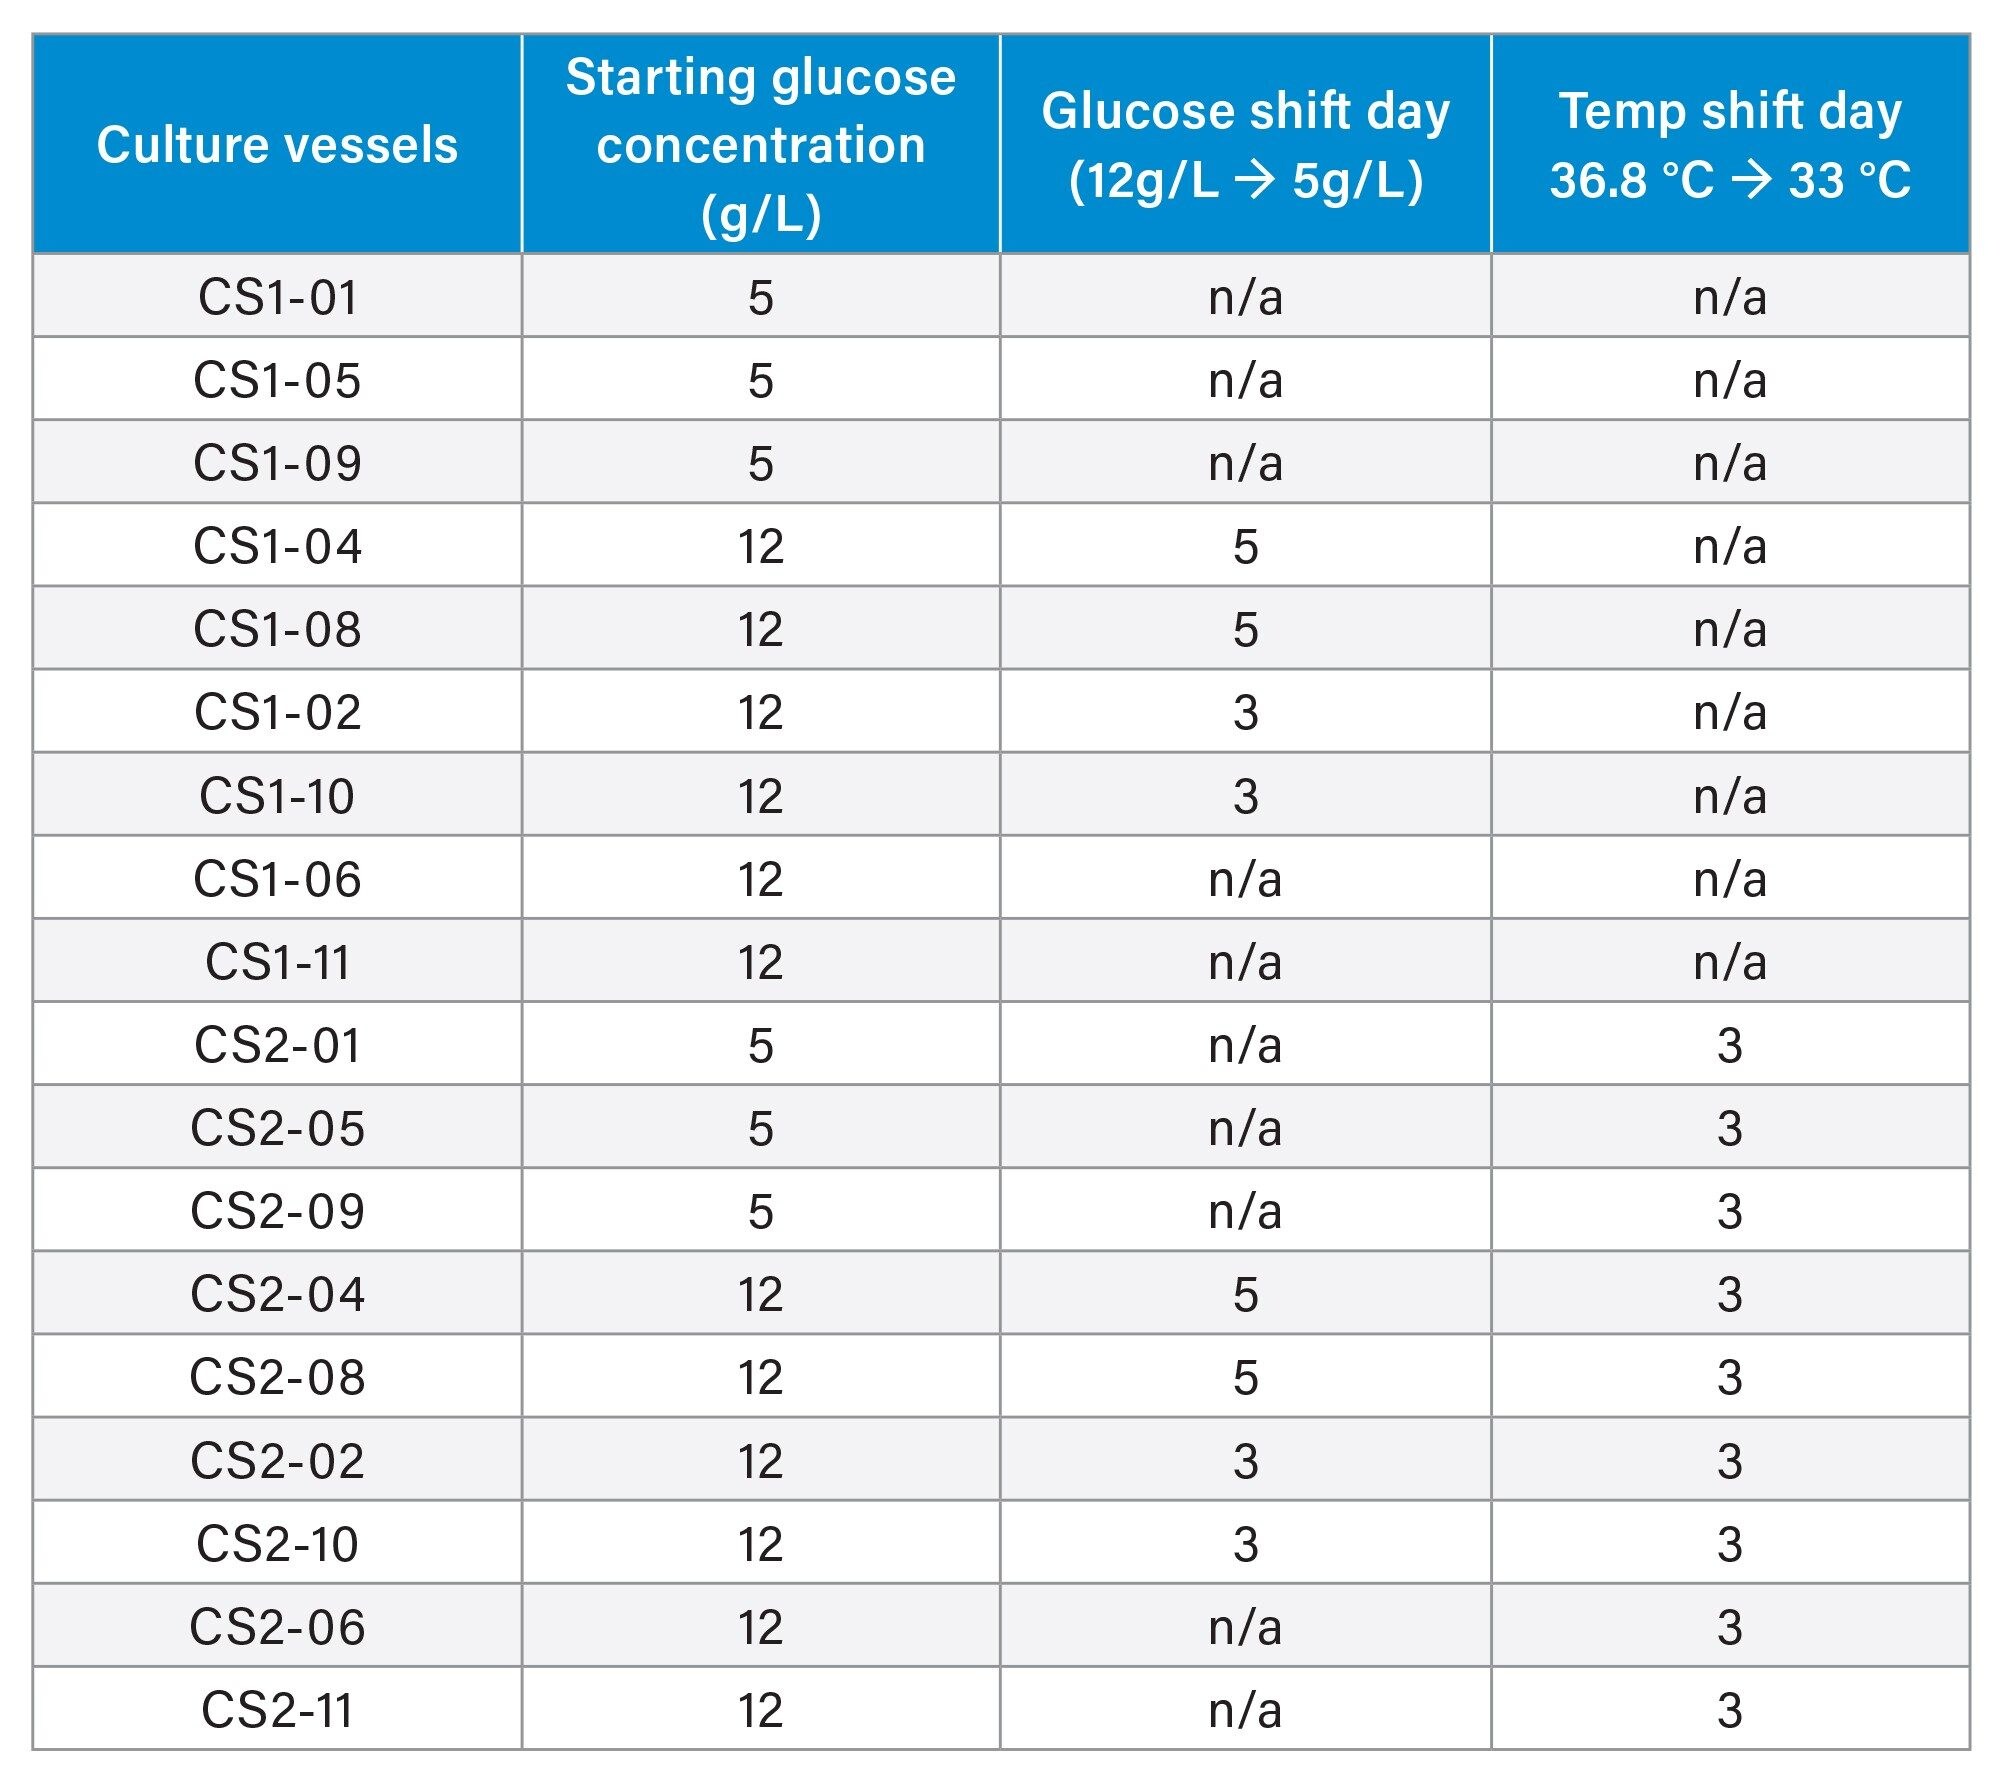
A CHO cell line expressing an IgG monoclonal antibody was cultured in a fed batch process using an Ambr® 15 platform (24 vessel system). All vessels were batched with Sartorius 4Cell® XtraCHO cell culture media and a sterility hold were performed for 24 hours prior to inoculation. The twelve vessels in culture station one (CS1-1, CS1-12) were kept at the control temperature 36.8 °C. The twelve vessels in culture station two (CS2-1, CS2-12) where kept at 36.8 °C until day three where they were temp shifted down to 33 °C for the remainder of the twelve day culture. Vessels CS1-1, CS1-5, CS1-9, CS2-1, CS2-5, and CS2-9 were glucose controls in which the glucose target concentration was 5 g/L throughout the twelve day culture. Vessels CS1-4, CS1-8, CS2-4, and CS2-8 were fed glucose to a 12 g/L target up to day five, at which point the glucose target was reduced to 5 g/L. Vessels CS1-2, CS1-10, CS2-2, and CS2-10 were kept at elevated glucose (12 g/L) until day three, at which point the glucose target was reduced to 5 g/L. The remaining vessels (CS1-6, CS1-11, CS2-6, and CS2-11) were kept at the elevated glucose level throughout the thirteen day batch. Vessels CS1-03, CS1-07, CS1-12, CS2-03, CS2-07, and CS2-12 where supplemented with glycosylation modifying supplements as positive controls and have been excluded from the rest of this text for simplicity. Conditions for each vessel can be seen in Table.1.
Using the Ambr® 15 liquid handler, samples were taken for all vessels daily for cell count, pH, and pO2 measurement (475 µL) and transferred to sample tubes on the deck of the Ambr®. Starting on day two, an additional 275 µL was taken from each vessel on alternating days to allow excess for the BioAccord and retains. On these high-volume sampling days 100 µL of sample was aliquoted for cell count and the remainder of sample was centrifuged at 380 rcf for two minutes. The supernatant was filtered through a Sartorius Minisart® 0.45 µm syringe filter and if necessary diluted with LC-MS grade water before injection into the LC-MS.
Low molecular weight fragments and intact glycan profiles were evaluated for the clarified samples obtained from the Ambr® 15, samples were not purified via protein A. The clarified samples were loaded onto the BioAccord System equipped with a BioResolve™ RP Polyphenyl Column (p/n: 186009016). The larger particle size of the BioResolve bead improves resistance to fouling from residual cellular debris and the high-quality chromatographic resolution provides the ability to run rapid gradients for highly efficient duty cycles. All solvents and reagents used were LC-MS grade. The BioAccord System was controlled using waters_connect informatics software.
LC Conditions
|
LC system: |
ACQUITY™ Premier System |
|
Detection: |
TUV |
|
Vials: |
QuanRecovery™ |
|
Column(s): |
2.1 x 100 mm BioResolve RP Polyphenyl |
|
Column temp.: |
60 °C |
|
Sample temp.: |
8 °C |
|
Injection volume: |
1.5–3 µL |
|
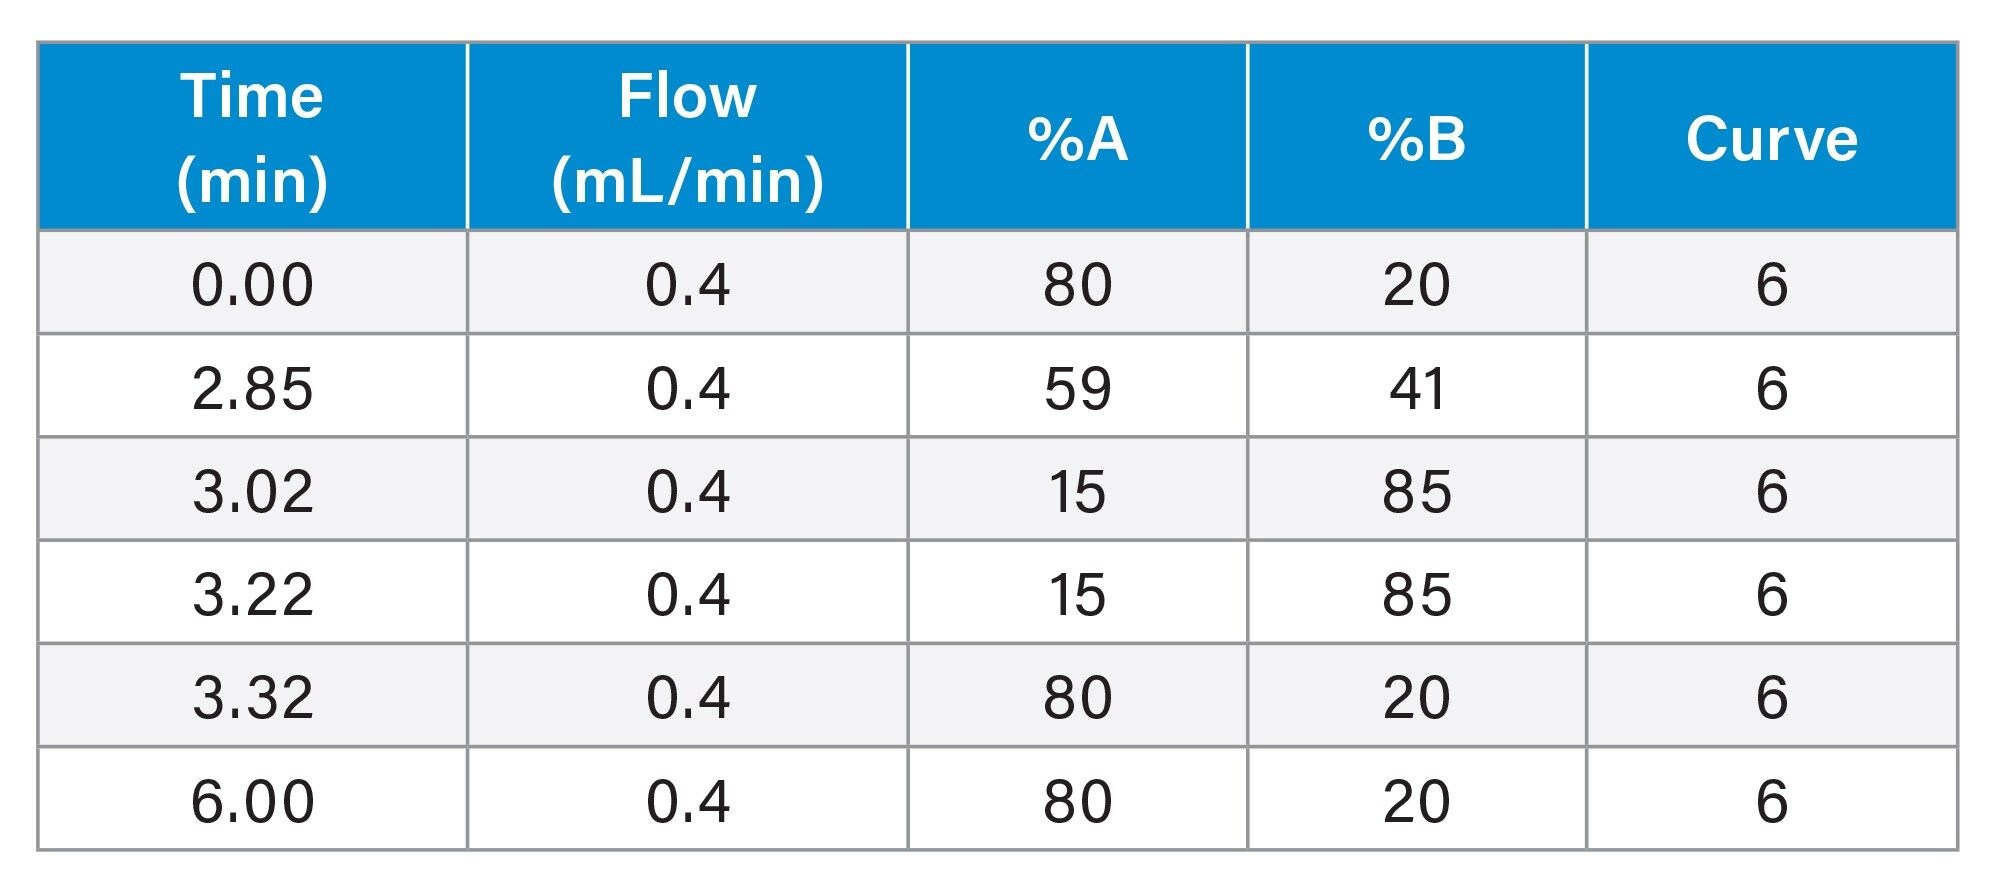
Flow rate: |
0.4 mL/min |
|
Mobile phase A: |
H2O, 0.1% formic Acid |
|
Mobile phase B: |
Acetonitrile, 0.1% formic acid |
Gradient Table
MS Conditions
|
MS system: |
ACQUITY RDa™ |
|
Ionization mode: |
Positive |
|
Acquisition range: |
500–7000 m/z |
|
Capillary voltage: |
1.5 kV |
|
Collision energy: |
NA |
|
Cone voltage: |
95 V |
Results and Discussion
Upstream process data including viable cell density (VCD), viability, and metabolites were found to be as expected for control conditions falling within historical trends for this cell line and media combination. Glucose levels for feedback conditions stayed at their elevated 12 g/L level until the target was reduced to the standard 5 g/L. Return to this 5 g/L level lagged behind the target shift by approximately two days likely due to decreased consumption from reduced growth and the standard glucose included in daily feeds. For CS1, the control condition achieved the highest peak VCD followed by the glucose feedback and high glucose respectively. This conditional trend followed the same pattern in CS2 however, all CS2 vessels experienced reduced growth compared to their CS1 counterparts. This is to be expected due to the reduction in temperature on day three for CS2.
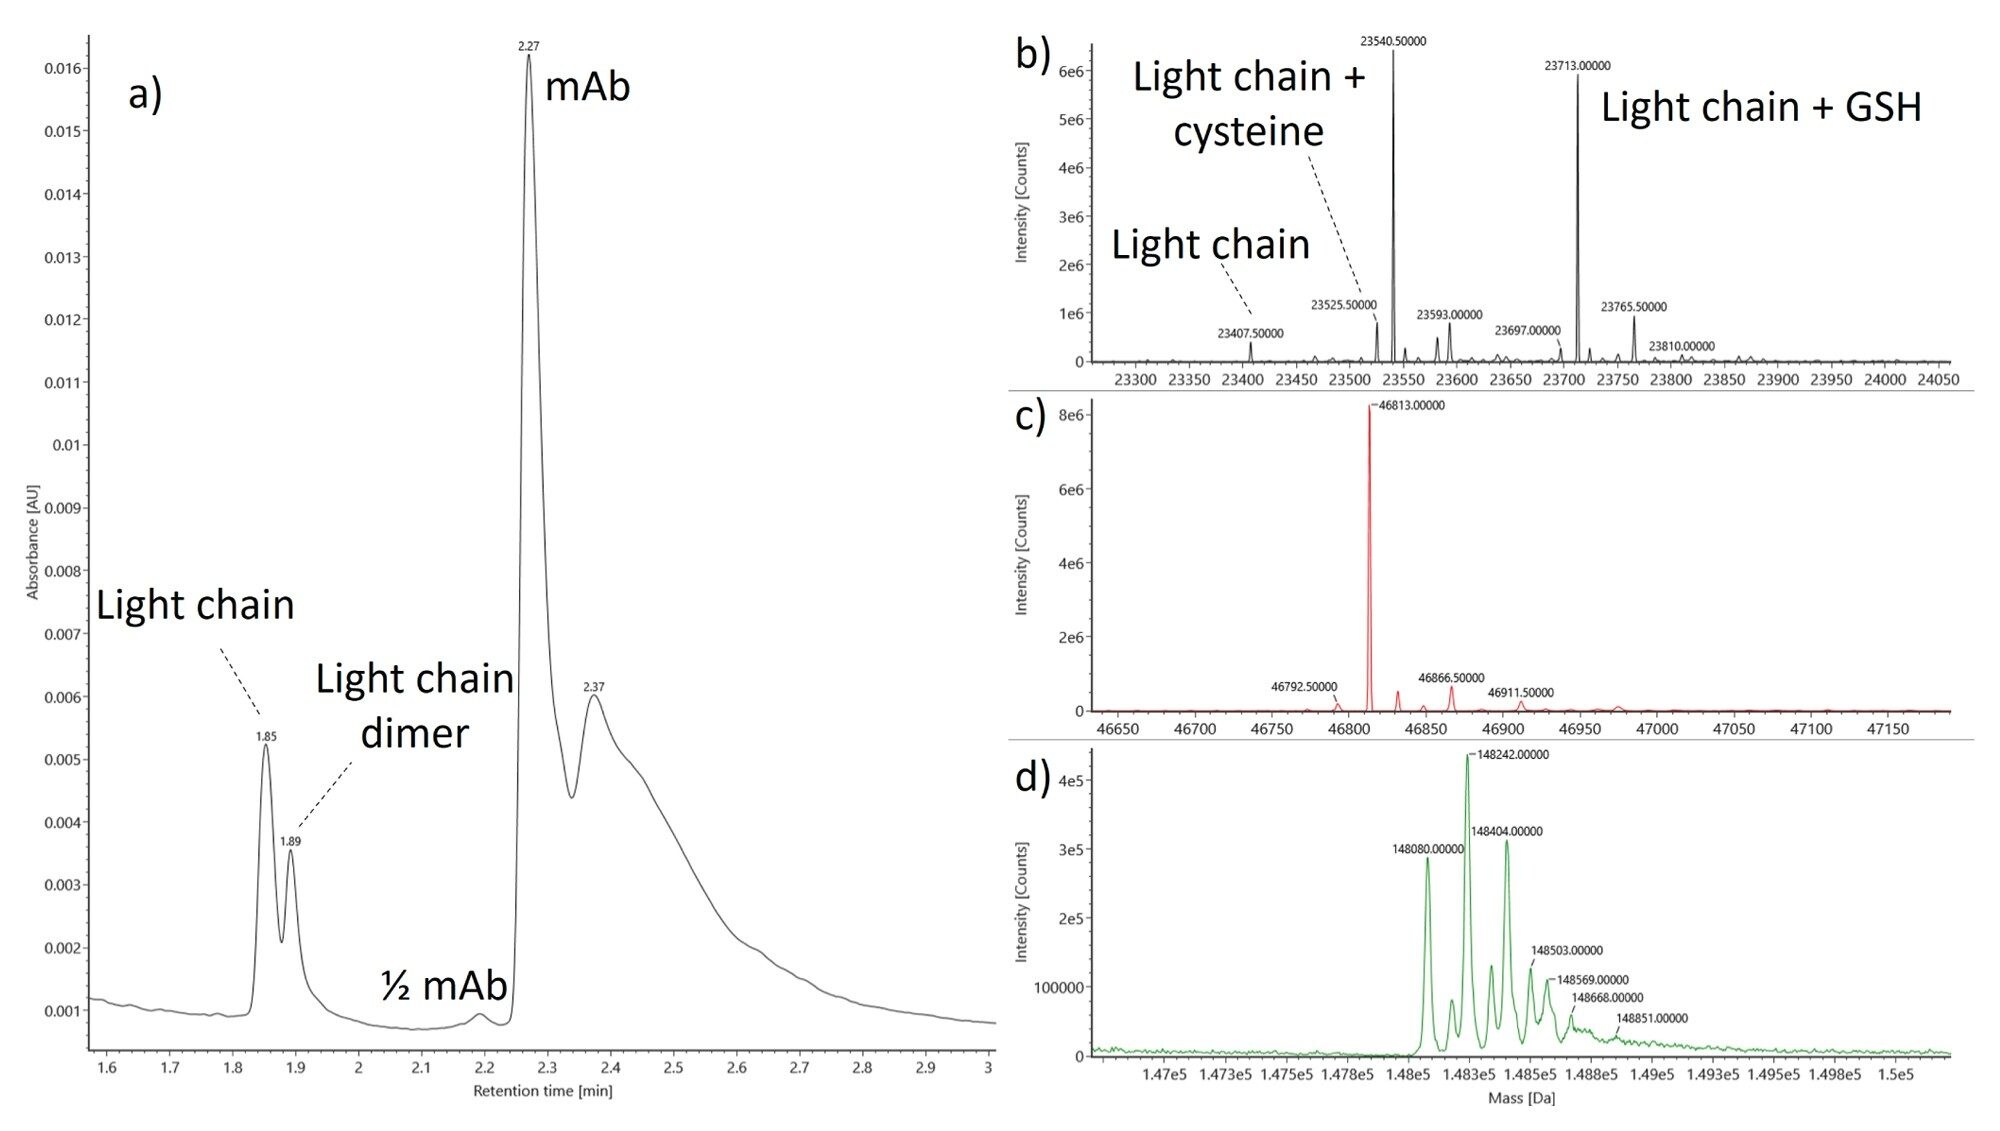
The suitability and performance of the BioAccord System for direct analysis of clarified-Ambr® 15 bioprocess samples were evaluated using a series of 500 injections. Three chromatographic peaks were observed in the clarified supernatant and found to correspond to the target antibody, a free and modified light chain, and a light chain covalent dimer (Figure 1a). The chromatographic peak featuring the light chain was found to be comprised at least ten proteoforms (Figure 1b), with dominant species having masses of 23,526.89 and 23,712.94 Da. These species were found to correspond to the light chain modified with an additional cysteine residue and glutathione. The deconvolved spectrum of the light chain dimer was not found to be modified (Figure 1c), likely due to covalent linkage at the C-terminal cysteine. The deconvolved spectrum of the intact mAb featured a distribution of glycoforms consistent with complex N-linked glycans (Figure 1d).
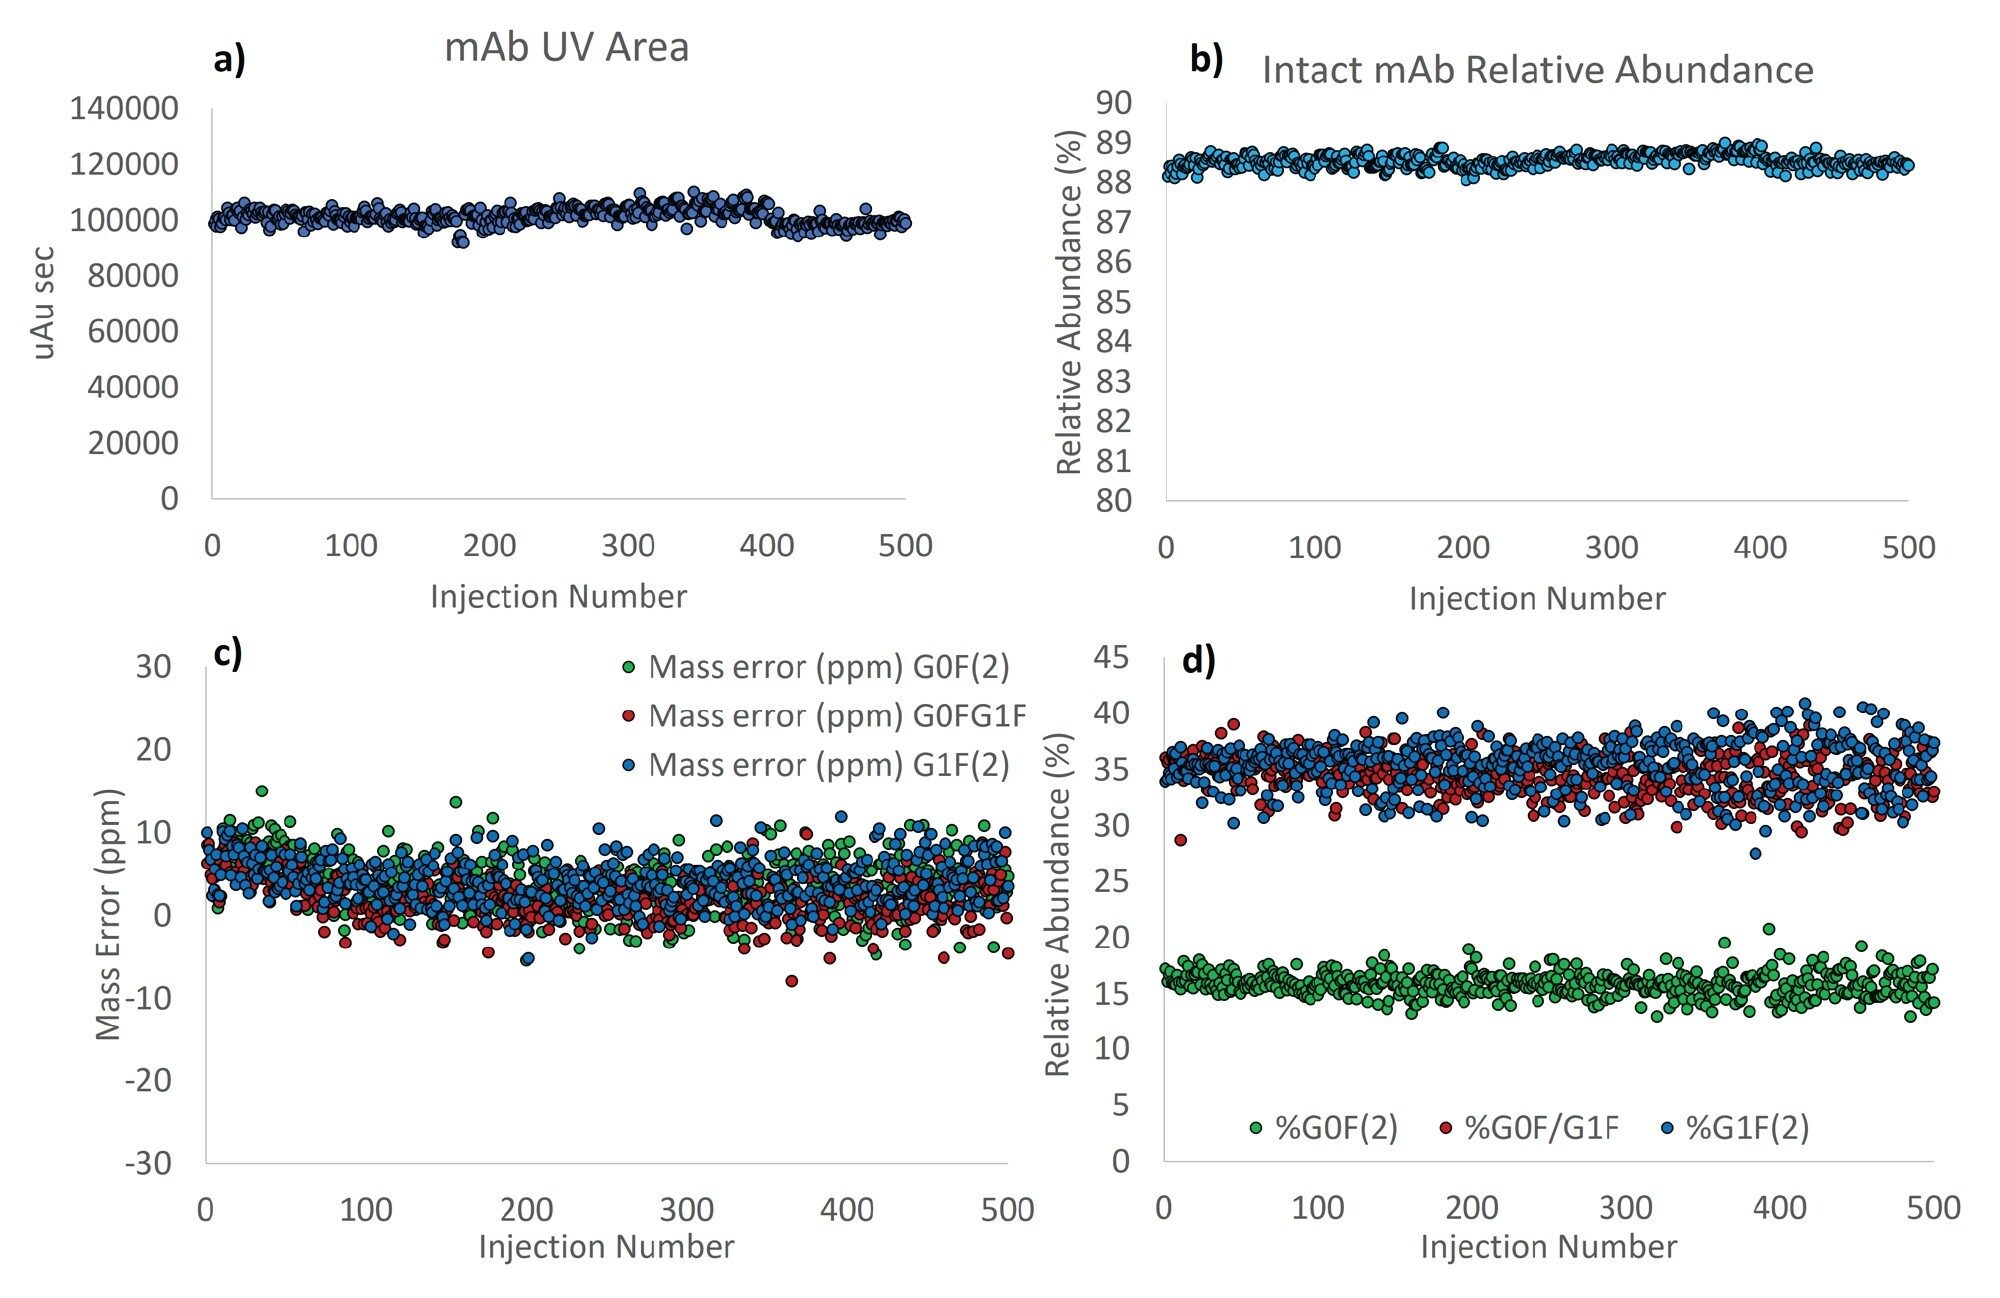
The chromatographic performance of repeated injections was assessed by monitoring the ultraviolet (UV) area of the intact antibody peak as well as the relative abundance of the antibody based on the UV measurement (Figures 2a and 2b). Fouling of the column and non-specific adsorption would be expected to result in a deterioration of these measurements over time. Glycoform mass accuracy and the relative abundance of the G0F/G0F glycoform were used to evaluate the robustness of the mass spectrometer. Material build-up and ion burn on the front end of mass spectrometers results in characteristically poor spectral performance for antibodies, resulting from reduced desolvation and ion focusing. This is most often evidenced by a loss of resolution of the intact glycoforms and a concomitant reduction in mass accuracy. This combination impacts the accuracy with which MaxEnt1 deconvolves peak intensity and can impact the output of the subsequent centering step. Consequently, the relative abundance of the glycoforms was also tracked over the 500 sample injections (Figure 2c and 2d).
In general, excellent reproducibility for all four metrics was observed across the robustness evaluation, with no evidence of signal decay or distortion apparent. The raw UV area (Figure 2a) and %intact measurements featured RSDs of 2.9 and 0.19%. Remarkably, all %intact measurements, generated by relative comparison of the UV peak areas of the target mAb and its fragments, were between 88 and 89% (Figure 2b). The measured retention time was also incredibly stable and found to be 2.3 minutes for all injections. Mass accuracies of the four dominant glycoforms (Figure 1c) were also excellent and ranged between -15 and 15 ppm. Glycoform relative abundances featured RSDs of 6.7, 5.1, and 6.5% for the G0F/G0F, G1F/G0F, and G1F/G1F glycoforms, respectively.
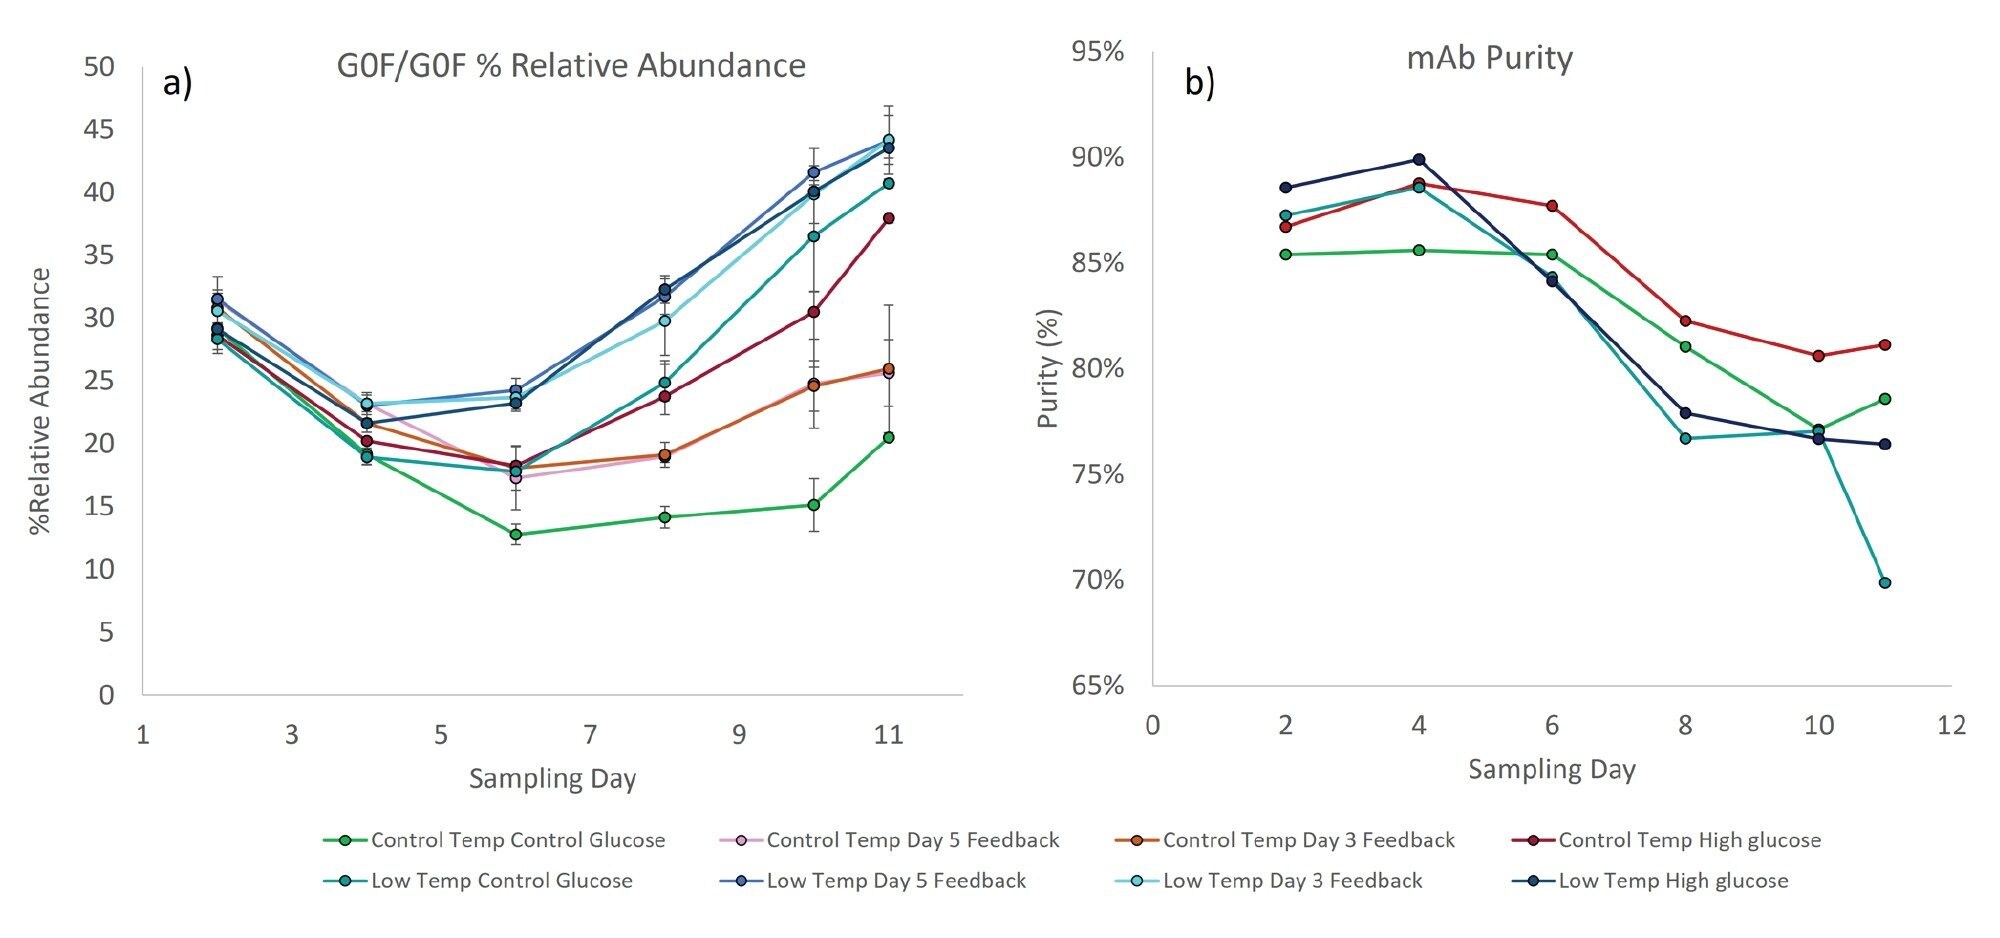
A process optimization experiment was performed using Ambr® 15 in which a range of temperature and glucose conditions were applied (Table 1). The distribution of intact glycoforms and relative abundance of the cysteinylated and glutathionylated light chain were measured on day two, four, six, eight, ten, and eleven. The relative abundance of the G0F/G0F glycoform was plotted as a function of culture time for each of the experimental growth conditions (Figure 3a). Under all conditions, the relative abundance of this glycoform changed over the course of the fed batch experiment, with the relative abundance continually declining and reaching a minimum on day six. Elevated glucose and reduced temperature resulted in an increased relative abundance compared to control, likely due to either increased production of less galactosylated species or from galactose scavenging. This phenomenon was readily distinguishable on day six. Interestingly, low temperature with elevated glucose resulted in a significant increase in this effect resulting in a 25% difference in the glycan profile on day eleven. The impact of glucose feed and temperature on glycan distribution suggests that measurable changes in glycoform abundance can be achieved by modulating glucose, temperature, and timing. Use of this type of data earlier in culture experiments may permit strategic alterations of process and feeding parameters that achieve desirable glycan distributions.
Low molecular weight (LMW) impurities can be immunogenic to patients and can detract from overall product yield. Generally, mAb purity was found to decrease throughout the culture corresponding to an increase in LMW species such as unincorporated light chain (Figure 3b). The reduced temperature conditions were observed to feature lower purities than the control temperatures. Interestingly, the high glucose conditions yielded slightly higher purities, and this shift was evident as early as day two and day four. These results suggest strategic modulation of glucose feed may be effective in raising relative purities for the studied process.
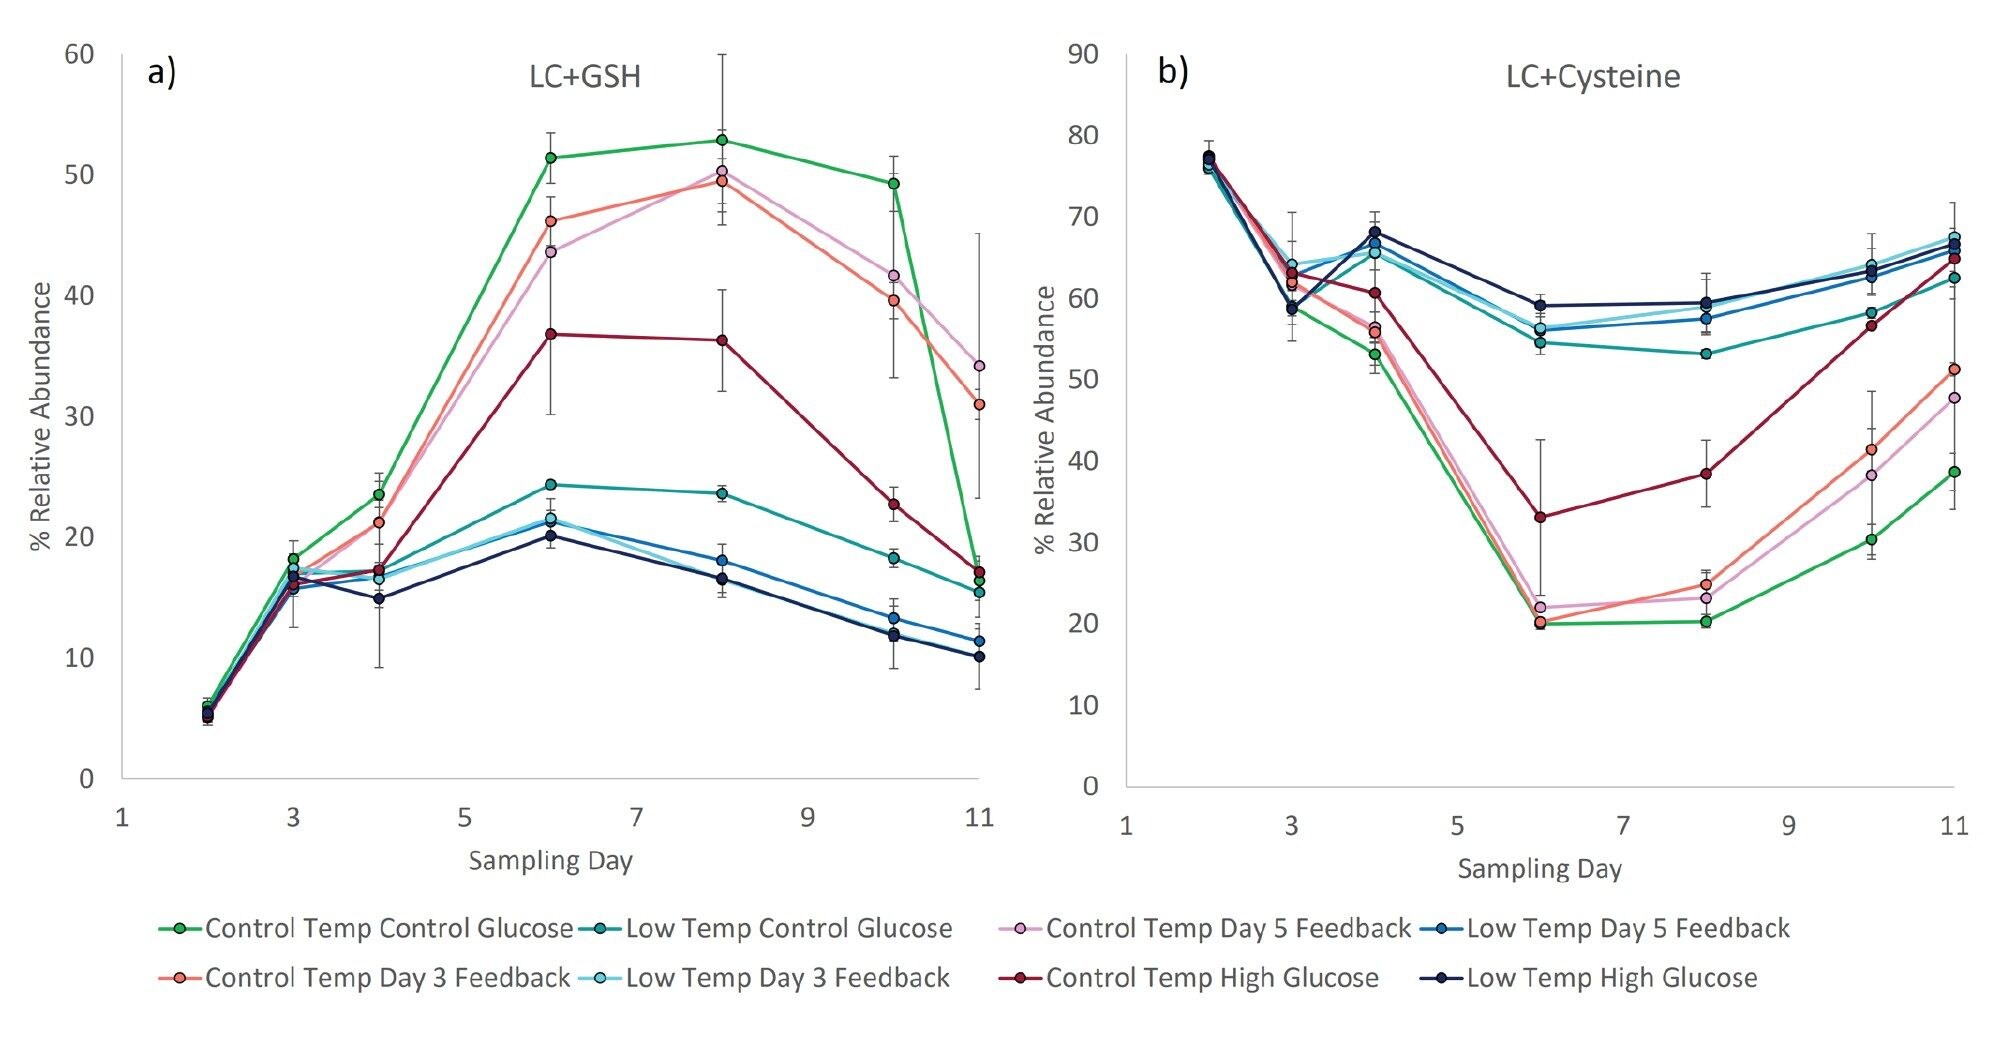
The relative abundance of the cysteinylated and glutathionylated forms of the free light chain were monitored using the MS signal from the RDa time-of-flight (TOF) mass analyzer. Cysteinylation occurs when a free cysteine forms a disulfide bond with an unpaired cysteine on a protein, typically at the C-terminus of the light chain of monoclonal antibodies. This post-translational modification likely correlates with the amount of available cysteine in the culture. Glutathionylation of proteins occurs under conditions of oxidative or nitrosative stress as a mechanism to mediate cellular damage. Consequently, the relative abundance of the glutathionylated light chain can be used as a proxy for evaluating the oxidative stress of the cell culture. As was observed for the glycan distribution, the relative abundance of the modified light chain was found to change over time, reaching a minima for the cysteinylated form on day six (Figure 4b), and corresponding to a maxima of the glutathionylated form (Figure 4a). Interestingly, the four culture stations grown at reduced temperature feature the highest abundance of cysteinylated light chain, and never exhibit the strong shift to more highly glutathionylated light chain observed in the control temperature cultures. This disparity is evident as early as day four. Thus, reduced abundance of the glutathionylated light chain appears to correlate with decreased temperature and decreased cell growth. Further investigation is required to determine what relationships are causal, but the ability to scrutinize these relationships proves a powerful tool.
Conclusion
Direct analysis of low molecular weight impurities and mAb glycoform distribution are demonstrated using a BioAccord LC-MS System from clarified but unpurified cell culture samples grown using an Ambr® 15 system. Excellent robustness and reproducibility from over 500 injections on a BioResolve Column permits sampling and analysis of product quality attributes every other day from 48 parallel bioreactors. Examination of glycoform relative abundance over the course of a culture suggests significant scavenging or lost incorporation of galactose for low temperature and high glucose conditions. Interestingly, high glucose conditions yielded higher purities than did the control conditions. Together, these datasets suggest that monitoring of product quality attributes throughout the culture may reveal optimum process parameters and feed strategies that yield higher product purities and tailored glycoform distributions.
References
- Wang S, Liu AP, Yan Y, Daly TJ, Li N. Characterization of Product-Related Low Molecular Weight Impurities in Therapeutic Monoclonal Antibodies Using Hydrophilic Interaction Chromatography Coupled With Mass Spectrometry. J Pharm Biomed Anal. 2018, May 30;154:468–475. doi: 10.1016/j.jpba.2018.03.034.
- Li W, Yang B, Zhou D, Xu J, Li W, Suen WC. Identification and Characterization of Monoclonal Antibody Fragments Cleaved at the Complementarity Determining Region Using Orthogonal Analytical Methods. J Chromatogr B Analyt Technol Biomed Life Sci. 2017, Mar 24;1048:121-129. doi: 10.1016/j.jchromb.2017.02.019. Epub 2017 Feb 21. PMID: 28242491.
720007580, April 2022