Method for the Analysis and Quantitation of Pharmaceutical Counterions Utilizing Hydrophilic Interaction Liquid Chromatography
Abstract
Hydrophilic Interaction Liquid Chromatography (HILIC) combined with Evaporative Light Scattering Detector (ELSD) enables for the separation, detection, and quantitation of both anionic and cationic pharmaceutical counterions. This method further demonstrates a single method could be used to separate the active pharmaceutical ingredient (API) free base from the salt counterions.
Benefits
Introduction
It has been reported that roughly 50% of drugs are attached to some form of salt.1 Many APIs lack the solubility needed for therapeutic bioavailability.2,3 Therefore, the insoluble APIs are combined with soluble salts to increase the bioavailability and decrease the amount of API needed for therapeutic effect. The identification and quantification of free base and salt counterions is critical for quality control in the pharmaceutical industry.4 Due to chemical differences between APIs and their salts, multiple methods such as reversed phase and ion-exchange, are used to identify and quantify a final drug product. This challenge could be remedied using HILIC, a technique that works inversely to traditional reversed phase chromatography. In HILIC, the aqueous mobile phase is the strong solvent, and the organic mobile phase is the weak solvent. The mixed aqueous-organic mobile phase forms a water layer around the polar stationary phase. This allows for analytes to partition between the aqueous and organic layers based on the polarity of the analyte.
HILIC stationary phases can also be modified with different functional groups which increase the selectivity of the technology. The zwitterionic HILIC stationary phase used here contains a sulfobetatine functional group that features a negatively charged sulfonate group and a positively charged quaternary ammonium group.5 This will allow the retention and separation of cations and anions in the same method. Another challenge when analyzing a drug product is some components may lack chromophores. Using a universal detector can mitigate this hurdle. And therefore, in this work, the use of ELSD was utilized. ELSD is a technique that works by nebulizing mobile phase with analytes leaving the column. The volitive mobile phase evaporates leaving the dry solute particles behind. These dry particles flow into the ELS detector and scatter a beam of light. The amount of scattered light is measured and correlated to the concentration of eluting material.6 The combination HILIC and ELSD provides a strategic approach to separating and quantifying pharmaceutical counterions from the free base APIs.
Experimental
Method of Separation Sample Description
The salts used in this study were potassium chloride, sodium sulfate, calcium nitrate, potassium phosphate, and magnesium chloride were purchased from Sigma-Aldrich (Allentown, PA). These various salts were prepared as separate stock solutions at a 1 mg/mL concentration in 50% acetonitrile. Then, the stock salt solutions were combined and diluted to a 0.1 mg/mL concentration using 60% acetonitrile to make a dissolved counterions standard. Solutions were stored at 2 °C–8 °C and equilibrated to ambient room temperature prior to analysis.
Linearity Sample Description
The salts used in the linearity portion of this study were sodium sulfate, magnesium chloride, and potassium phosphate were purchased from Sigma-Aldrich (Allentown, PA). These various salts were prepared as separate stock solutions at a 100 mM concentrations in 60% acetonitrile. Then, the stock salt solutions were individually diluted into various calibration standards, ranging from 1 to 100 mM in 60% acetonitrile from which three different linear curves were prepared. Solutions were stored at 2 °C–8 °C and equilibrated to ambient room temperature before dilution or injection.
LC Conditions
|
LC system: |
ACQUITY™ Arc™ Premier LC System |
|
Detection: |
Waters™ 2424 Evaporative Light Scattering Detector |
|
Column(s): |
Atlantis™ Premier BEH™ Z-HILIC, 4.6 x 100 mm, 2.5 μm |
|
Column temperature: |
40 °C |
|
Sample temperature: |
Ambient |
|
Injection volume: |
10 μL |
|
Flow rate: |
1.4 mL/min |
|
Mobile phase A: |
Acetonitrile |
|
Mobile phase B: |
Deionized Water (DI Water) |
|
Mobile phase C: |
200 mM Ammonium Formate |
|
Mobile phase D: |
2% Formic Acid |
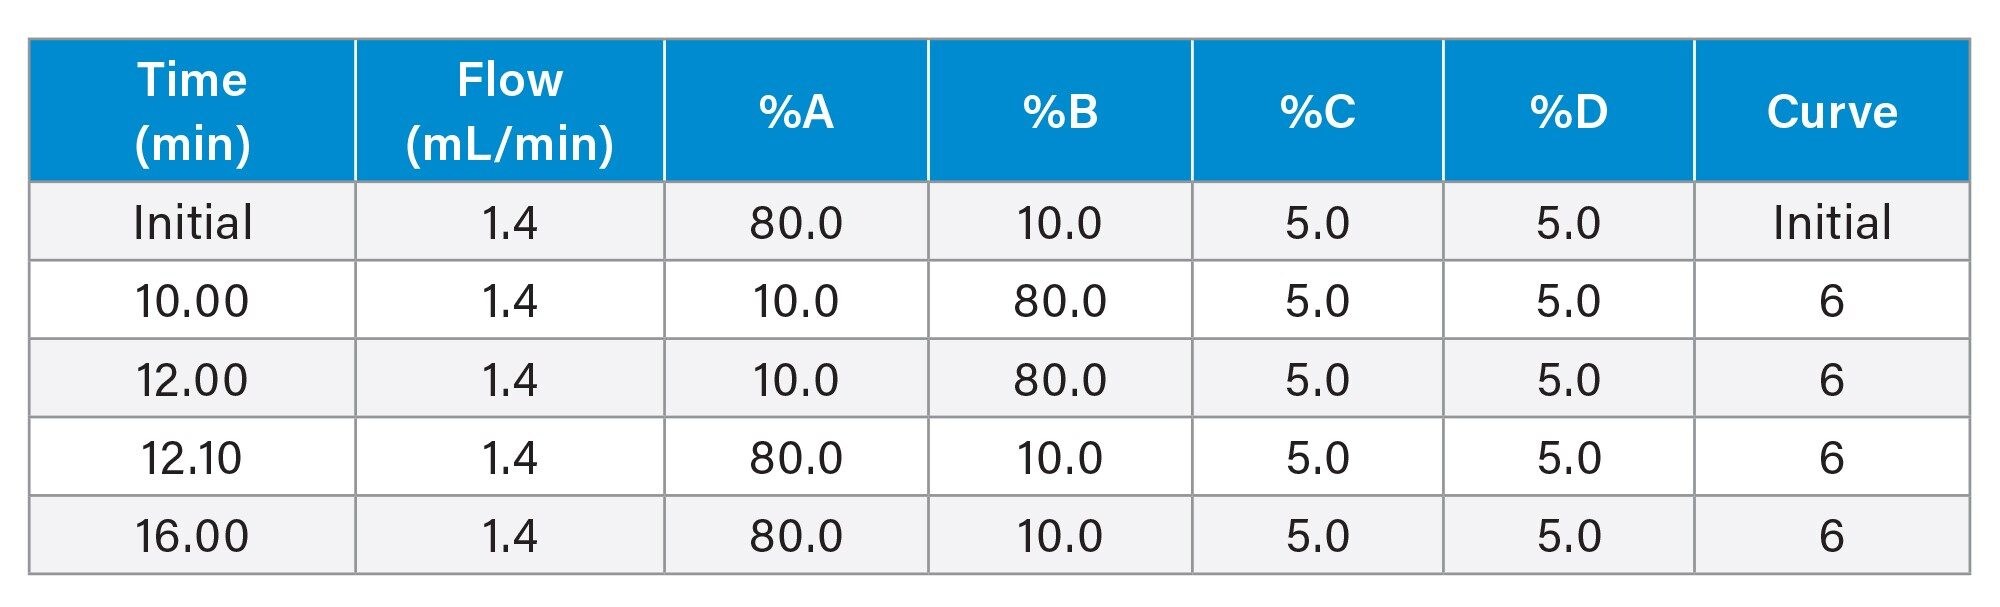
Gradient Table
Data Management
|
Chromatography Software: |
Waters Empower™ 3 Software Build 3471 |
Results and Discussion
Method of Separation Results
The methodology developed with the Atlantis Premier BEH Z-HILIC Column can separate a variety of different counterions with good retention, resolution, and reproducibility. The ELS detector was chosen due to the lack of chromophores present within the counterion structure.
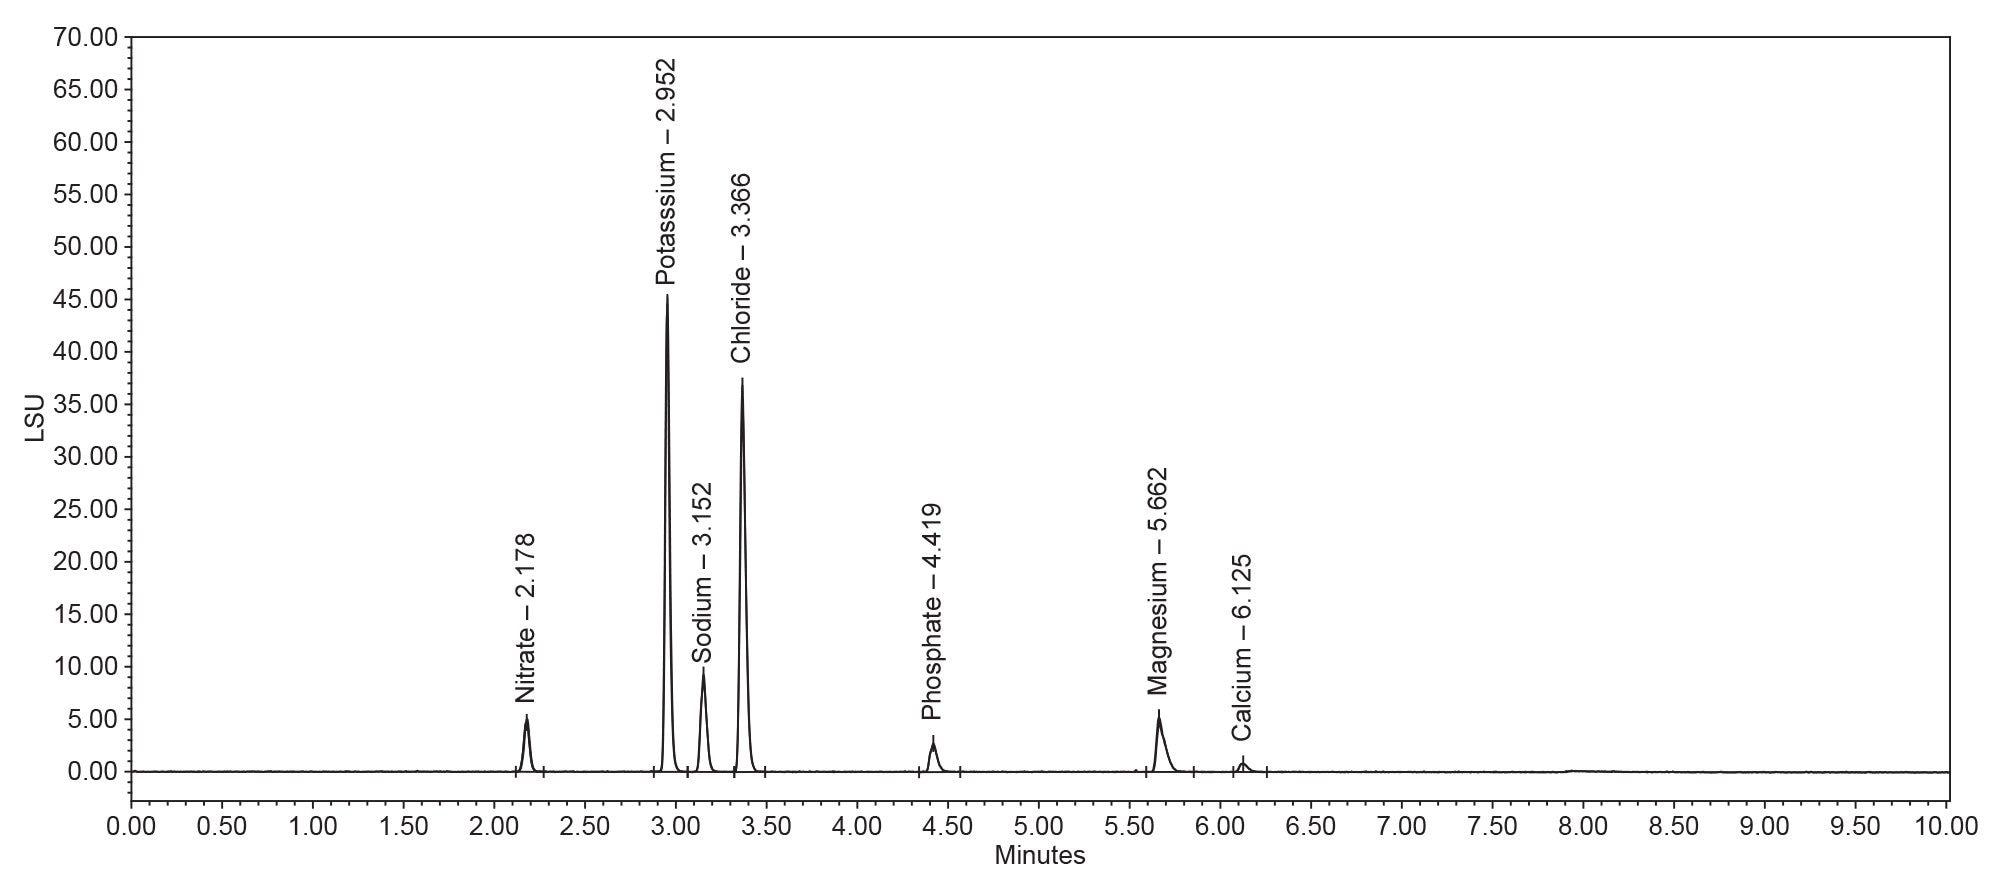
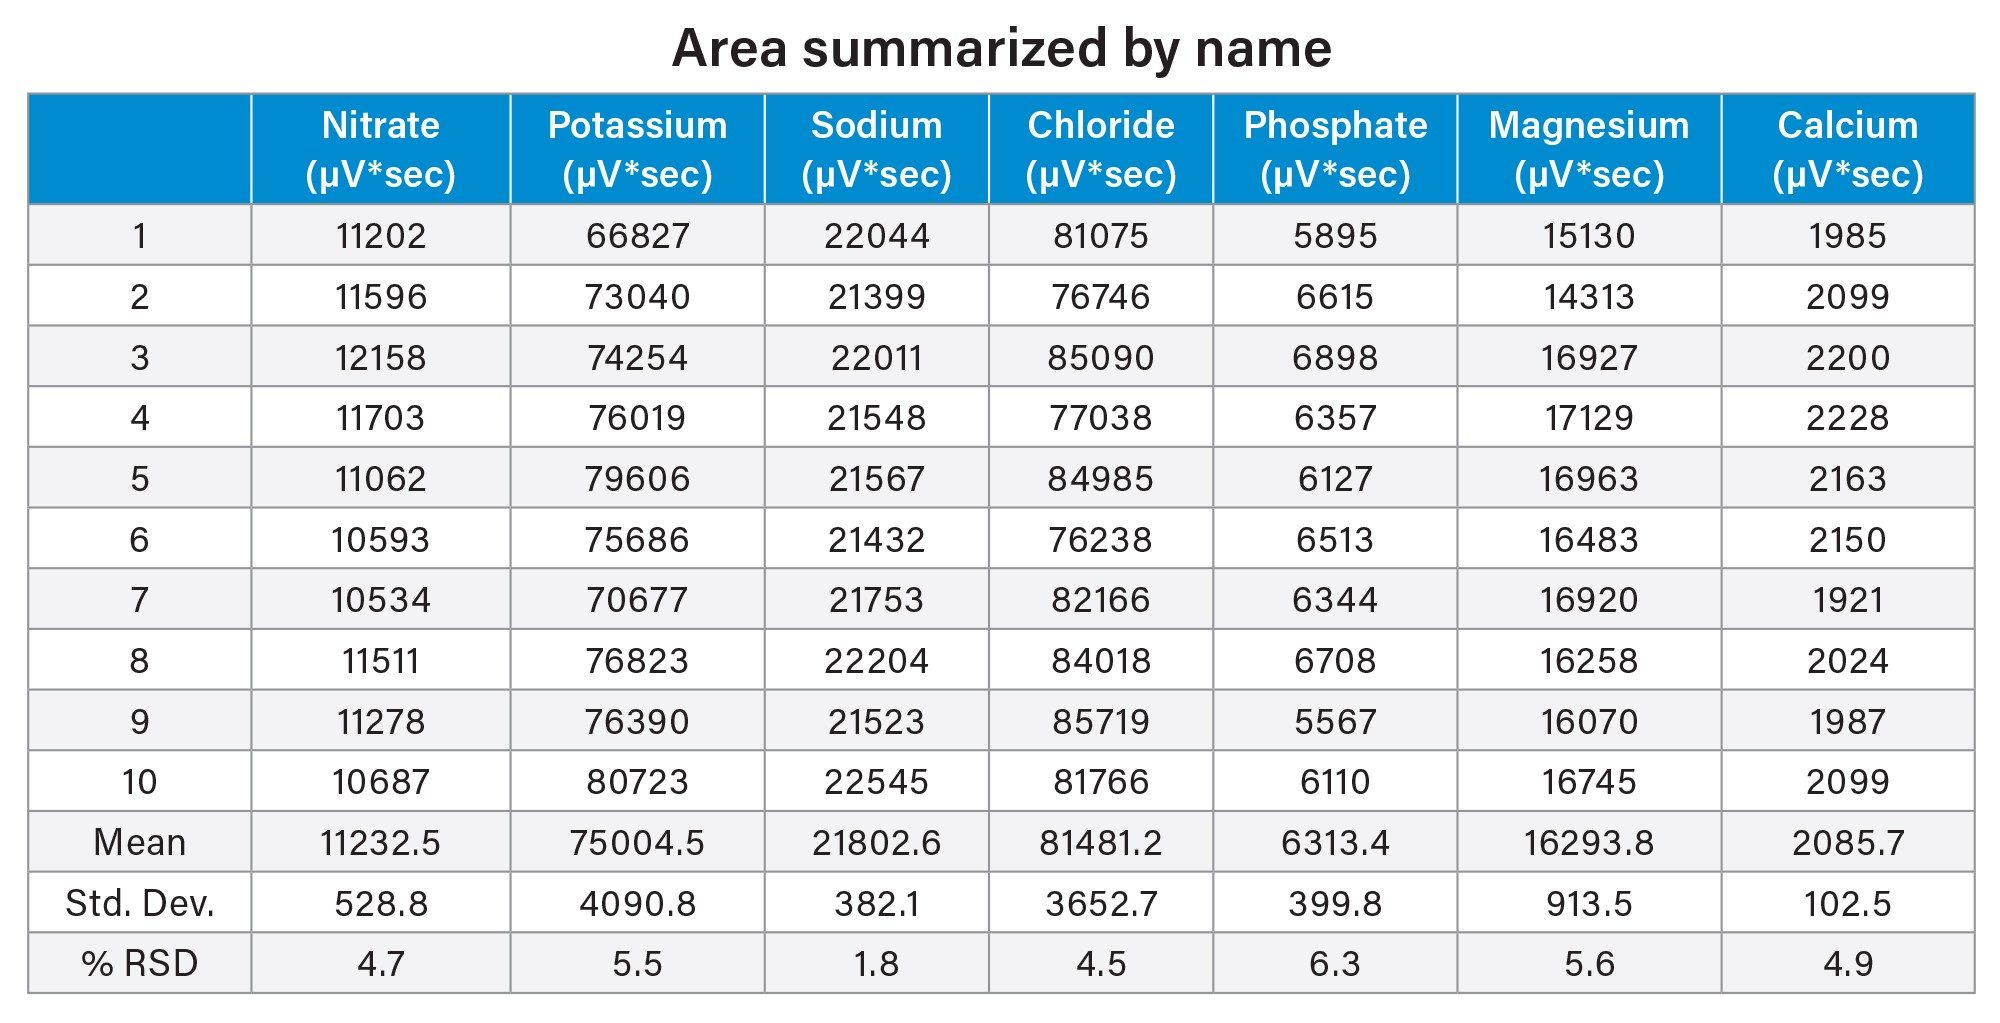
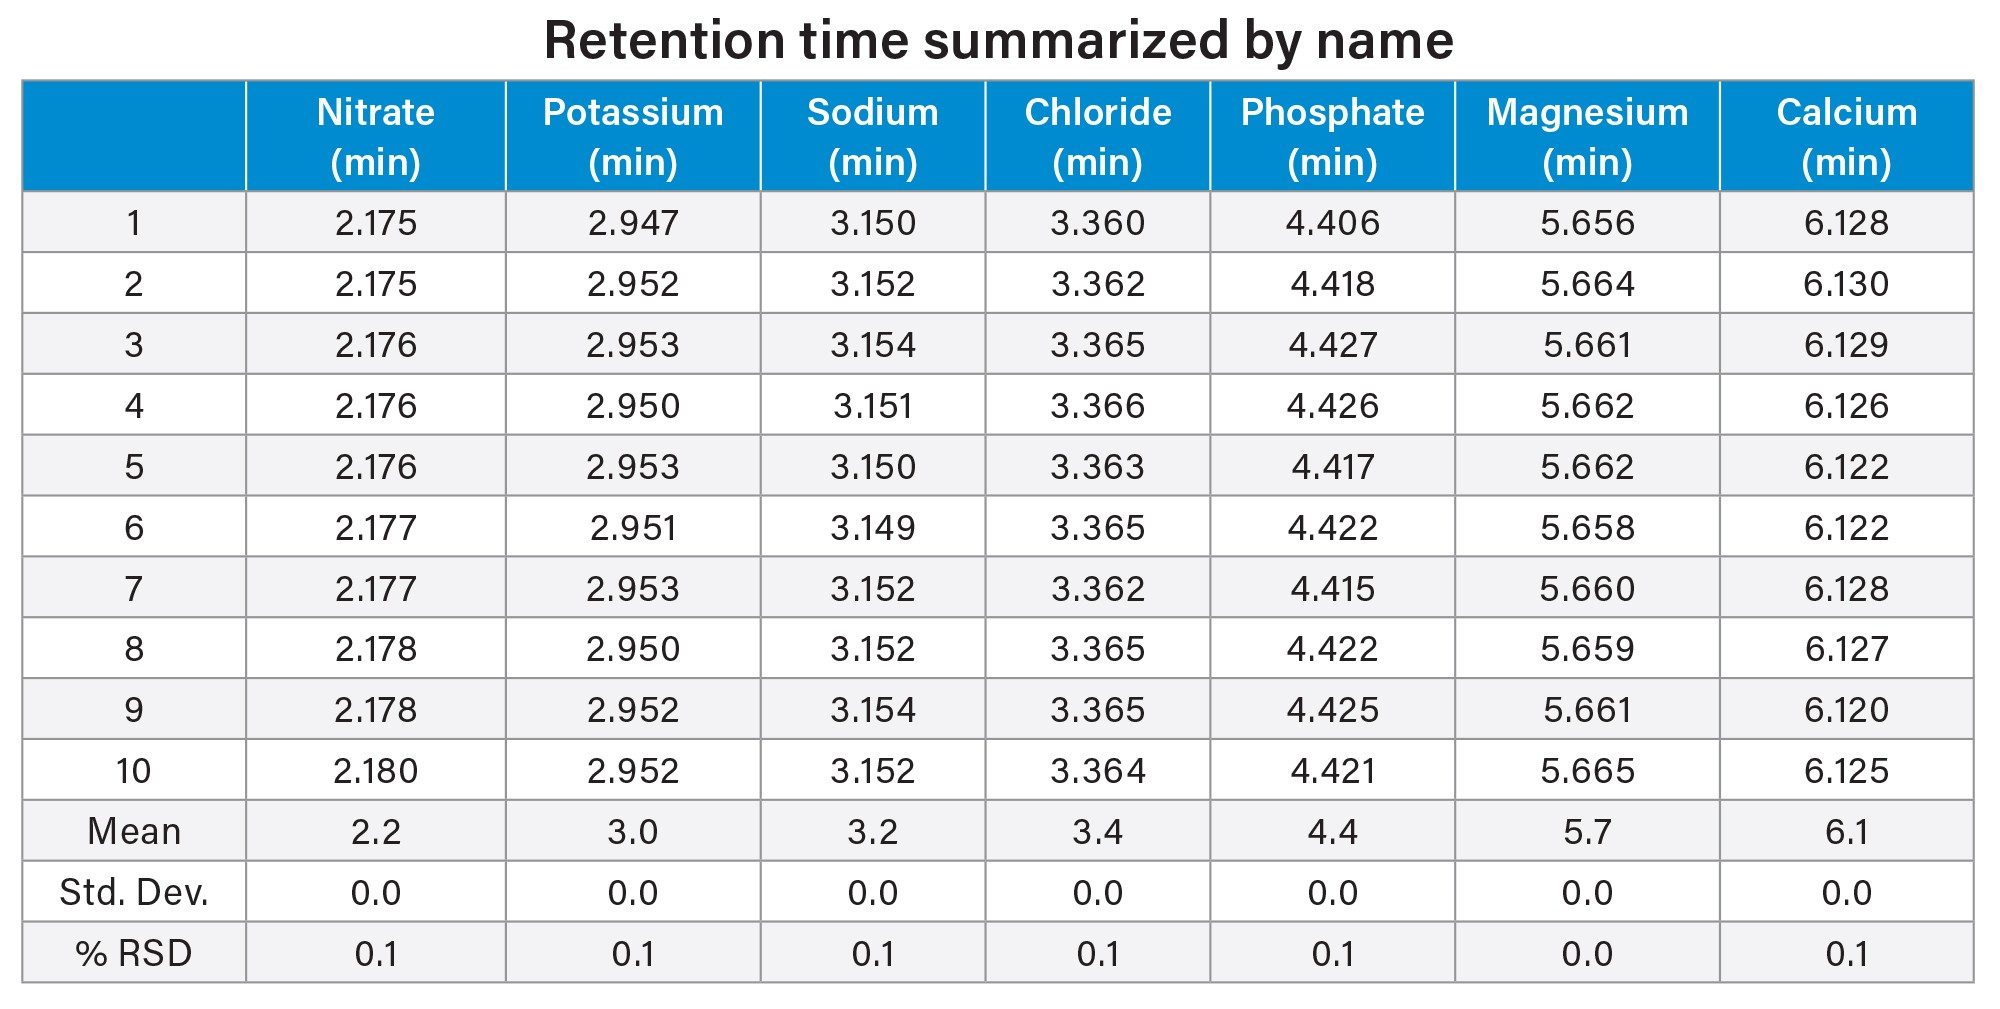
The analysis of the counterions standard showed reproducibility. Over the course of ten injections 5% RSD for both area and retention time was observed (Figure 1a, Table 1, and Table 2). Potassium, phosphate, and magnesium ions fell within a 5% RSD for retention time and 6% RSD for area (Table 1). These %RSDs are expected when using nebulizer based methods of detection, such as ELSD.
Further, this method was shown to be capable of separating the counterions, but it also can separate the API freebase from their salts and quantify the salts. Naproxen sodium, metformin hydrochloride, and losartan potassium were prepared at various concentrations in 60% acetonitrile. The peaks were aligned against the counterions standard to identify the separated ion from the free base of the drug salt (Figures 2a through 2d).
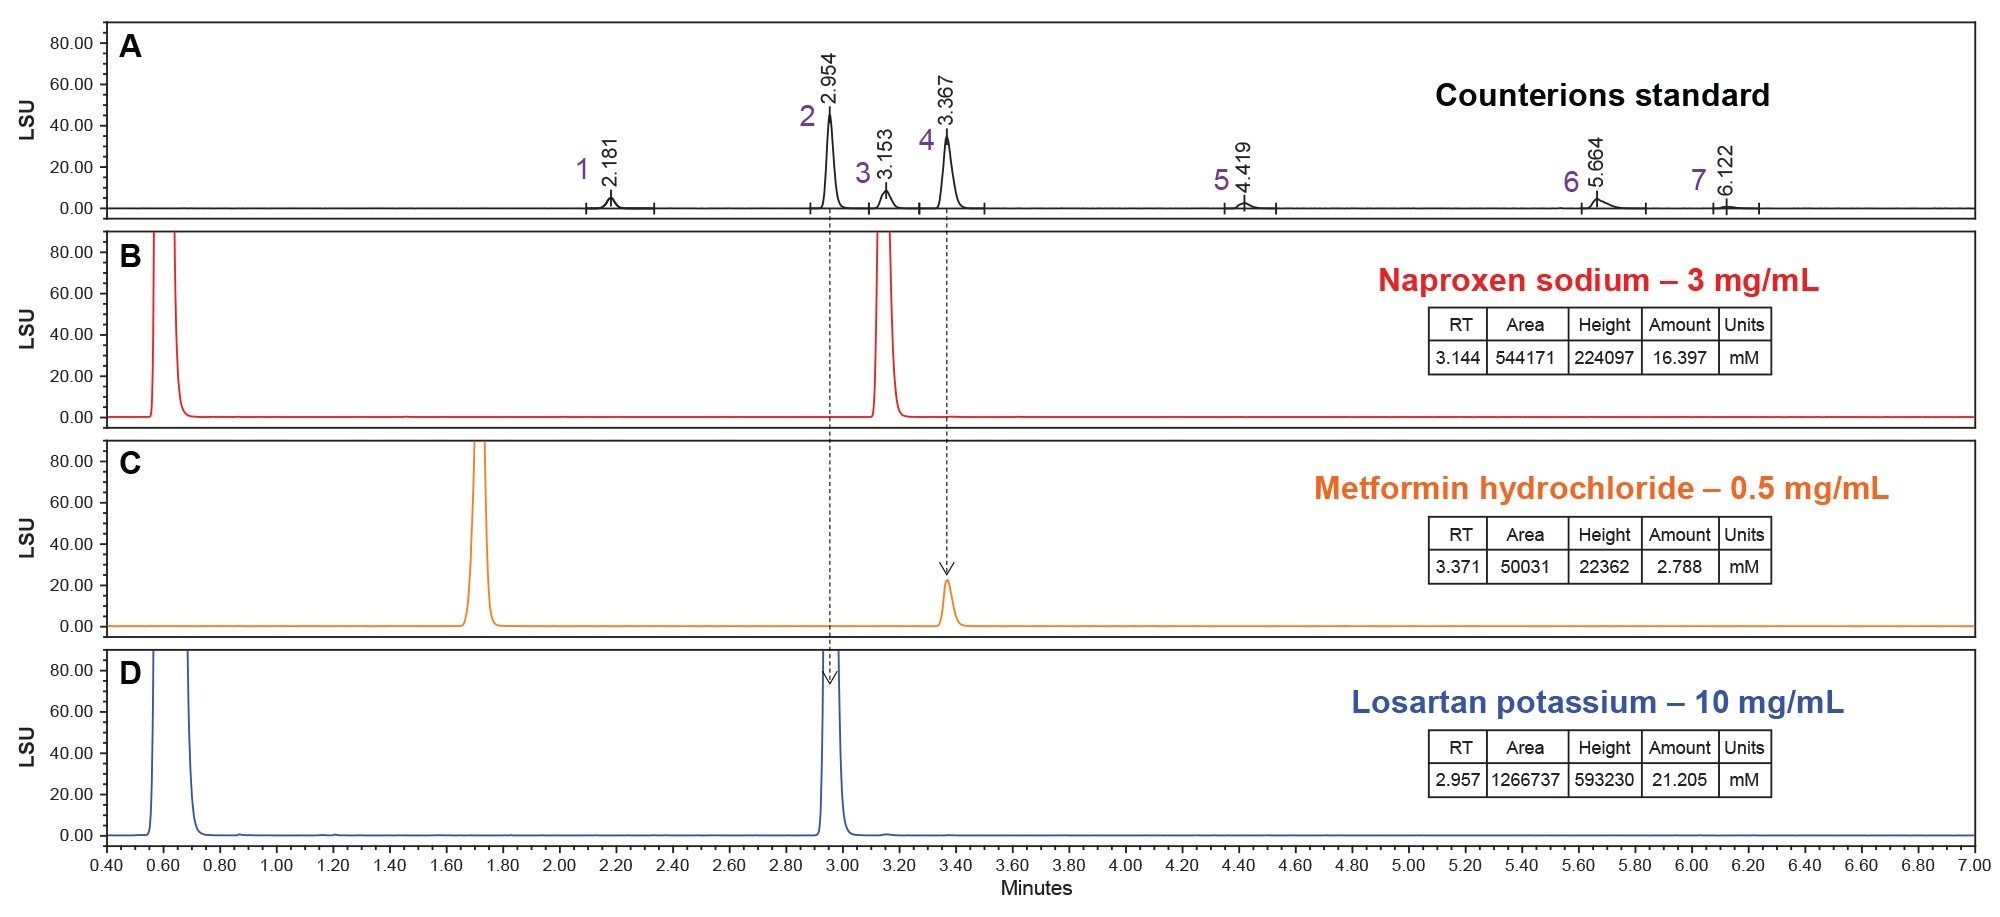
Figure 2a. An ELSD Chromatogram of the counterions standard (black). The specific peaks in the chromatogram are Nitrate (1), Potassium (2), Sodium (3), Chloride (4), Phosphate (5), Magnesium (6), and Calcium (7). This is used as a known counterions reference to be compared to the drug samples in Figure 2b, 2c, and 2d. The known counterions are designated by an arrow that extends from Figure 2a to the respective ion in the drug samples (Figure 2b, 2c, and 2d).
Figure 2b. An ELSD chromatogram of the drug Naproxen Sodium prepared at 3 mg/mL (red). The Naproxen free base is visible at approximately 0.6 minutes and the sodium ion is visible at approximately 3.1 minutes. This sodium peak lines up with the known sodium peak in Figure 2a. The sodium ion was quantified at 16.397 mM.
Figure 2c. An ELSD chromatogram of the drug Metformin Hydrochloride prepared at 0.5 mg/mL (orange). The Metformin free base is visible at approximately 1.7 minutes and the chloride ion is visible at approximately 3.4 minutes. This chloride peak lines up with the known chloride peak in Figure 2a. The chloride ion was quantified at 2.788 mM.
Figure 2d. An ELSD chromatogram of the drug Losartan Potassium prepared at 10 mg/mL (blue). The Losartan free base is visible at approximately 0.7 minutes and the potassium ion is visible at approximately 3.0 minutes. This potassium peak lines up with the known potassium peak in Figure 2a. The potassium ion was quantified at 21.205 mM.
Linearity Results
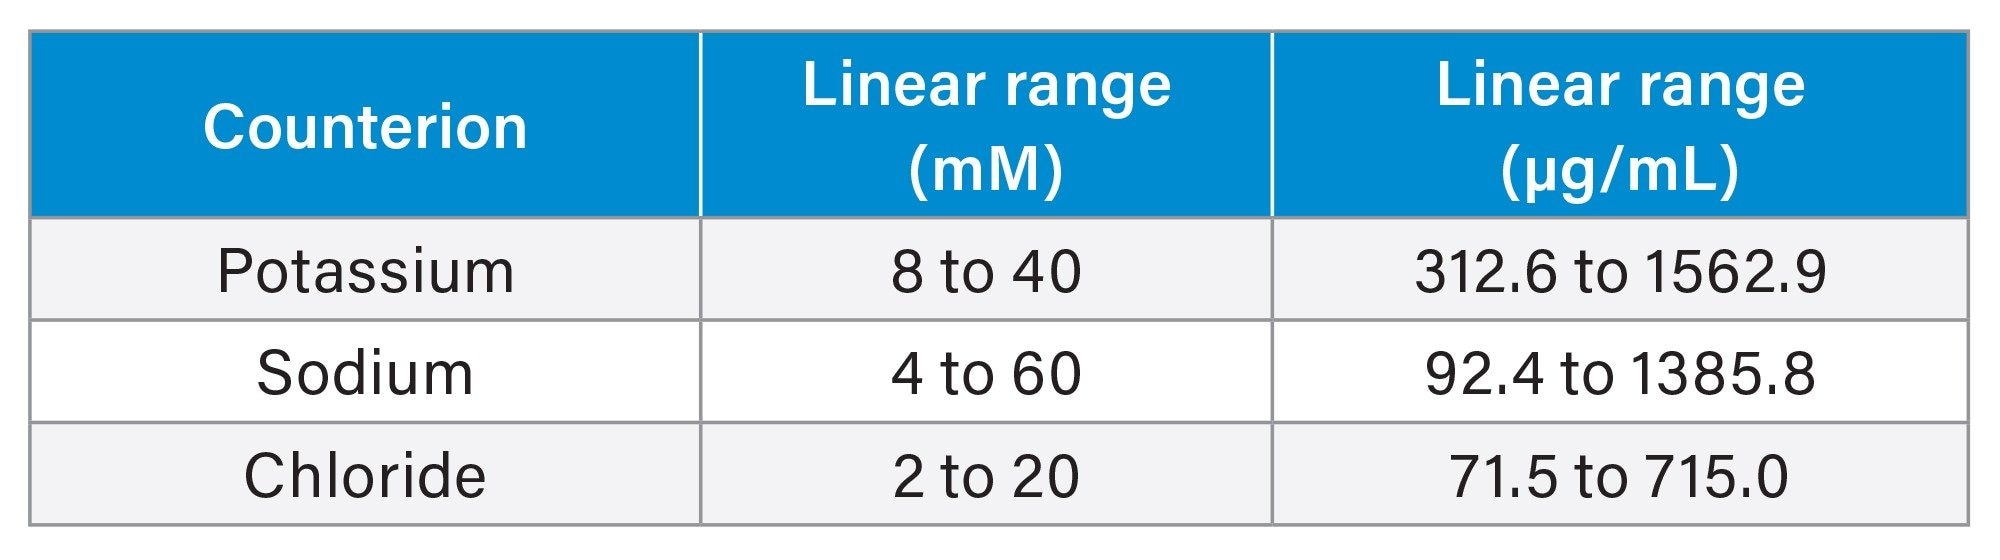
The various salts were prepared as a 100 mM stock, then all were screened from the ranges of 2.5 mM to 100 mM. Based upon the solubility of the salts and detector capacity, the linear ranges were individually recalculated for each salt. The specific linear ranges for each counterion are displayed in the Table 3 below:
Table 3
The linearity for each counterion was calculated using a linear log/log fit as recommended in the ELSD Operator’s Guide.6 Curves were generated in Empower 3 (Figures 3a through 3c). These linear curves were used to quantify the ions in the drug samples presented in Figure 2.
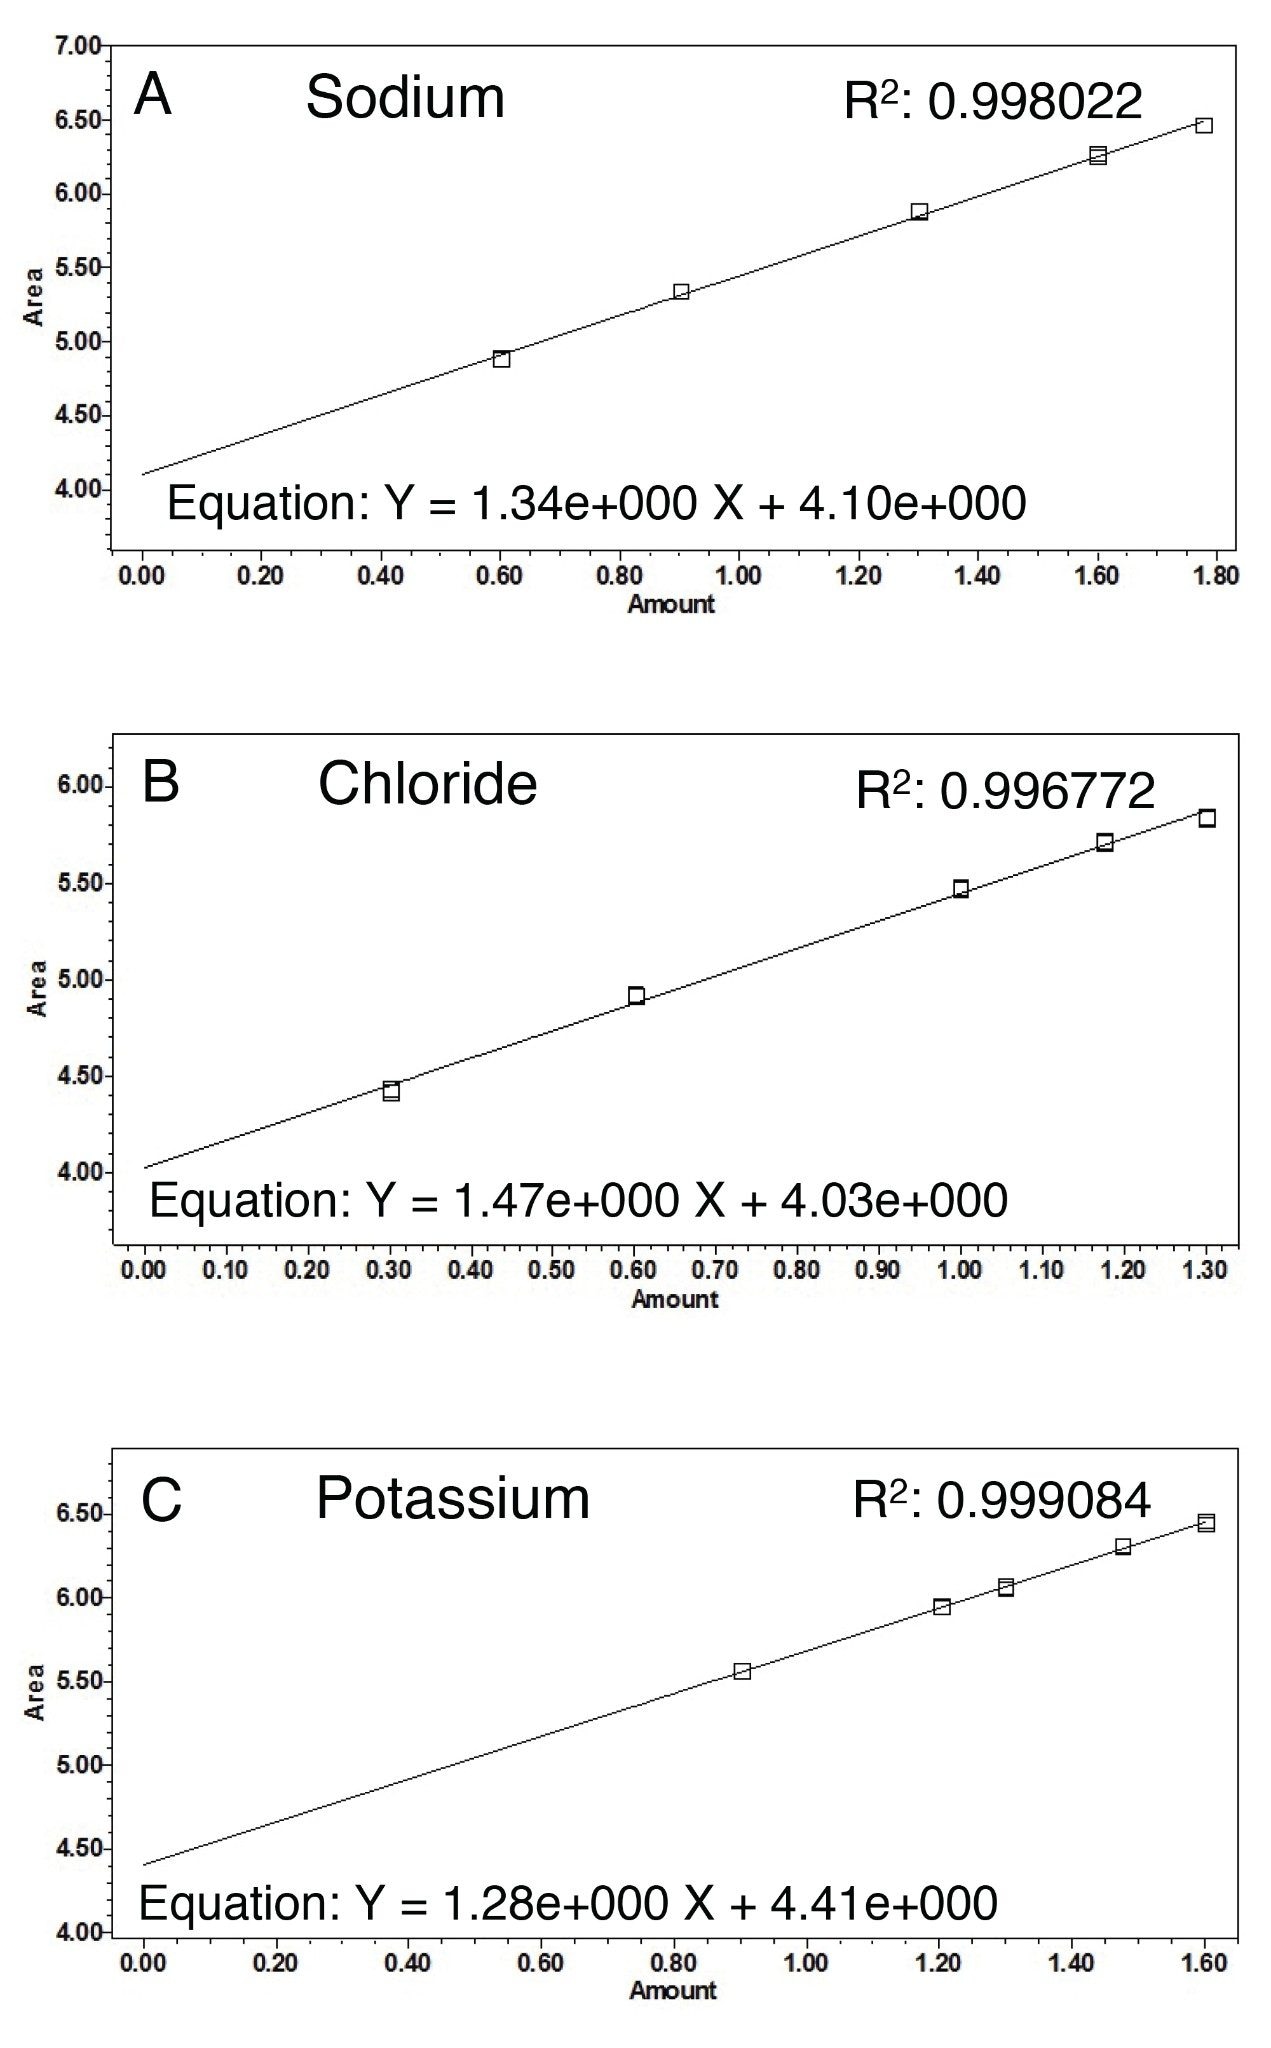
Figure 3b. The calibration curve for chloride between the concentrations of 2 mM to 20 mM.
Figure 3c. The calibration curve for potassium between the concentrations of 8 mM to 40 mM.
The R2 values for the counterion curves are >0.997. This demonstrates that the concentration of counterions can be calculated accurately using ELSD in combination with HILIC, and therefore provide a solution for the quantitative analysis of pharmaceutical counterions.
Throughout the study, some recommend courses of action were taken to keep the system data reproducible. After approximately 100 injections, the ELSD was cleaned by sonicating the nebulizer and flushing the drift tube as detailed in the ELSD operator’s manual.6 Since most of the common counterions are non-volatile salts, they may accumulate and precipitate in the ELSD.
Also, aqueous mobile phases were prepared weekly and test blank injections are recommended to ensure a smooth baseline before injection.
Conclusion
In the pharmaceutical industry, quality and efficiency of methodologies are essential. In this study, the use of Waters Atlantis Premier BEH Z-HILIC Column in combination with ELSD was shown to be successful at retaining and separating various counterions in salts, as well as separating counterions from their associated free base API. Further, the dynamic linearity of this method provides accurate quantification of counterions. Results were shown to be reproducible and provide a method for the challenges of counterions analysis in drug substances.
References
- Saal C, Becker A. Pharmaceutical salts: A Summary on Doses of Salt Formers From the Orange Book. European Journal of Pharmaceutical Sciences [Internet]. 2013 Jul 16 [cited 2022 Jan 5];49(4):614–623. Available from: https://www.sciencedirect.com/science/article/abs/pii/S0928098713002170?viewFullText=true#b0010.
- Staiger Pharm D. B. What Are “Salt Forms” Of Drugs And Why Are They Different? [Internet]. Walrus. Walrus Health; 2018 [cited 2022 Jan 5]. Available from: https://walrus.com/questions/what-are-salt-forms-of-drugs-and-why-are-they-different.
- Savjani KT, Gajjar AK, Savjani JK. Drug Solubility: Importance and Enhancement Techniques. International Scholarly Research Notices Pharmaceutics [Internet]. 2012;2012:1–10. Available from: https://www.ncbi.nlm.nih.gov/pmc/articles/PMC3399483/.
- Dotzel M. Q6A Specifications: Test Procedures and Acceptance Criteria for New Drug Substances and New Drug Products: Chemical Substances [Internet]. U.S. Food and Drug Administration. U.S. Food and Drug Administration; 2000 [cited 2022 Jan 5]. Available from: https://www.fda.gov/regulatory-information/search-fda-guidance-documents/q6a-specifications-test-procedures-and-acceptance-criteria-new-drug-substances-and-new-drug-products.
- Walter T, Berthelette K, Patel A, Alden B, McLaughlin J, Field J, Lawrence N, Shiner S. Introducing Atlantis™ BEH Z-HILIC: A Zwitterionic Stationary Phase Based on Hybrid Organic/Inorganic Particles [Internet]. www.waters.com. Waters Corporation; Waters Application Note: 720007311 2021.
- Waters™ Corporation. 2424 Evaporative Light Scattering Detector Operator’s Guide 71500121802 Revision B. 2006.
720007564, March 2022