The Effect of Sample Vials on Analyte Stability: Mitigating In-Vial Degradation of Pharmaceuticals During LC Analysis
Abstract
Quality control processes (QC) are an integral part of the manufacturing of pharmaceuticals. From small molecule drugs to large biomolecules, all pharmaceuticals must undergo rigorous testing to verify that no impurities are present at levels which may be harmful to the consumer. Several factors can play a role in the successful testing of pharmaceuticals, one of which is the type of vial chosen for the sample. As previously reported, some types of vials can cause non-specific adsorption or degradation of pharmaceuticals.1–5 The data shown here compares three types of vials for the analysis of two small molecule pharmaceuticals, drospirenone, and lovastatin. Solutions of these active pharmaceutical ingredients are shown to be stable when stored in polyethylene vials and TruView™ pH Control Liquid Chromatography-Mass Spectrometry (LCMS) Certified Vials, as evident by the lack of degradant formation due to ester hydrolysis. In contrast, standard glass vials were found to cause degradant formation at variable levels for the same compounds under the same test conditions. These results mimic QA/QC workflows and show the importance of vial selection for pharmaceutical assays.
Benefits
- Minimal degradant formation using specially treated glass vials (TruView pH control LCMS Certified Vials) compared to standard vials reduces false out of spec results for impurities
- Consistent results across vial replicates and lots ensures reliable LC assay results
- Specially treated glass vials show comparable results to polyethylene vials
Introduction
Pharmaceutical QC workflows are tightly controlled to ensure that only product of acceptable quality reaches consumers. As part of these workflows, limits on the levels of certain impurities are established. For known impurities, an upper limit for peak area may be specified, but for unknown impurities these limits can be hard to establish. LC analysis using a stability indicating method will usually detect the impurities generated during manufacturing of an active pharmaceutical ingredient (API). While this will normally account for most of the impurities detected, the possibility of degradant formation caused by glass vials must also be considered. As reported previously, some types of glass vials can lead to in-vial chemical changes of the API.1–5 Wallace notes that even small quantities of particulate matter on the surface of the vials can have an effect on data quality, including but not limited to irreproducible results or sample loss due to adsorption.2 Arvary and Mangion reported phosphorous pseudorotation or hydrolysis of two compounds caused by glass vials generating an alkaline sample solution.3 Jin and coworkers showed that glass vials caused the base-catalyzed degradation of the pharmaceutical ezetimibe.4 Other examinations into the effects of glass vials on sample stability were reported and mitigation strategies proposed by Huang et al.5 These studies demonstrate that the use of an inappropriate vial can cause analyte adsorption or degradation, potentially leading to out of specification (OOS) results.
In this work we show how the type of glass vial selected can impact sample stability, demonstrated for lactone-containing analytes. Lactones are subject to hydrolysis of the ester group leading to the formation of a hydroxy carboxylate.6 This degradant could appear in a QC test, especially when vials containing high concentrations of leachable sodium are used. The leaching of sodium causes pH changes in the sample diluent leading to an alkaline solution which can catalyze the hydrolysis of the lactones. Sodium levels and solution pH can vary from vial to vial making it difficult to determine the cause of the degradation, while also generating irreproducible results. Waters new TruView pH Control LCMS Certified Vials are designed to have very low levels of leachable sodium and other pH-altering compounds, minimizing changes in solution pH and therefore reducing the potential for sample degradation due to base-catalyzed reactions. TruView pH Control LCMS Certified Vials were used during the analysis of two lactone-containing compounds, which showed high degradant levels when stored in standard glass vials.
Experimental
Sample Description
Stock solutions were made at a concentration of 1.0 mg/mL using a 70:30 v/v water:acetonitrile diluent. These solutions were used in the vial stability study. For the forced degradation study, 100 µL of the stock solutions were combined with 10 µL of a 0.1 N NaOH aqueous solution. Samples were allowed to sit at room temperature for no more than 24 hours before testing.
LC Conditions
|
LC systems: |
ACQUITY™ UPLC™ H-Class PLUS with Quaternary Solvent Manager (QSM), Sample Manager Flow Through Needle (SM-FTN), Column Manager (CM), PDA Detector and QDa™ Mass Detector |
|
Detection: |
UV @254 nm SIRs determined for API and Degradants (outlined in Table 1) |
|
Column: |
ACQUITY Premier HSS T3 1.8 µm, 2.1 x 50 mm (p/n : 186009467) |
|
Vials: |
Polypropylene Vial 300 µL (p/n: 186002626) Standard Glass Vial 2 mL TruView pH Control LCMS Certified Vials |
|
Column temperature: |
30 °C |
|
Sample temperature: |
10 °C |
|
Injection volume: |
1.0 µL |
|
Flow rate: |
0.5 mL/min |
|
Mobile phase A: |
0.1% Formic Acid in Milli-Q Water |
|
Mobile phase B: |
0.1% Formic Acid in Acetonitrile |
|
Gradient profile: |
Linear ramp from 5% to 95% B in 5 minutes, hold at 95% B for 1.0 minute. Return to 5% B in 0.1 minutes and re-equilibrate for 2.5 minutes. Total run time 8.5 minutes. |
MS Conditions
|
MS system: |
ACQUITY QDa |
|
Ionization mode: |
ESI+, ESI- |
|
Acquisition range: |
SIRs outlined in Table 1 |
|
Capillary voltage: |
1.5 kV ESI+ and 0.8 kV ESI- |
|
Cone voltage: |
15 V |
|
Full scan range: |
50–500 Da |
|
Sample rate: |
5 pts/sec |
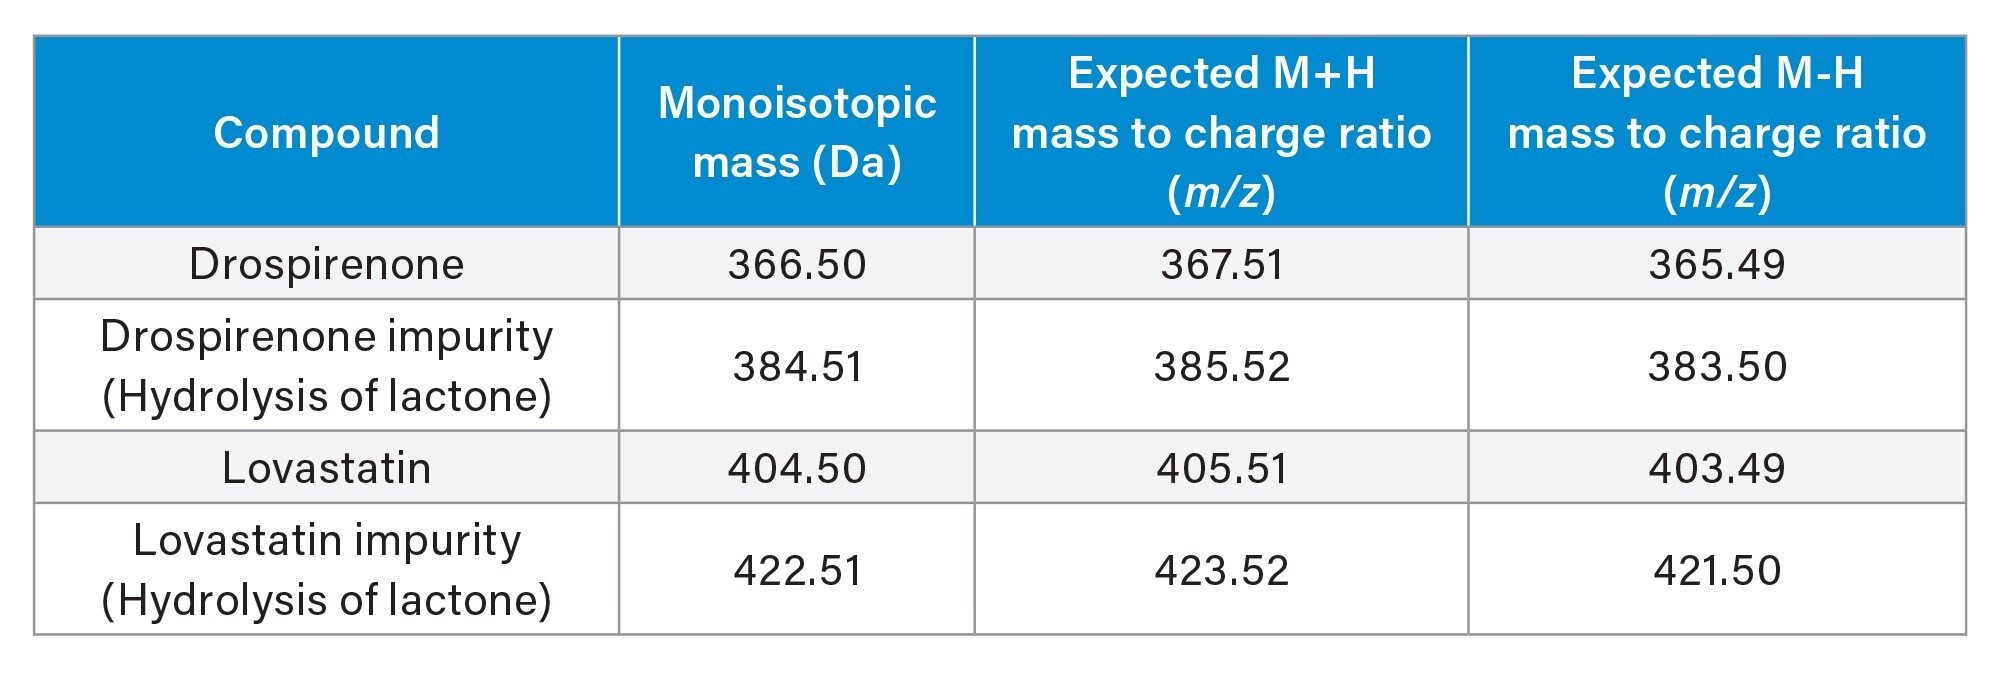 Table 1. Analytes monitored, neutral masses, and expected M+H or M-H ions.
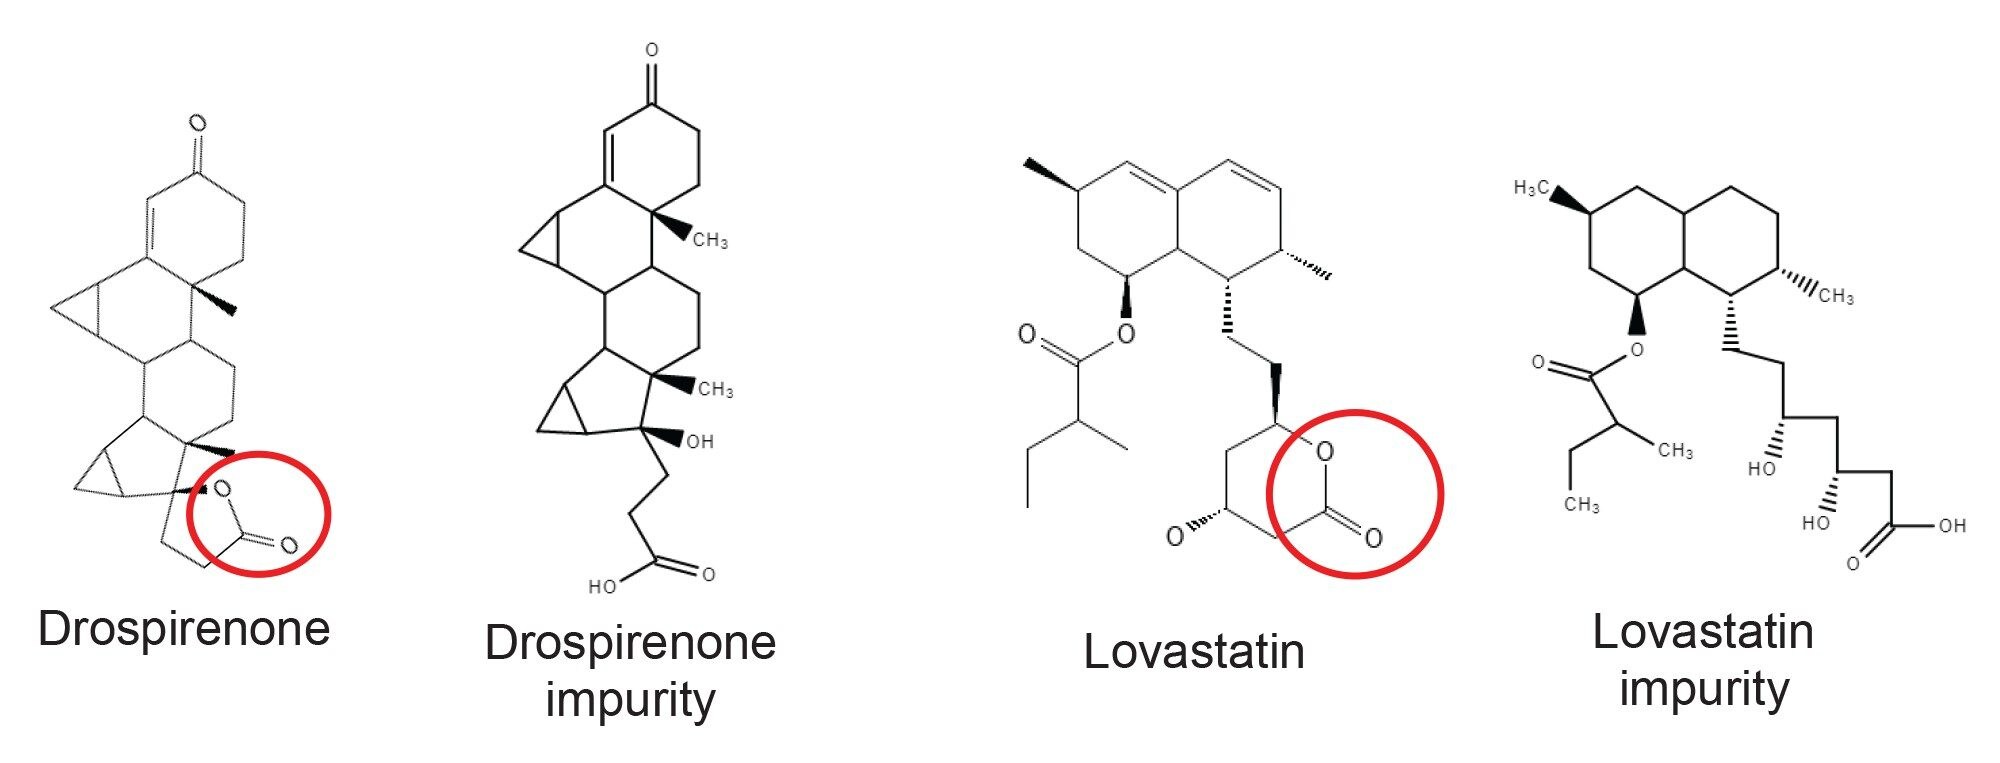 Figure 1. Chemical structures of Drospirenone, Lovastatin, and expected degradants. The active sites for ester hydrolysis are circled for the parent drugs.
Data Management
|
Chromatography software: |
Empower™ 3 FR4 |
Results and Discussion
Glass vials often contain low levels of leachable alkali metals due to the manufacturing process. One of the most common alkali metals in glass vials is sodium, which can leach into aqueous solutions, causing an increase in solution pH.1 In previous studies the solution pH was shown to change to a different extent depending on the type of vial the solution was stored in. However, even for vial types that should have low leachable sodium levels this can vary between manufacturers and even between vials or vial lots from one manufacturing source. A test method to measure these pH changes was developed. A plot of average pH versus average sodium concentration measured from the TruView pH Control LCMS Certified Vials (herein referred to as “treated”), standard, and competitive glass vials is shown in Figure 2 to demonstrate this effect. Sodium levels were determined by ICP-OES and pH measurements were performed using a proprietary technique.
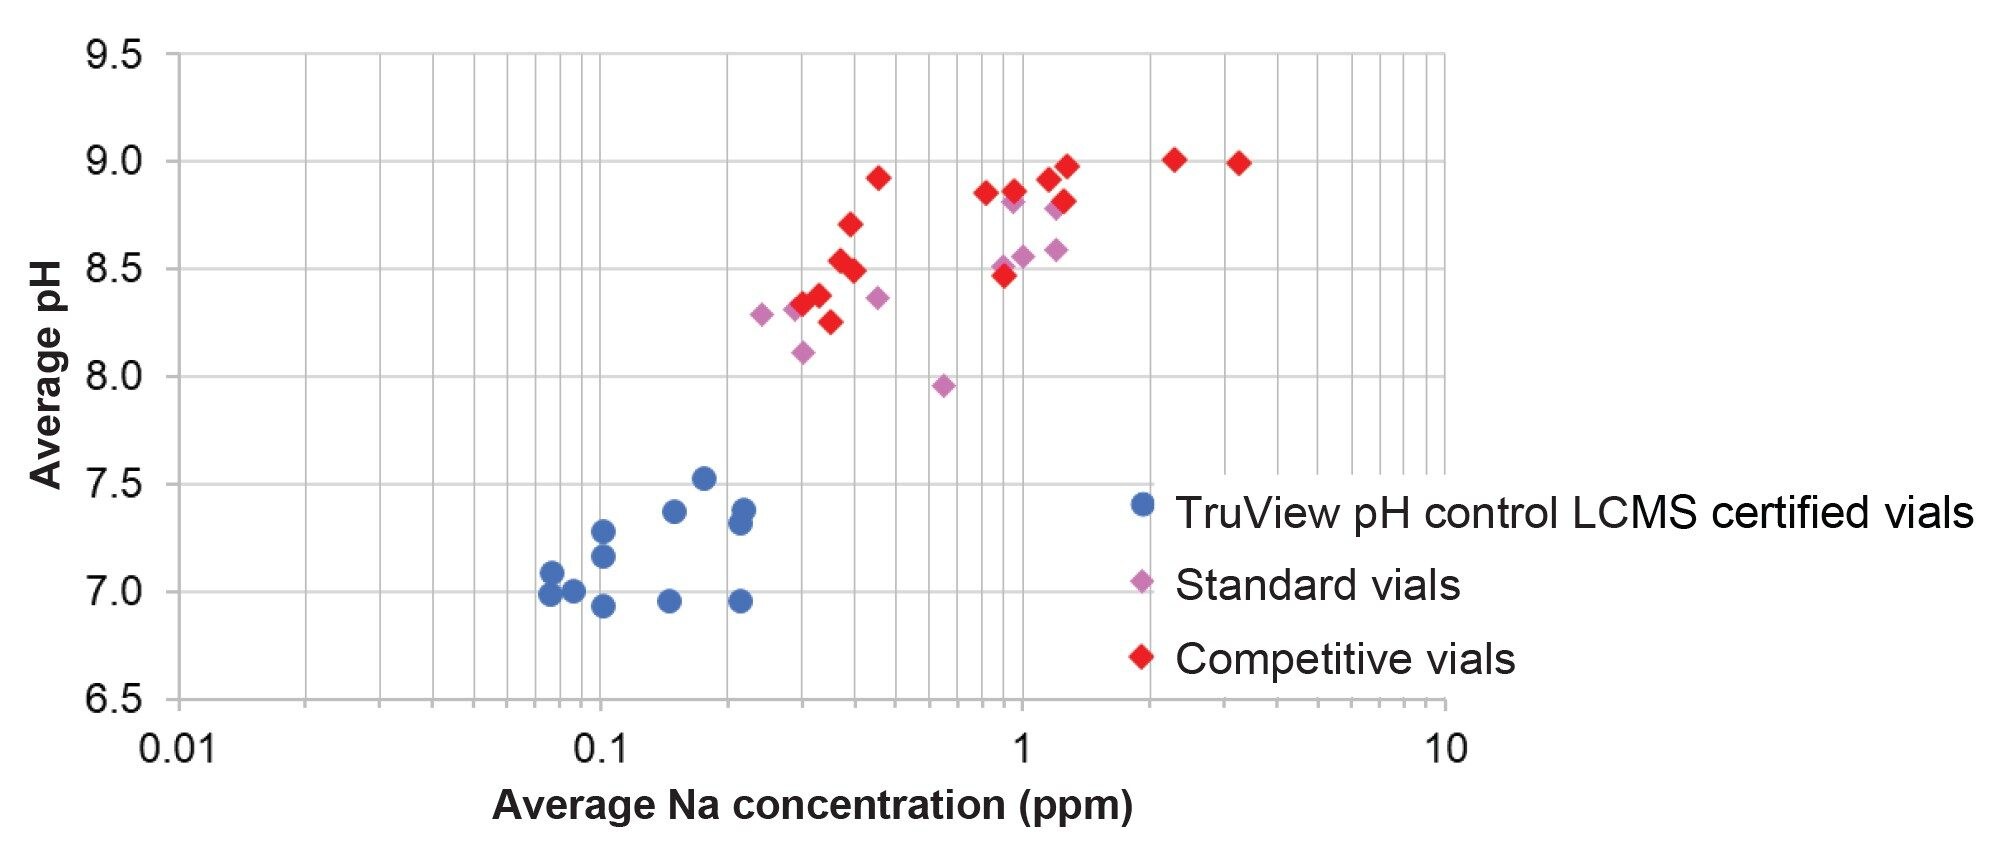 Figure 2. Plot of average pH versus average sodium concentration measured from the treated, standard, and competitive glass vials.
The aqueous solutions in the treated glass vials contain low sodium concentrations and the solution pH is neutral or close to neutral. As shown further in Figure 3, all solutions in the treated glass vials had pH values below 8.0. In comparison, the average sodium concentration and average pH for the solutions in the standard vials and competitive vials were higher in general (Figure 2), and the maximum pH from different lots were all above 8.0 and for some competitive lots, even above 9.0 (Figure 3).
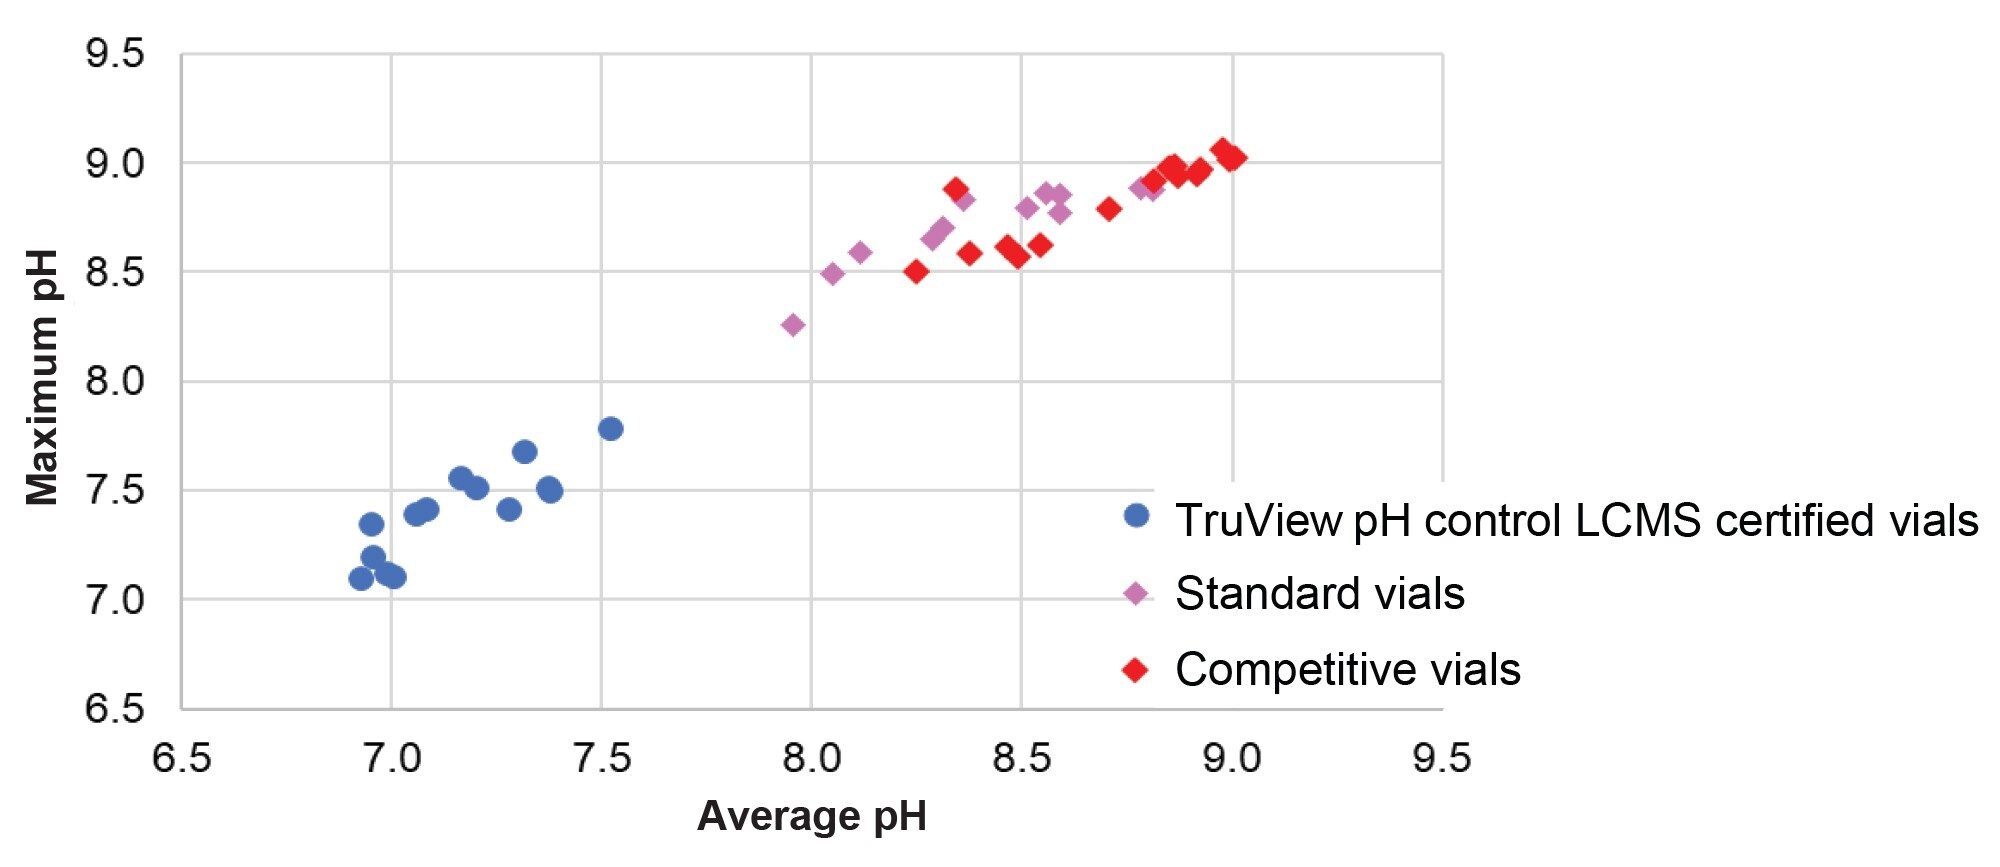 Figure 3. Plot of maximum pH versus average pH from the treated, standard, and competitive glass vials.
In addition, the solution pH can vary widely from vial to vial, from near neutral to 9 (refer to Figure 4) for standard vials. The treated vials do not have this issue. Certain analytes may undergo a chemical reaction at a higher pH causing the formation of degradants. This in-vial degradation can cause the assay of an active pharmaceutical ingredient (API) to produce an out of specification (OOS) result for impurity percent area (percent area) leading to the failure of a batch. Examples of such chemical reactions include phosphorous pseudorotation,3 and base catalyzed hydrolysis of certain functional groups like amides or esters.4–5 OOS results will trigger investigations to determine the cause of the result as outlined by the FDA.7
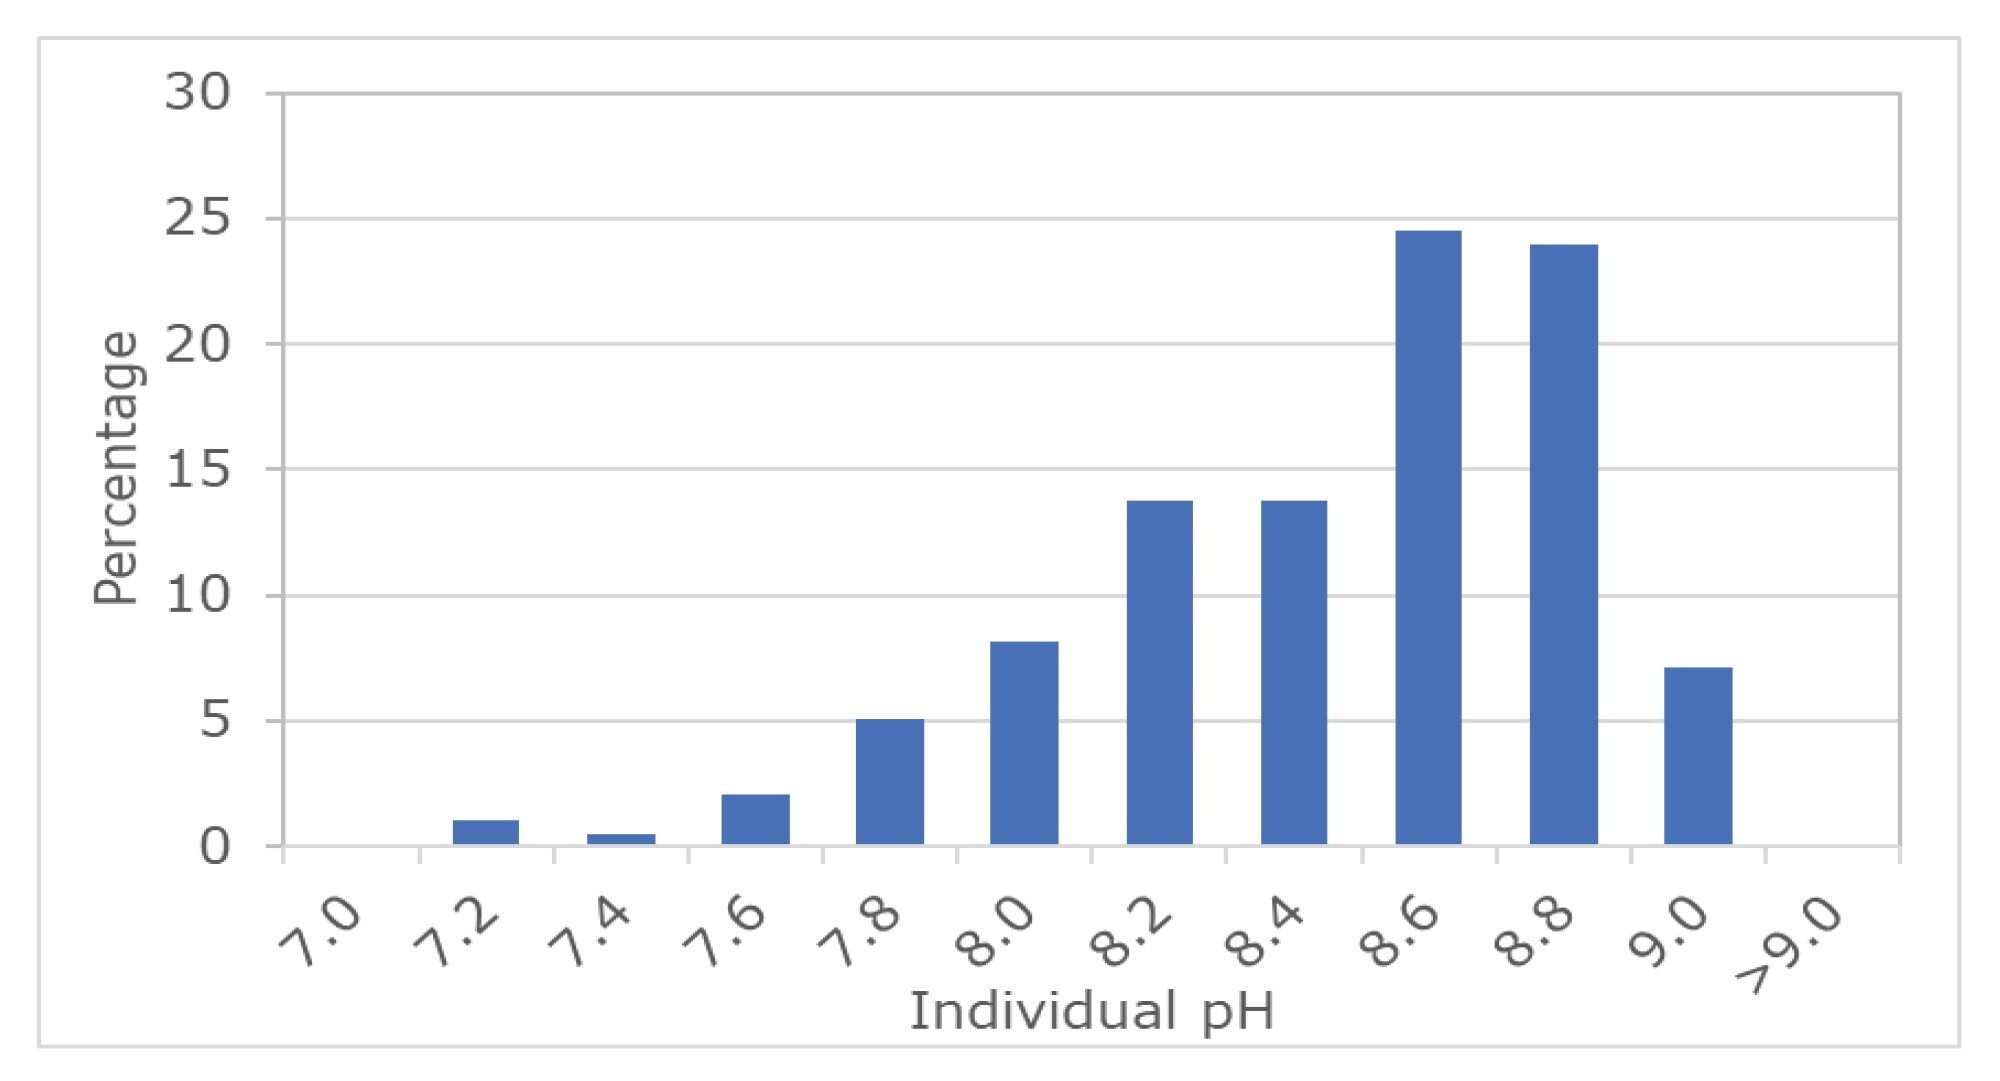 Figure 4. Variation of solution pH in vial replicates for ~200 standard vials by percentage.
In this work, the effect of pH shifts in vials was examined by introducing a compound sensitive to pH changes to the vials and then separating the compound from any degradants formed. Two compounds were selected for testing, drospirenone and lovastatin. As seen in Figure 1, both compounds contain a lactone, or cyclic ester group. Drospirenone’s γ-lactone and lovastatin’s δ-lactone are both susceptible to irreversible base-catalyzed hydrolysis to a hydroxy carboxylate.7 At higher levels of sodium leached from a vial, the pH of the solution increases (Figure 2), speeding up the degradation of the compounds to the hydroxy carboxylate (Figure 1). Prior to vial stability testing a simulated forced degradation study using 0.1 N NaOH was performed to gather retention time and mass spectral information for the degradants. LC method development was performed off-line to ensure that the degradants were not eluting at the same time as the API, and to optimize the selected ion recording (SIR) conditions using the QDa Detector. Figures 5 and 6 show example chromatograms for the APIs and impurities as well as mass spectra of the degradants of drospirenone and lovastatin respectively, taken from the forced degradation study.
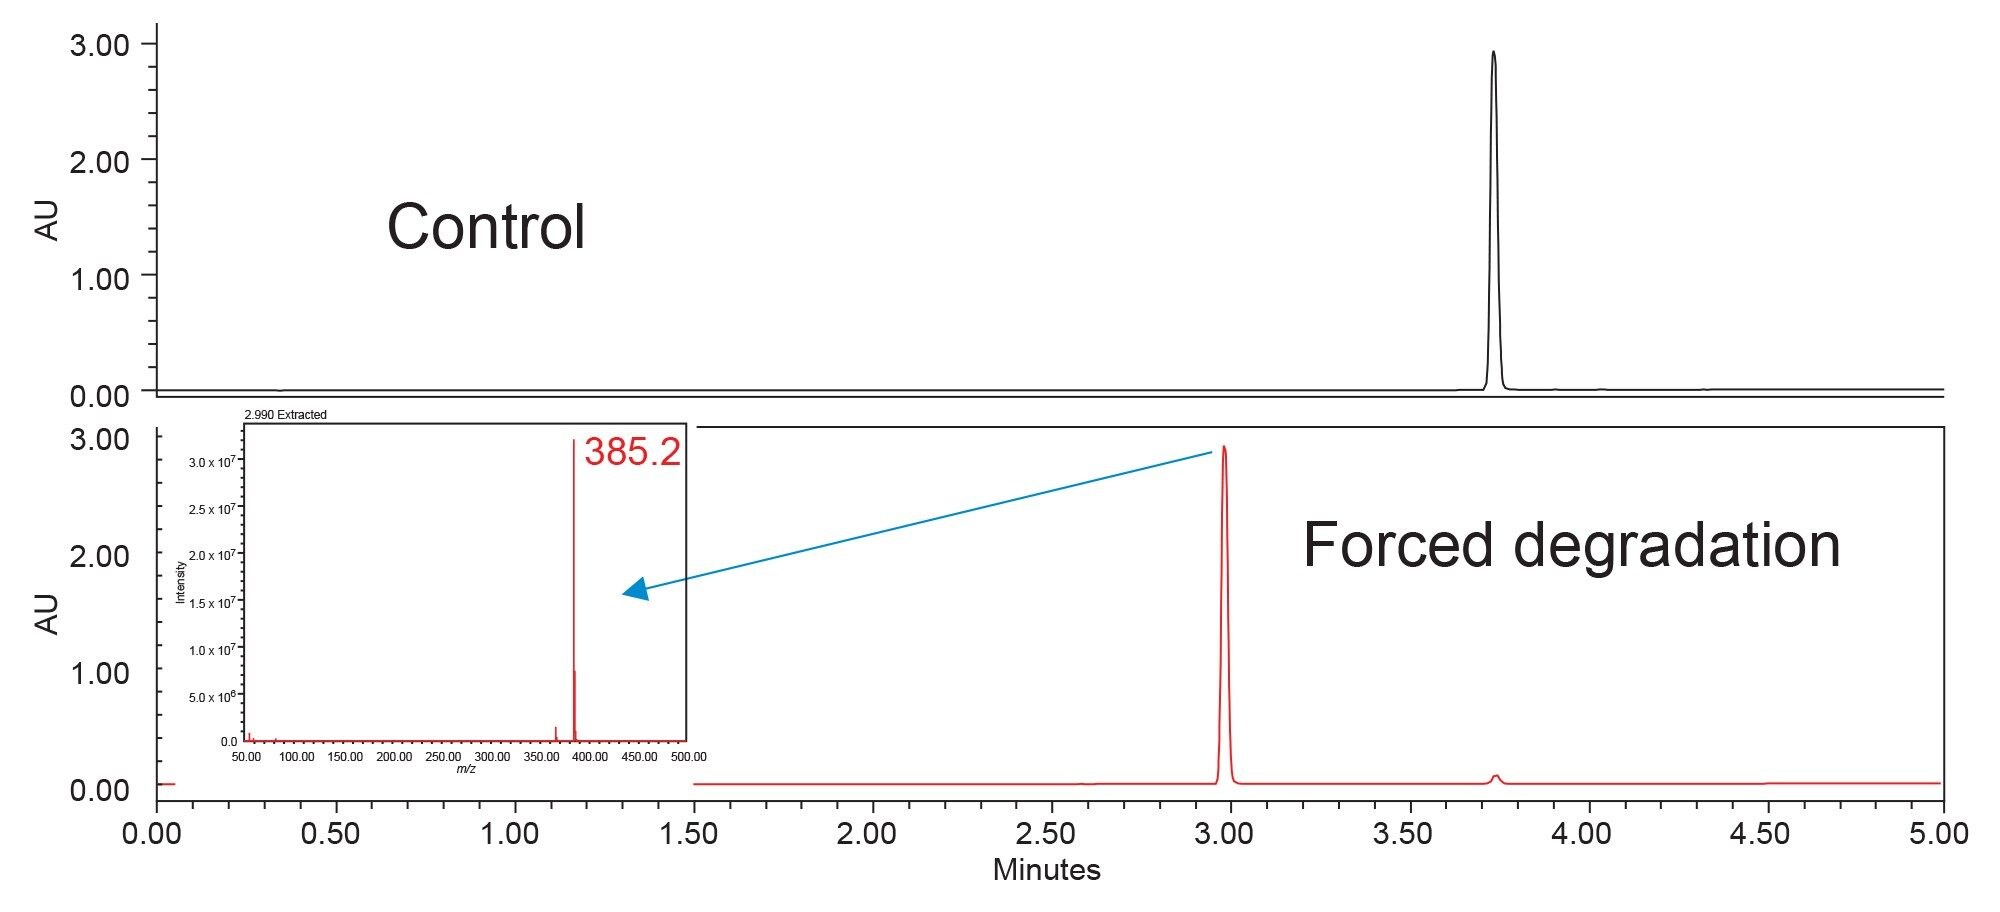 Figure 5. Drospirenone forced degradation study (bottom) and control sample (top) showing elution of the API and the expected degradant, as well as the mass spectrum of the degradant.
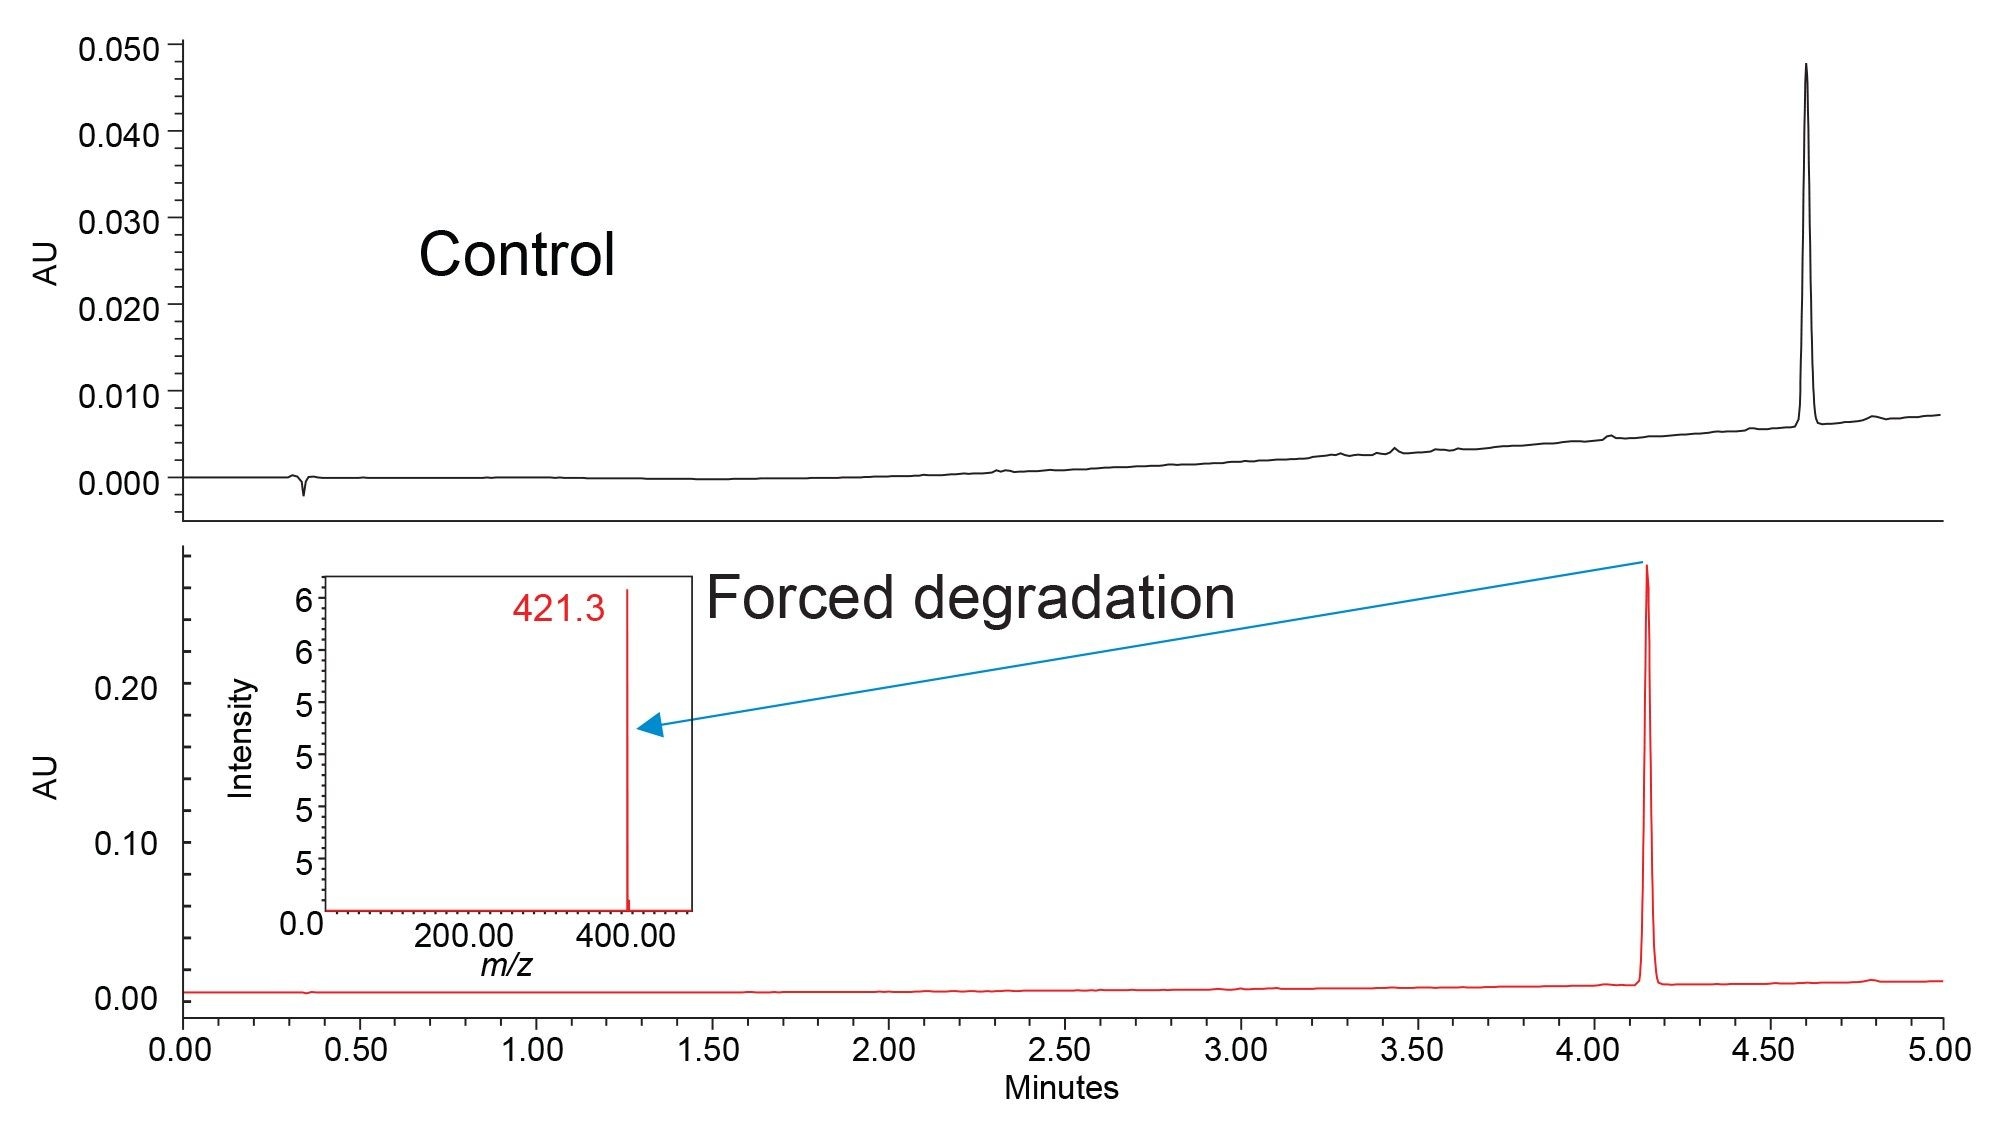 Figure 6. Lovastatin forced degradation study (bottom) and control sample (top) showing elution of the API and the expected degradant, as well as the mass spectrum of the degradant.
It is interesting to note that for lovastatin it is only the lactone functional group which is hydrolyzed and not the non-cyclic ester group present in the molecule. No degradants were detected that match the products of the hydrolysis of the non-cyclic ester group. Once the degradants were identified and a method developed to separate them from the APIs, a stability study using different vials was developed and executed.
Three different vial types were evaluated to determine their impact on the stability of solutions of drospirenone and lovastatin: polypropylene vials, the TruView pH Control LCMS Certified Vials, and standard glass vials. For each vial type and test compound, 1 mg/mL stock solutions were added to five replicate vials. One vial of each standard was tested immediately, with triplicate injections, to get a baseline for degradant formation. Once tested, the vials were moved to a benchtop where they were allowed to sit at room temperature for approximately sixteen hours. The contents of the vials were then analyzed using triplicate injections from each vial. Figures 7 and 8 show the degradant peak areas for drospirenone and lovastatin respectively, in the different vial types.
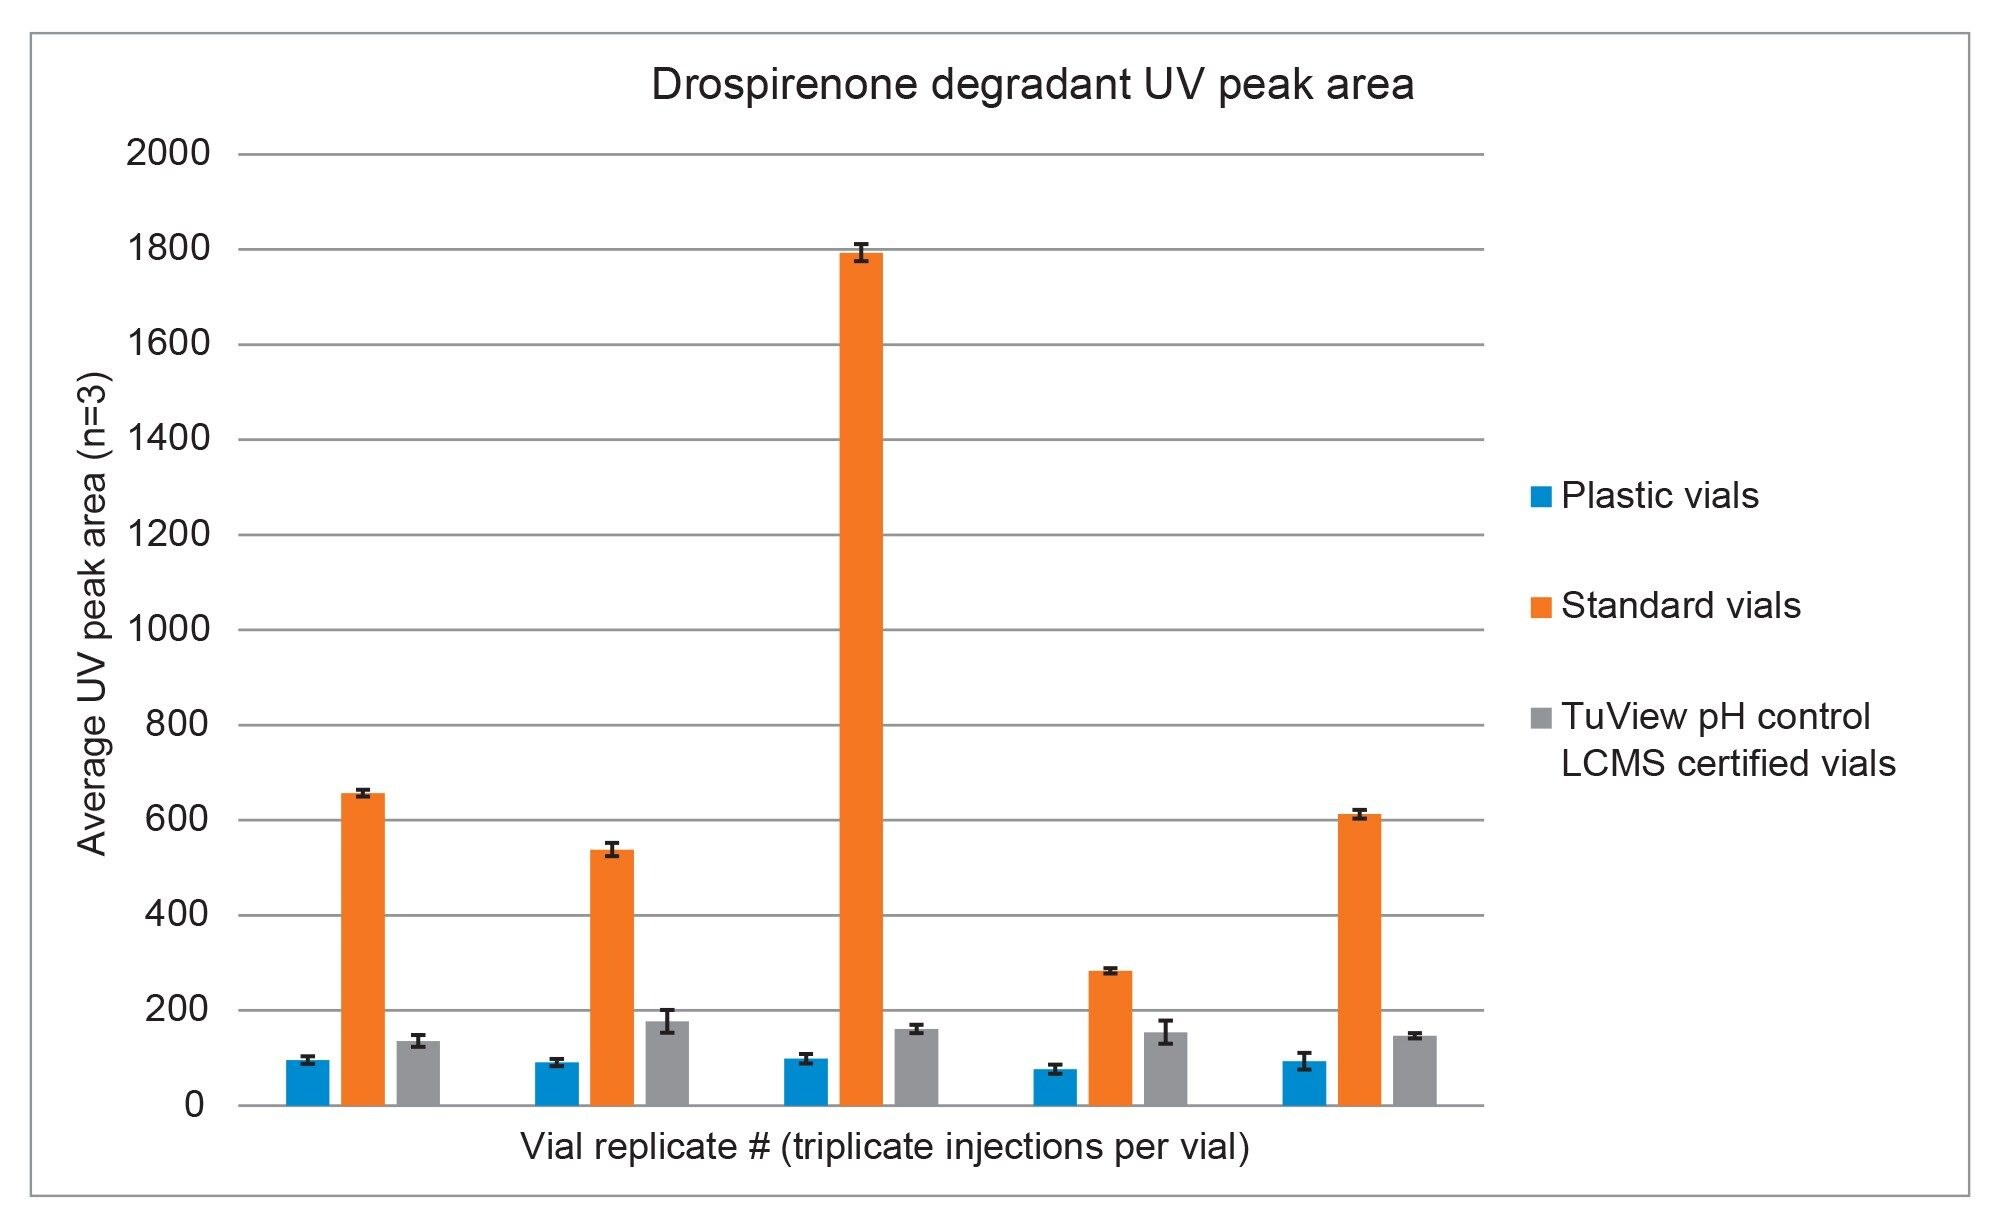 Figure 7. UV peak areas of drospirenone degradant across replicate vials and different vial types. Error bars indicate standard deviation for the replicate injection peak area results.
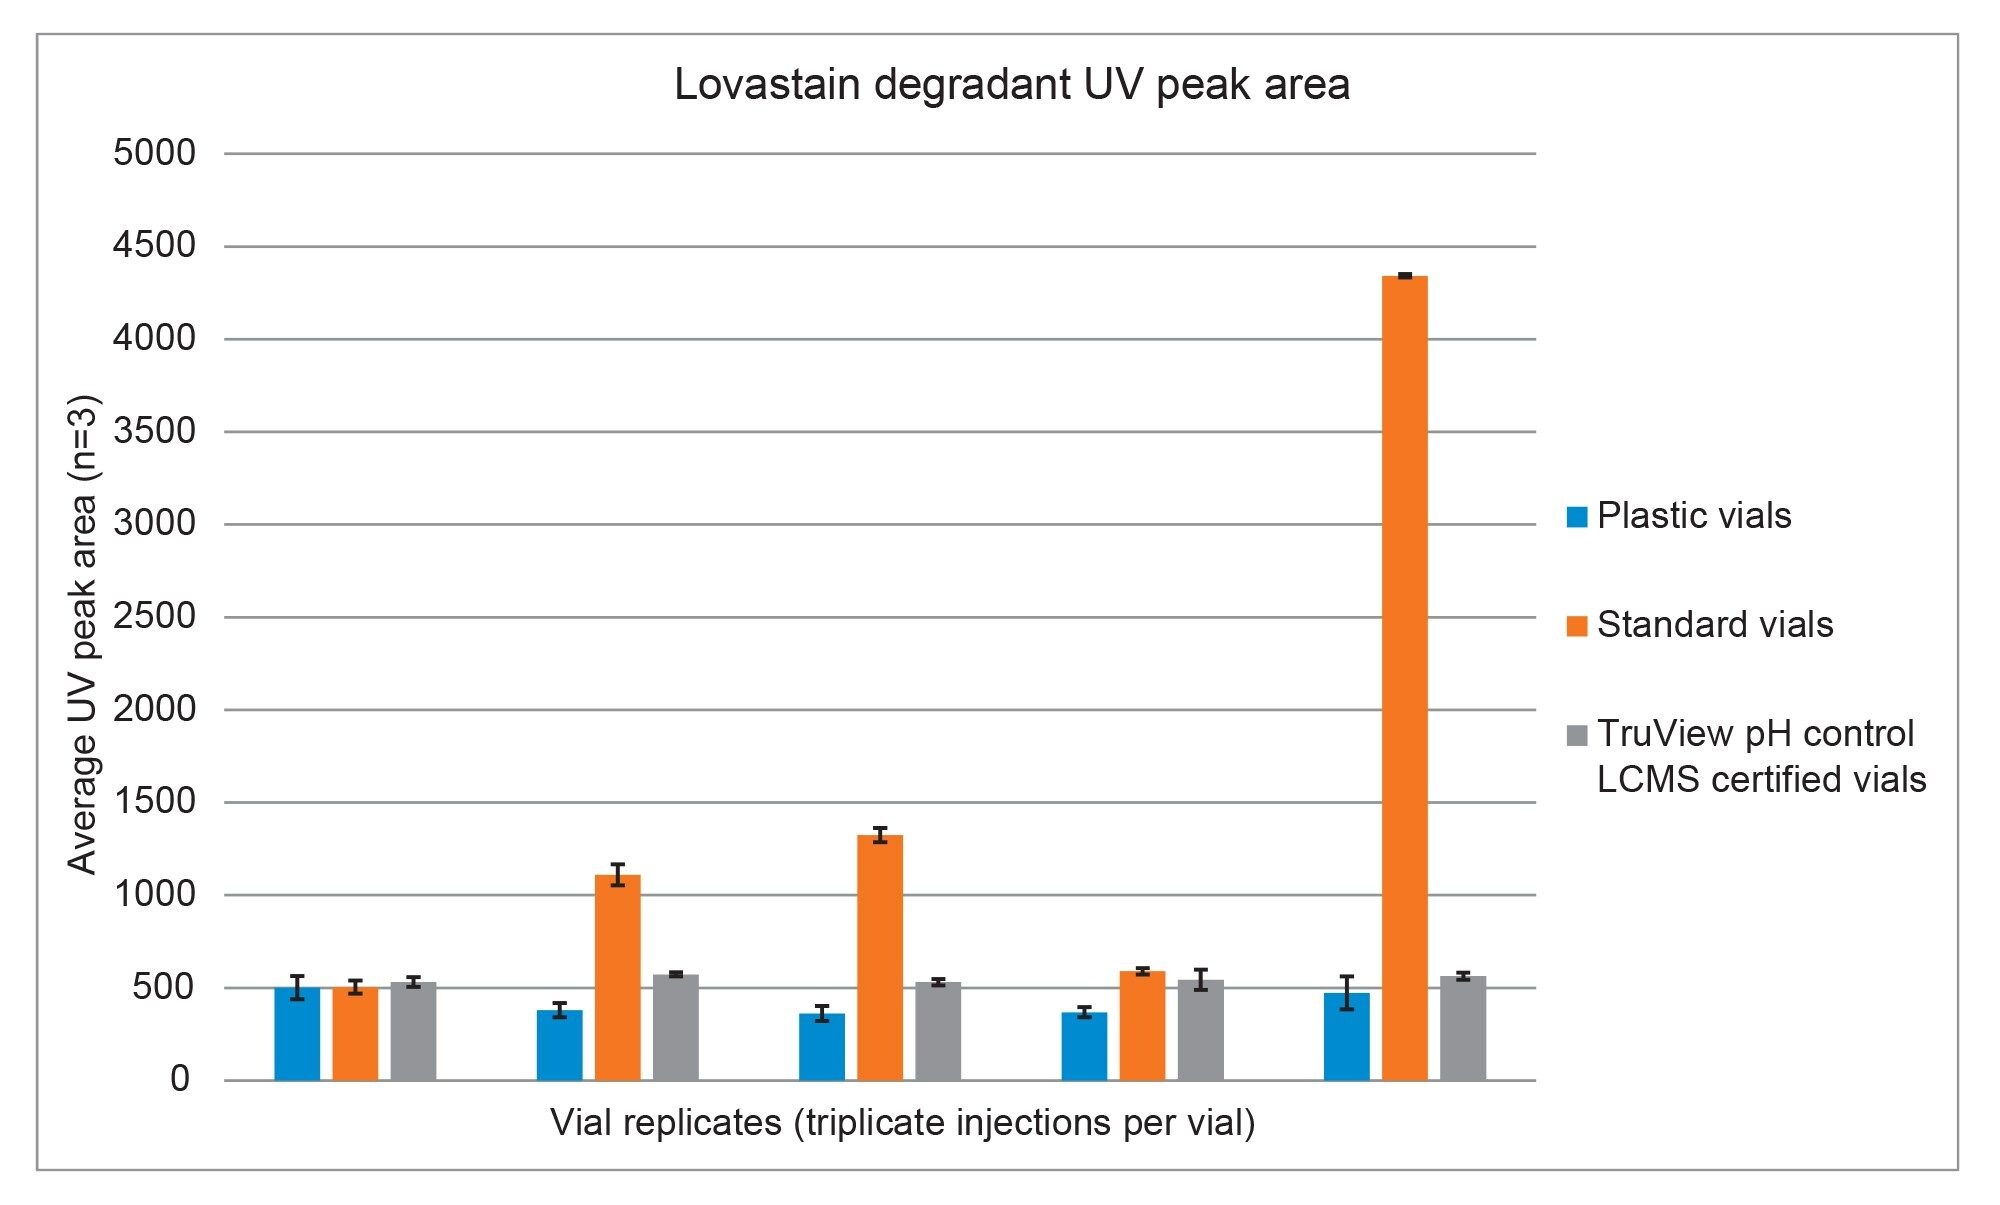 Figure 8. UV peak areas of lovastatin degradant across replicate vials and different vial types. Error bars indicate standard deviation for the replicate injection peak area.
For the Waters TruView pH Control LCMS Certified Vials and the polypropylene vials the degradant peak areas of both drospirenone and lovastatin were very low. The peak areas for both vial types match the time zero data collected for degradant peak area, indicating little to no formation of the degradant over the ~16 hours that the samples were in the vials. For the standard vials, however, considerable degradant formation was observed. What is even more concerning is that some of the standard vials show good results, i.e. degradant peak areas comparable to those for the polypropylene vials, while others show UV peak areas up to eight times higher. The irreproducible nature of the standard vials can lead to difficult troubleshooting of an OOS result. Both the polypropylene and TruView pH Control LCMS Certified Vials show reproducible results across the vial replicates. Using the new TruView pH Control LCMS Certified Vials can minimize OOS results, while providing an accurate analysis of a sample, without degradation due to pH modification of the solution.
Conclusion
Three different types of vials were used for the analysis of two pharmaceuticals susceptible to base-catalyzed ester hydrolysis, drospirenone and lovastatin. Standard glass vials showed considerable degradant formation over 24 hours, with formation of variable levels of the degradants across five different vials. In contrast, TruView pH Control LCMS Certified Vials showed little to no degradant formed over the same time. Using a standard vial for the assay could have led to random OOS results, triggering costly investigations into the cause, as well as delays in shipping what is actually acceptable product. The TruView pH Control LCMS Certified Vials are made from high-quality glass and undergo process steps which tightly control the leachable sodium levels. They are appropriate for LC and LC-MS assays and can minimize OOS events. By selecting a vial that has been specifically created to minimize sodium leaching, like the Waters TruView pH Control LCMS Certified Vials, critical assays can be performed reliably and with assurance that the vials won’t compromise the results generated.
References
- Does an Autosampler Glass Vial Influence the PH of Your Valuable Sample? Thermo Scientific Technical Note. TN21921-EN 0619S (2019).
- Wallace A. How Glass Vial Quality Affects Data Accuracy. Sample Preparation and Processing Spotlight Feature. LabMate Online. (2020) Accessed 29-June-2022 https://www.labmate-online.com/article/laboratory-products/3/thermo-fisher-scientific-uk-ltd/how-glass-vial-quality-affects-data-accuracy/2770.
- Arvary R, Mangion I. The Importance of Vial Composition in HPLC Analysis: An Unusual Case of Phosphorous Pseudorotation. J. Pharm. Biomed. Anal. 134 (2017) 237–242.
- Jin J, Wang Z, Lin J, Zhu W, Gu C, Li M. “Ghost peaks” of Ezetimibe: Solution Degradation Products of Ezetimibe in Acetonitrile Induced by Alkaline Impurities From Glass HPLC Vials. J. Pharm. Biomed. Anal. 140 (2017) 281–286.
- Huang Y, et al. Circumventing Glass Vial and Diluent Effects on Solution Stability of Small Molecule Analytes During Analytical Method Development and Validation. J. Pharm. Biomed. Anal. 213 (2022) 114676.
- Gomez-Bombarelli R, Calle E, Casado J. Mechanisms of Lactone Hydrolysis in Neutral and Alkaline Conditions. J. Org. Chem. 78 (14) (2013) 6868–6879.
- Durivage M. FDA Updates Guidance for Investigating OOS Test Results for Pharma Production. Pharmaceutical Online. June 24, 2022. Accessed 29-June 2022.
720007722, September 2022