Developing and Monitoring a High Sensitivity Bioanalysis MRM Method Using Intellistart™ and Radar Technology
Abstract
High sensitivity bioanalytical methods are used throughout the drug discovery and development process to provide accurate quantification data to support DMPK, toxicokinetics (TK) studies, and randomized clinical trials. Over the last 25 years tandem quadrupole LC-MS/MS has become the technology of choice for quantitative bioanalysis. Developing reliable fit for purpose methodologies requires careful evaluation of LC and MS acquisition parameters. Waters™ Tandem Quadrupole MS systems are equipped with Intellistart Software, which facilitates the fully automated development of robust, high sensitivity MRM methods. Intellistart optimizes ionization polarity, precursor ion, product ion(s), source voltages, and collision energies to identify the most optimal acquisition parameters. The Xevo™ Tandem Mass Spectrometers are also equipped with RADAR Technology which allows the simultaneous monitoring of the LC background signal simplifying method development and assay monitoring.
Benefits
- LC-MS/MS method development for bioanalysis studies
- Automated optimization of MRM conditions using Intellistart Technology
- Rapid, efficient development of optimal SIR, and MRM conditions for non-expert and expert users alike
- Monitoring of background signals using RADAR technology, to simplify LC/MS method development, ensure method applicability, and troubleshooting
Introduction
Tandem quadrupole mass spectrometry using multiple reaction monitoring (MRM) combined with liquid chromatography has become the technology of choice for the high sensitivity quantification of candidate pharmaceuticals in biofluids, due to its specificity, selectivity, and sensitivity.1 Developing rapid, high sensitivity quantitative bioanalytical methods that are consistently robust, reliable, and transferable is often challenging. These methods require the determination of the best MS source conditions, polarity of operation, precursor ions, product ions, and collision energies as well as developing rapid, reliable chromatographic conditions. Developing these LC-MS/MS methods is often time consuming and is traditionally performed by expert users.
Optimizing LC separations methodology often requires monitoring the background ions to minimize interference for analytes in the matrix whilst maximizing sample throughput. As drug development studies progress to randomized clinical trials the sample matrix becomes more complex, due to variation in age, lifestyle, health, diet, and presence of co-administered medications.2 The simultaneous monitoring of the chromatographic background signals whilst collecting the quantitative MRM signals facilitated a simple approach to monitoring the impact of these endogenous and exogenous compounds on assay performance.
Here we describe the use of Xevo Tandem Quadrupole MS combined with Intellistart Software for the rapid development of a sensitive, robust LC-MS/MS bioanalytical assay and RADAR Technology for the simultaneous monitoring of background matrix ions.
Experimental
Sample Description
To illustrate the application of Intellistart Software and RADAR Technology a bioanalytical method was developed for the quantification of methapyrilene in rat plasma and urine. Full particulars of the animal study and sample preparation are detailed in Waters application note “Tandem Quadrupole Acquisition Modes in DMPK Studies”, 720008016.3 Control wistar rat plasma and urine was obtained from BioIVT, NY, USA.
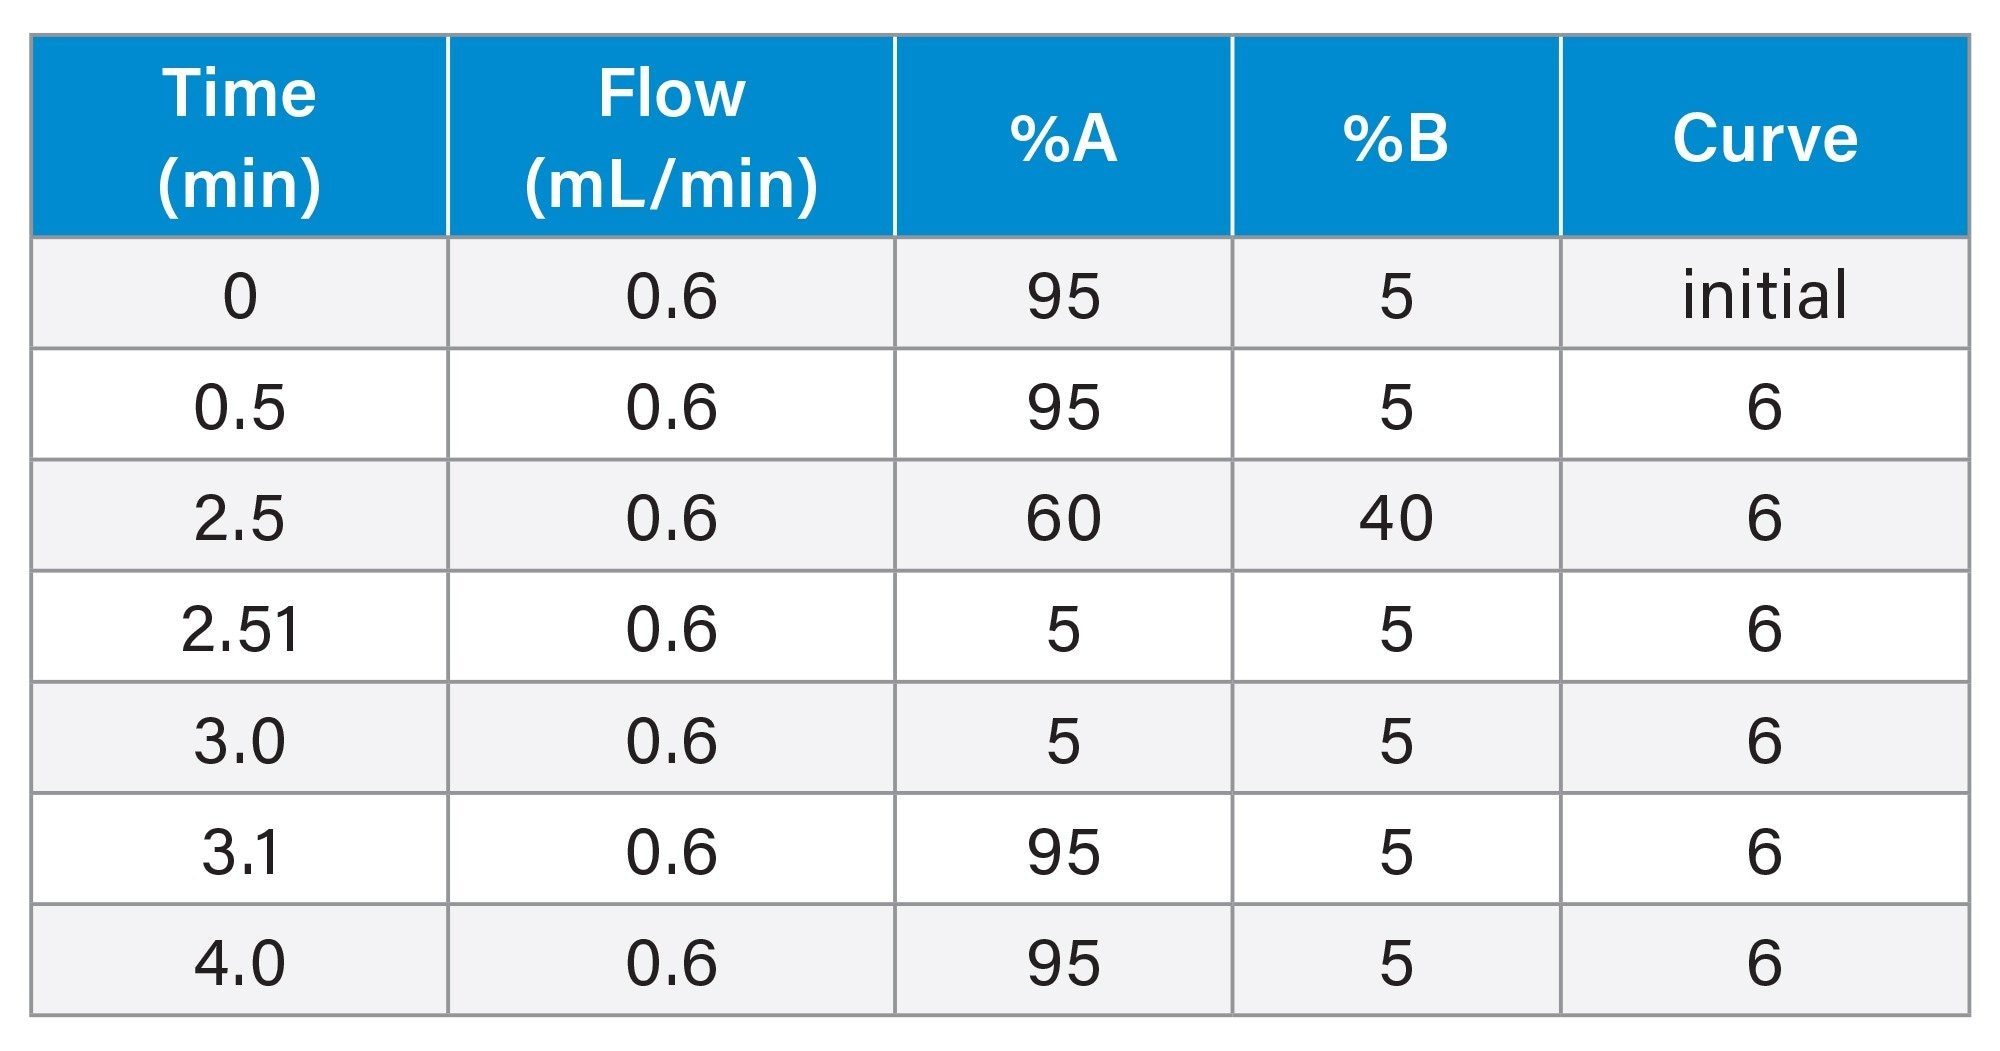
The plasma and urine samples were analysed by the injection of a 2 µL aliquot of extracted sample onto a 2.1 x 50 mm CORTECS™ C8 2.7 µm Column. The column was maintained at 40 °C and eluted with a linear reversed–phase gradient over 2.5 minutes at 600 µL/min using aqueous 0.1% formic acid as mobile phase solvent A and 0.1% formic acid in 95:5 (v/v) acetonitrile:water as mobile phase B, Table 1. The column effluent was monitored by positive ion ESi mass spectrometry operating in MRM mode. The column effluent was monitored by positive ion ESi mass spectrometry operating in MRM mode using the transition m/z=262.2→119.2 with a cone voltage of 30 V and a collision energy of 20 eV, Table 2.
LC Conditions
|
LC system: |
ACQUITY™ I Class UPLC™ |
|
Detection: |
Xevo TQ-XS |
|
Vials: |
Waters Total Recovery Vials (p/n: 186004631) |
|
Column(s): |
CORTECS Premier T3 Column, 2.7 µm, 2.1 x 100 mm (p/n: 186010473) |
|
Column temperature: |
40 °C |
|
Sample temperature: |
8 °C |
|
Injection volume: |
2 µL (urine), 1 µL (plasma) |
|
Flow rate: |
600 µL/min |
|
Mobile phase A: |
0.1% (v/v) aqueous formic acid |
|
Mobile phase B: |
95% acetonitrile, 5% water, 0.1% (v/v) formic acid |
|
Gradient: |
See gradient table, Table 1 |
Table 1
MS Conditions
|
MS system: |
Xevo TQ-XS |
|
Ionization mode: |
Positive Ion ESi |
|
Acquisition range: |
100–800 m/z (RADAR acquisition) |
|
Capillary voltage: |
2.0 kV |
|
Collision energy: |
20 eV |
|
Cone voltage: |
30 V |
|
MRM transition: |
m/z=262.2→119.2 |
Data Management
|
Chromatography software: |
MassLynx™ Ver 4.2 |
|
MS software: |
MassLynx Ver 4.2 |
|
Informatics: |
TargetLynx™ Ver 4.2 |
Results and Discussion
Multiple reaction monitoring is accepted as the most sensitive mode of analysis for trace measurements in a complex mixture using a mass spectrometer. In this mode of operation, the first resolving quadrupole is programmed to allow only specific ion (or ions) (m/z value) to be transmitted. The selected ions are then fragmented in the collision cell and directed to the final resolving quadrupole, this quadrupole is set to allow only selected fragment ions to pass thus providing a highly selective and specific analysis method. This specificity and selectivity, significantly reduces background “noise” resulting in a high sensitivity analysis, especially when combined with high resolution chromatography. As a result, MRM based LC-MS/MS has become the technology of choice for the high sensitivity quantification of pharmaceuticals and their metabolites in biological fluids.
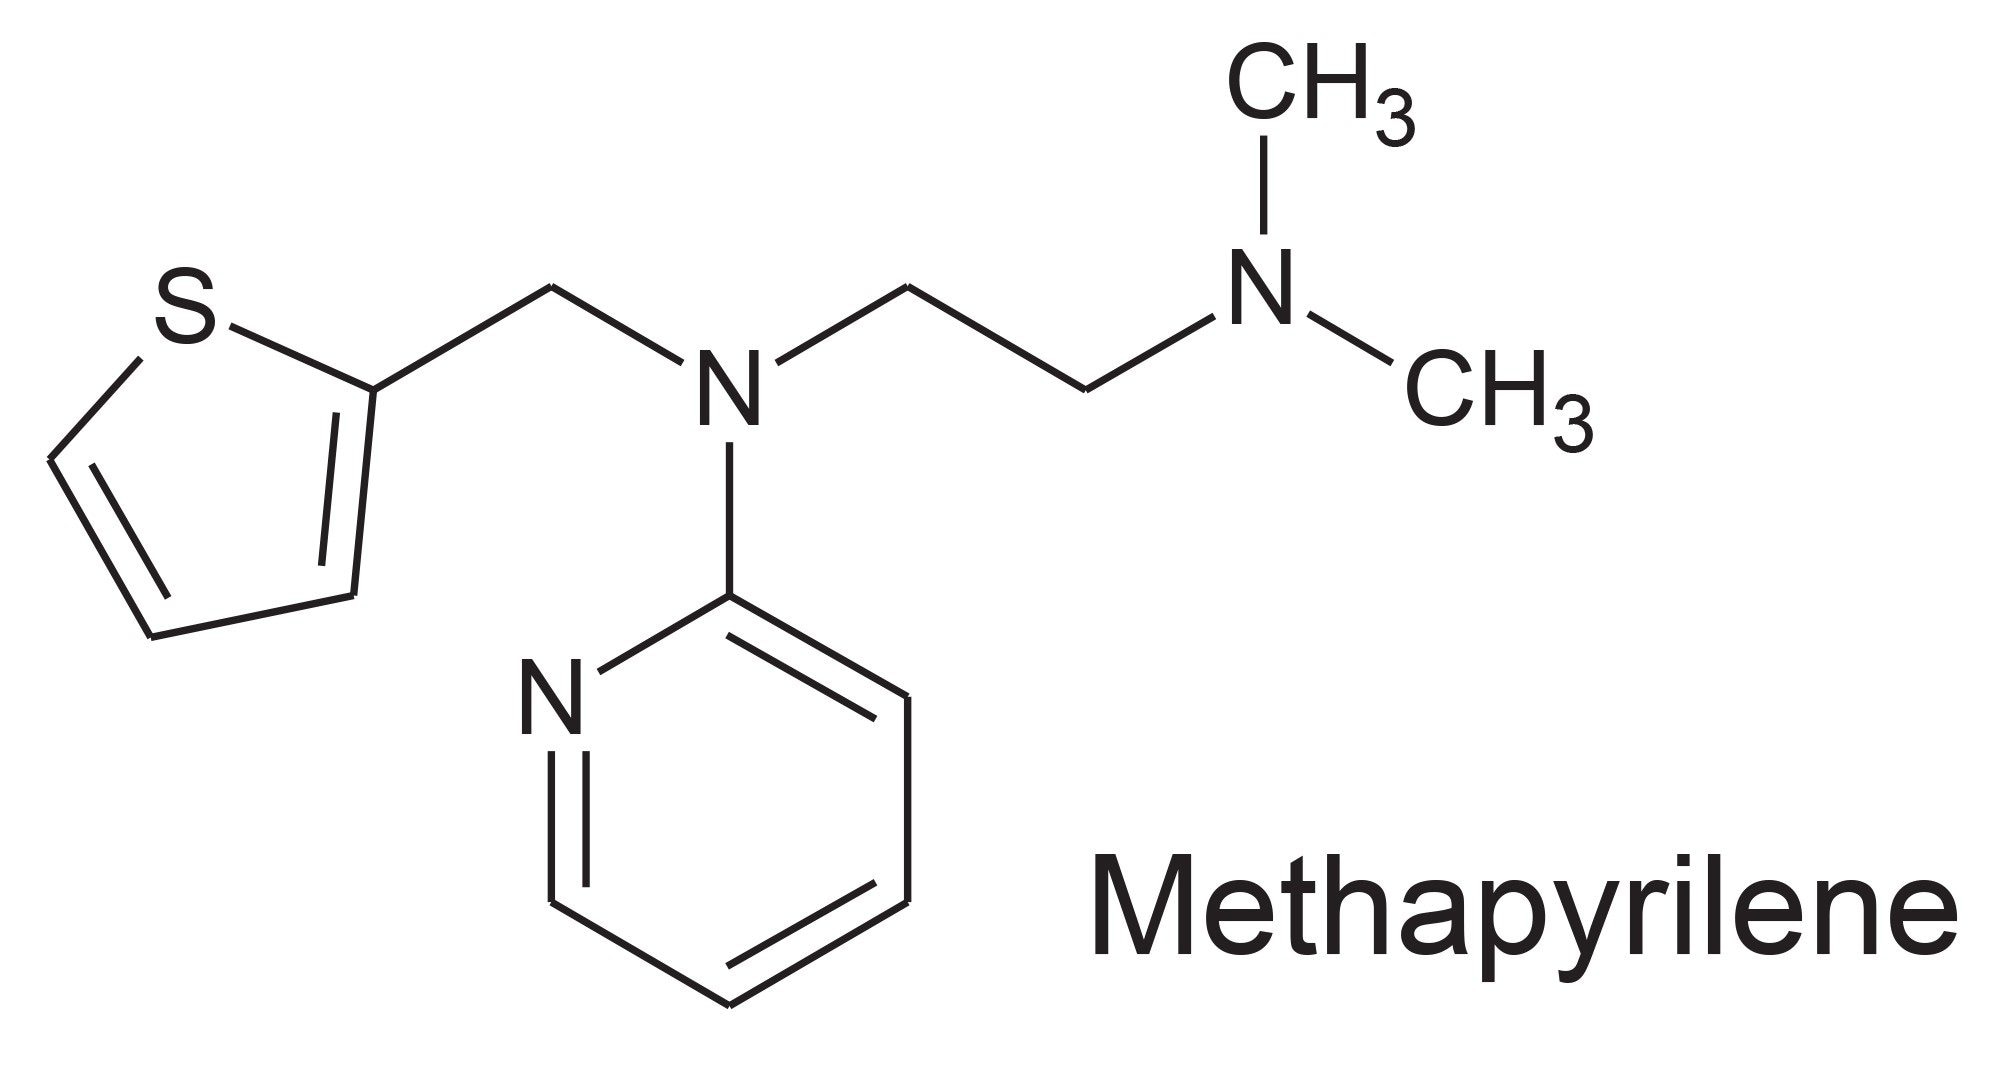
To illustrate the development and application of MRM analysis for the quantification of a pharmaceutical compound in plasma samples resulting from oral administration of methapyrilene (Figure 1), an antihistamine and anticholinergic drug, to the male wistar rat at 150 mg/Kg were analysed by reversed–phase UPLC-MS/MS.4
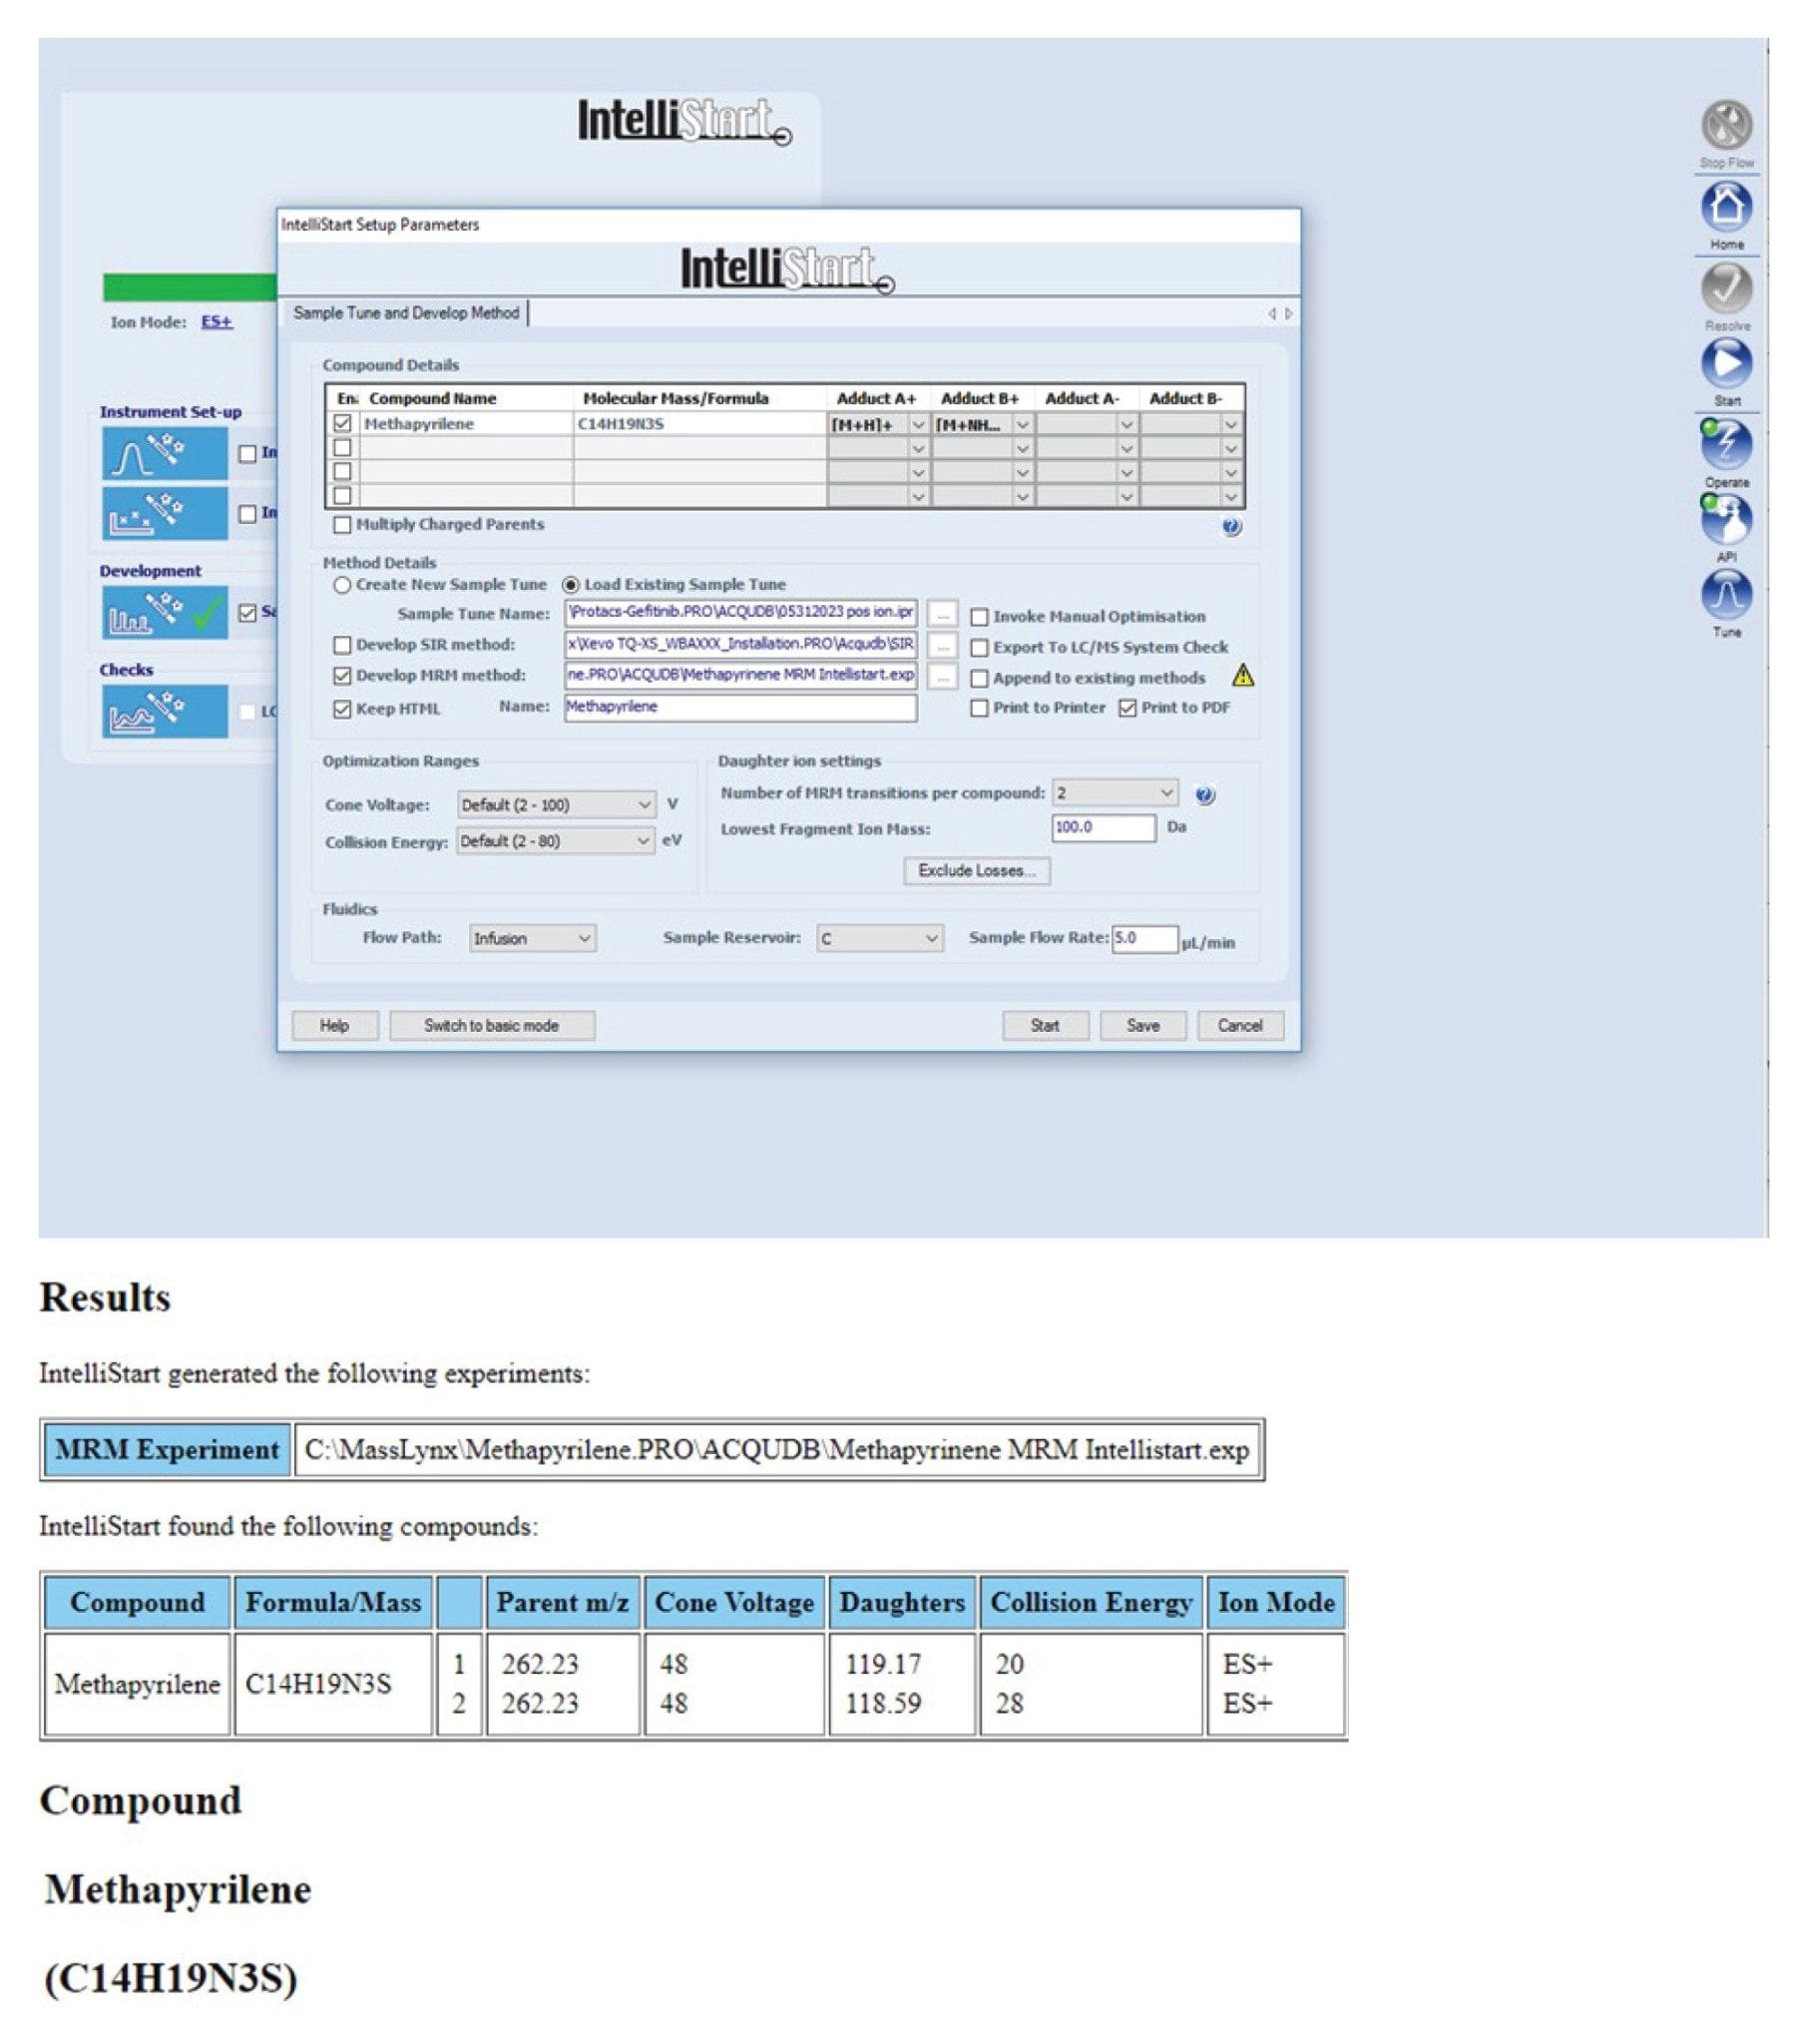
A 100 ng/mL solution of methapyrilene in 50:50 methanol:Water (0.1% formic acid) was infused into the Xevo TQ-XS Mass Spectrometer at a flow rate of 5 µL/min using the on-board fluidics of the instrument. A desolvation temperature of 300 °C was employed with a desolvation gas (nitrogen) flow rate of 500 L/h. The Intellistart Software was provided with the elemental composition of methapyrilene, C14H19N3S, and the conditions optimized over the cone voltage range of 2–100 V, and the collision energy over the range of 2–80 eV, Figure 2. The lowest limit for fragment mass was set at m/z=100. The signal response was evaluated in both positive and negative ion modes. The results obtained identified the most sensitive and specific parameters to be the positive ion transition m/z=262.2→119.2, employing a collision energy of 20 eV and cone voltage of 48 V. As is typical for the TQ-XS cone voltage profile was essentially flat between 15 and 50 V and thus cone voltage of 30 V was employed for the assay, Figure 2.
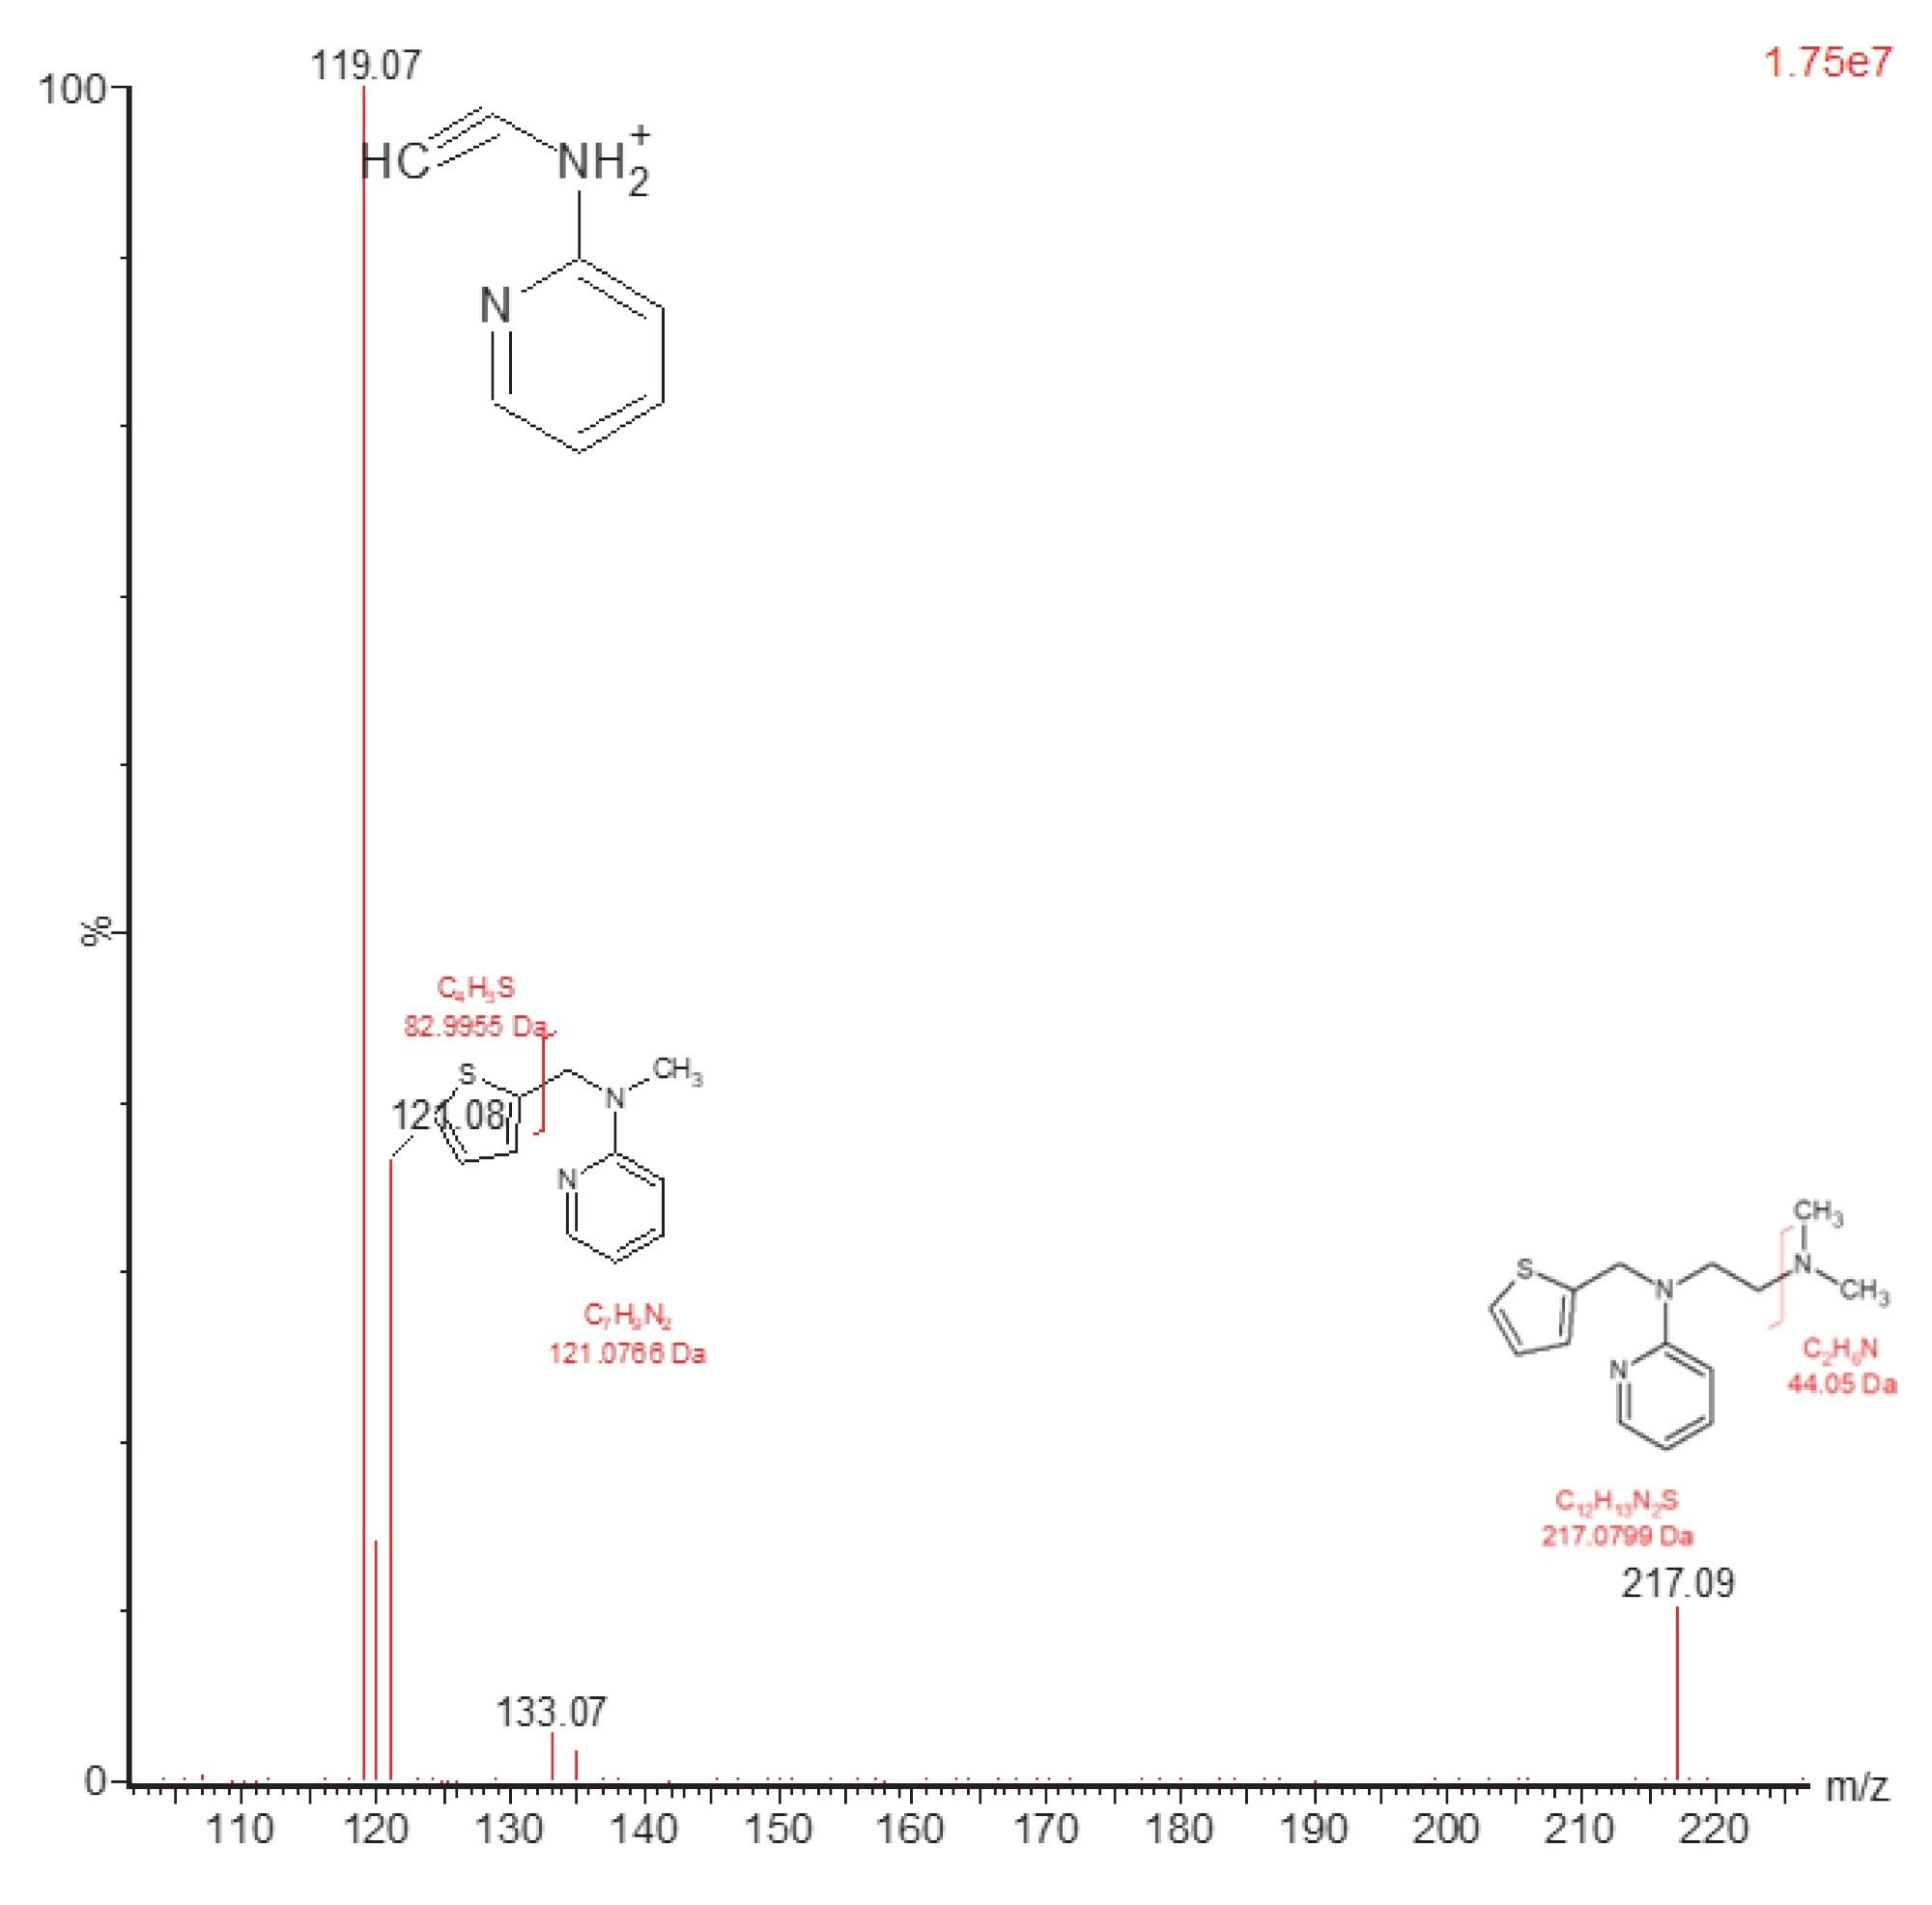
The fragment ion m/z=119.17 was selected by Intellistart as the most sensitive product ion. The data shown below in Figure 3 illustrates that fragmentation pattern of methapyrilene (m/z=262.2) in positive ion using a collision energy of 30 eV.
Fragmentation of the methapyrilene molecule gives rise to three major ions m/z=217.09, 121.08, and 119.07 with the m/z=119.2 being the most intense, verifying the Intellistart fragment optimization. This ion can be rationalized as the loss of the thiophene ring and loss of the aliphatic tertiary amine chain from the methapyrilene molecule.
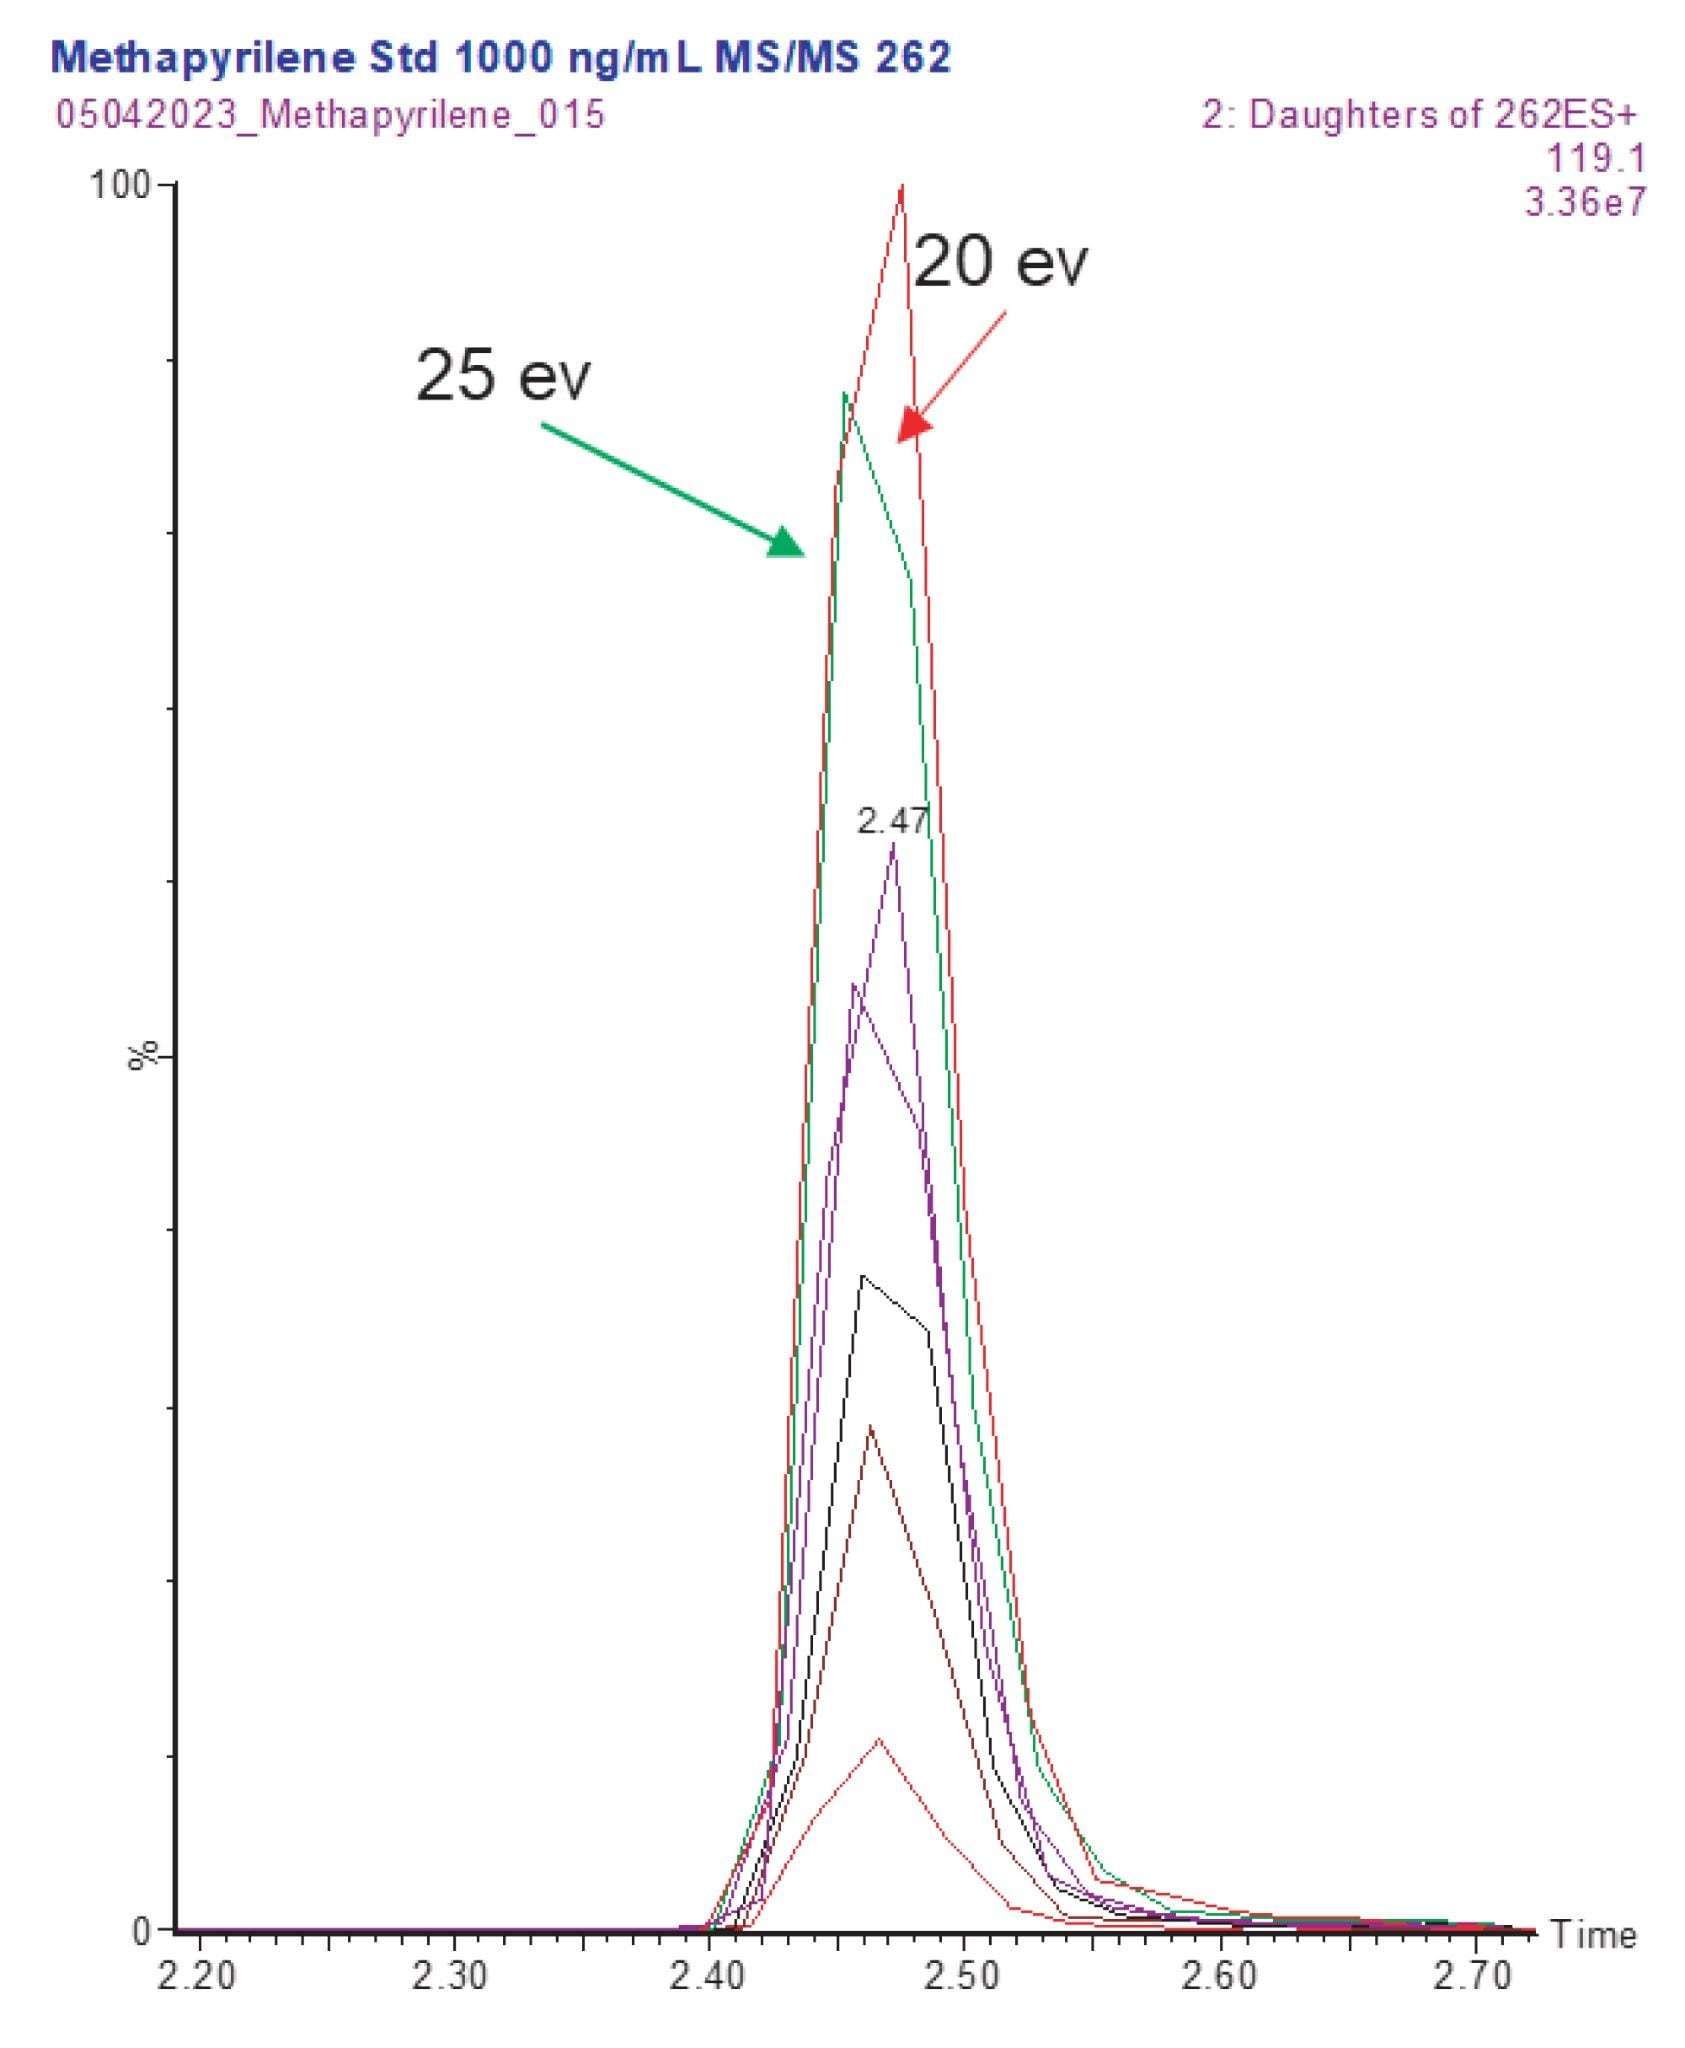
The optimized parameters produced by Intellistart showed that the most sensitive transition (262.2→119.2) was produced using the collision energy of 20 eV. The collision energy optimization results were confirmed by manual evaluation of the peak response for methapyrilene using the reversed–phase gradient chromatographic separation (analysis over ten minutes) and collision energy range of 5–50 eV, Figure 4.
The final LC-MS/MS for the quantification of methapyrilene in plasma employed a 2 µL injection of extracted sample onto a 2.1 x 50 mm CORTECS C18 2.7 µm Column, eluted 5–40% aqueous formic acid (0.1%), acetonitrile (containing formic acid 0.1%) over 2.5 min. The column effluent was monitored by positive ion ESi operated in MRM mode using the transition 262.2→119.2 with a cone voltage of 30 V and a collision energy of 20 eV.
Bioanalytical Method
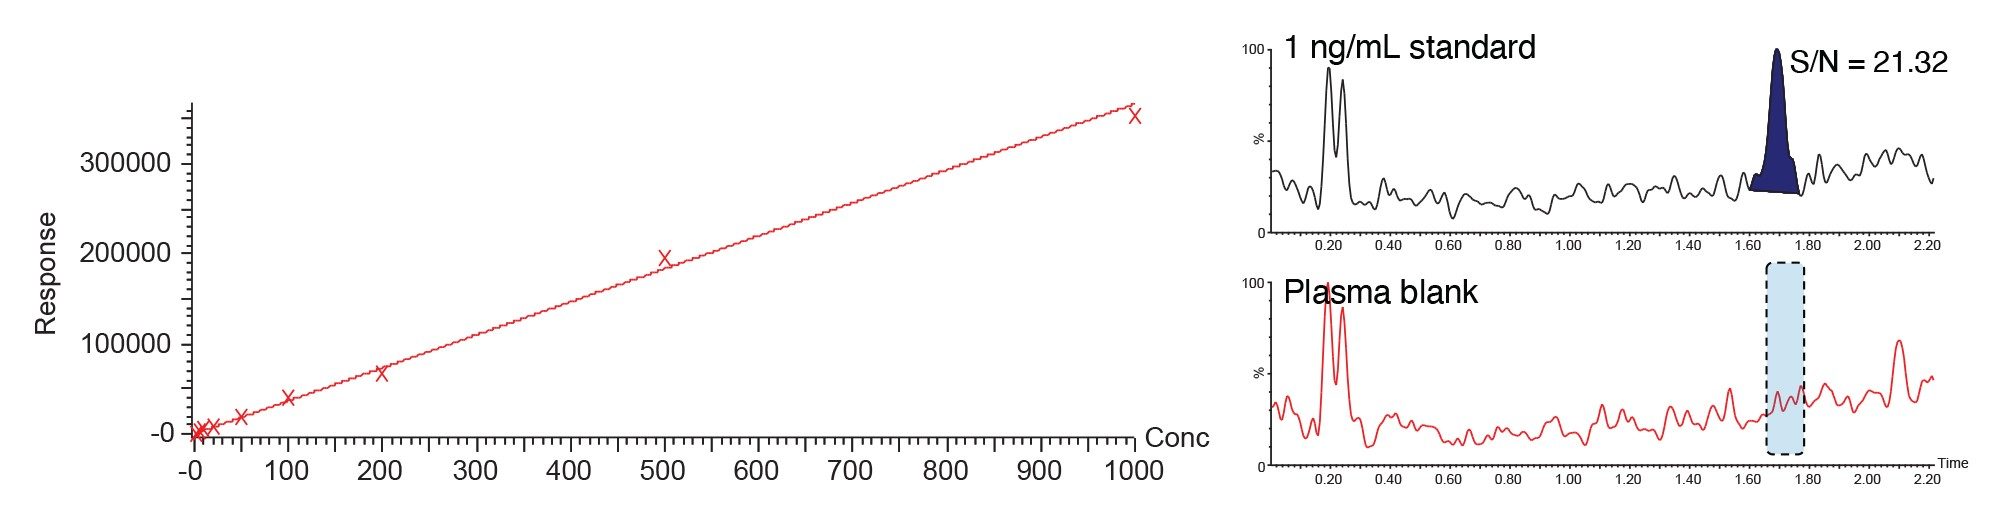
Selecting the analytical concentration range depends on the DMPK study needs, assays should always be fit for purpose, and it is worth remembering that the highest sensitivity assays may not always be needed. The dynamic range of the assay should be considered as part of the method development process and be matched with the expected sample concentration envelope. For a compound which is well absorbed and distributed in typical drug discovery rodent study with a dose of 10 mg/Kg, a peak drug concentration of 1–7 µg/mL would be expected.5 In this study the animals received a daily oral dose (PO) of 50 or 150 mg/Kg, thus we expected a concentration range of 5–10 µg/mL in the sample, therefore it was not necessary to develop a very high sensitivity assay, and an assay range of 1–1000 ng/mL was selected, which was well within the quantitative capabilities of the instrumentation. The plasma and urine samples were prepared by simple protein precipitation with acetonitrile (2:1 acetonitrile:sample). The resulting extracts were analysed on a 2.1 x 50 mm CORTECS 2.7 µm, Column operated in reversed–phase mode and eluted with a linear gradient of 5–40% aqueous formic acid (0.1%)–95% acetonitrile:water (containing 0.1% formic acid) over 2.5 min at 600 µL/min. Methapyriline was observed to elute with a retention time of tR = 1.69 min. Figure 5 illustrates the calibration line obtained for the quantification of methapyrilene in rat plasma over the calibration range of 1–1000 ng/mL using 1/x weighting. The correlation coefficient was determined to be 0.9986 with an intercept of 8.59, using external standard analysis. The inset chromatograms, Figure 5, show the peak response for the 1 ng/mL and the control blank plasma sample. As can be seen from these sample there is no significant interference observed between the blank sample and 1 ng/mL sample.
Carryover Assessment
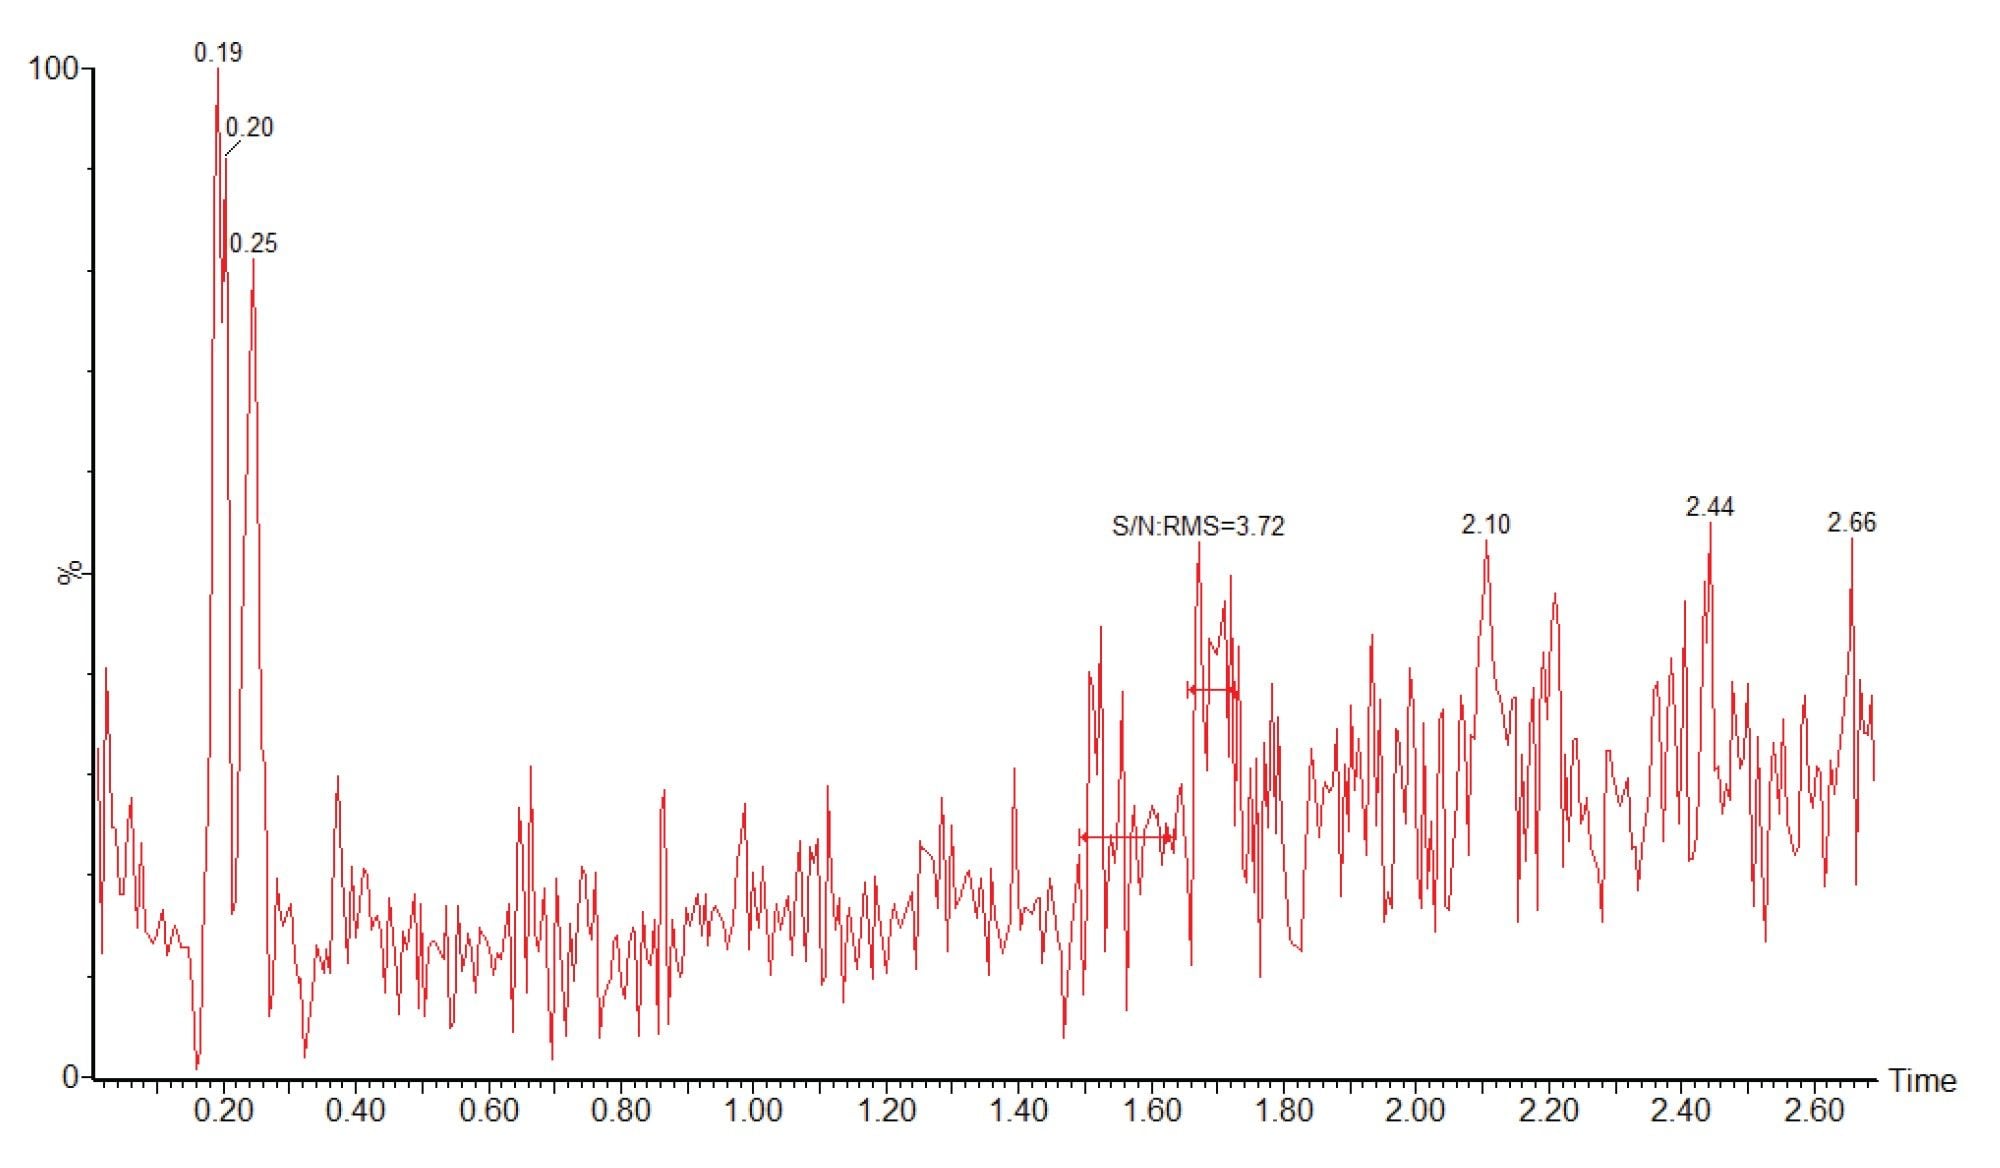
For accurate, reliable sample quantification it is important to ensure that there is no cross contamination or analyte carryover from the previous sample in the analytical batch. To evaluate this a plasma blank sample was analysed directly following the injection analysis of the 1000 ng/mL calibration standard. The peak area obtained from the plasma blank following the 1000 ng/ml standard is given in Figure 6. The data shows that the blank plasma sample produced a S/N value of 3.51 which can be compared to the 1 ng/ml standard (Figure 5) which produced a peak, tR=1.69 min, with a signal-to-noise (S/N) value of 21.3. Thus confirming there was no significant carryover for methapyrilene, for the assay.
Assay Validation
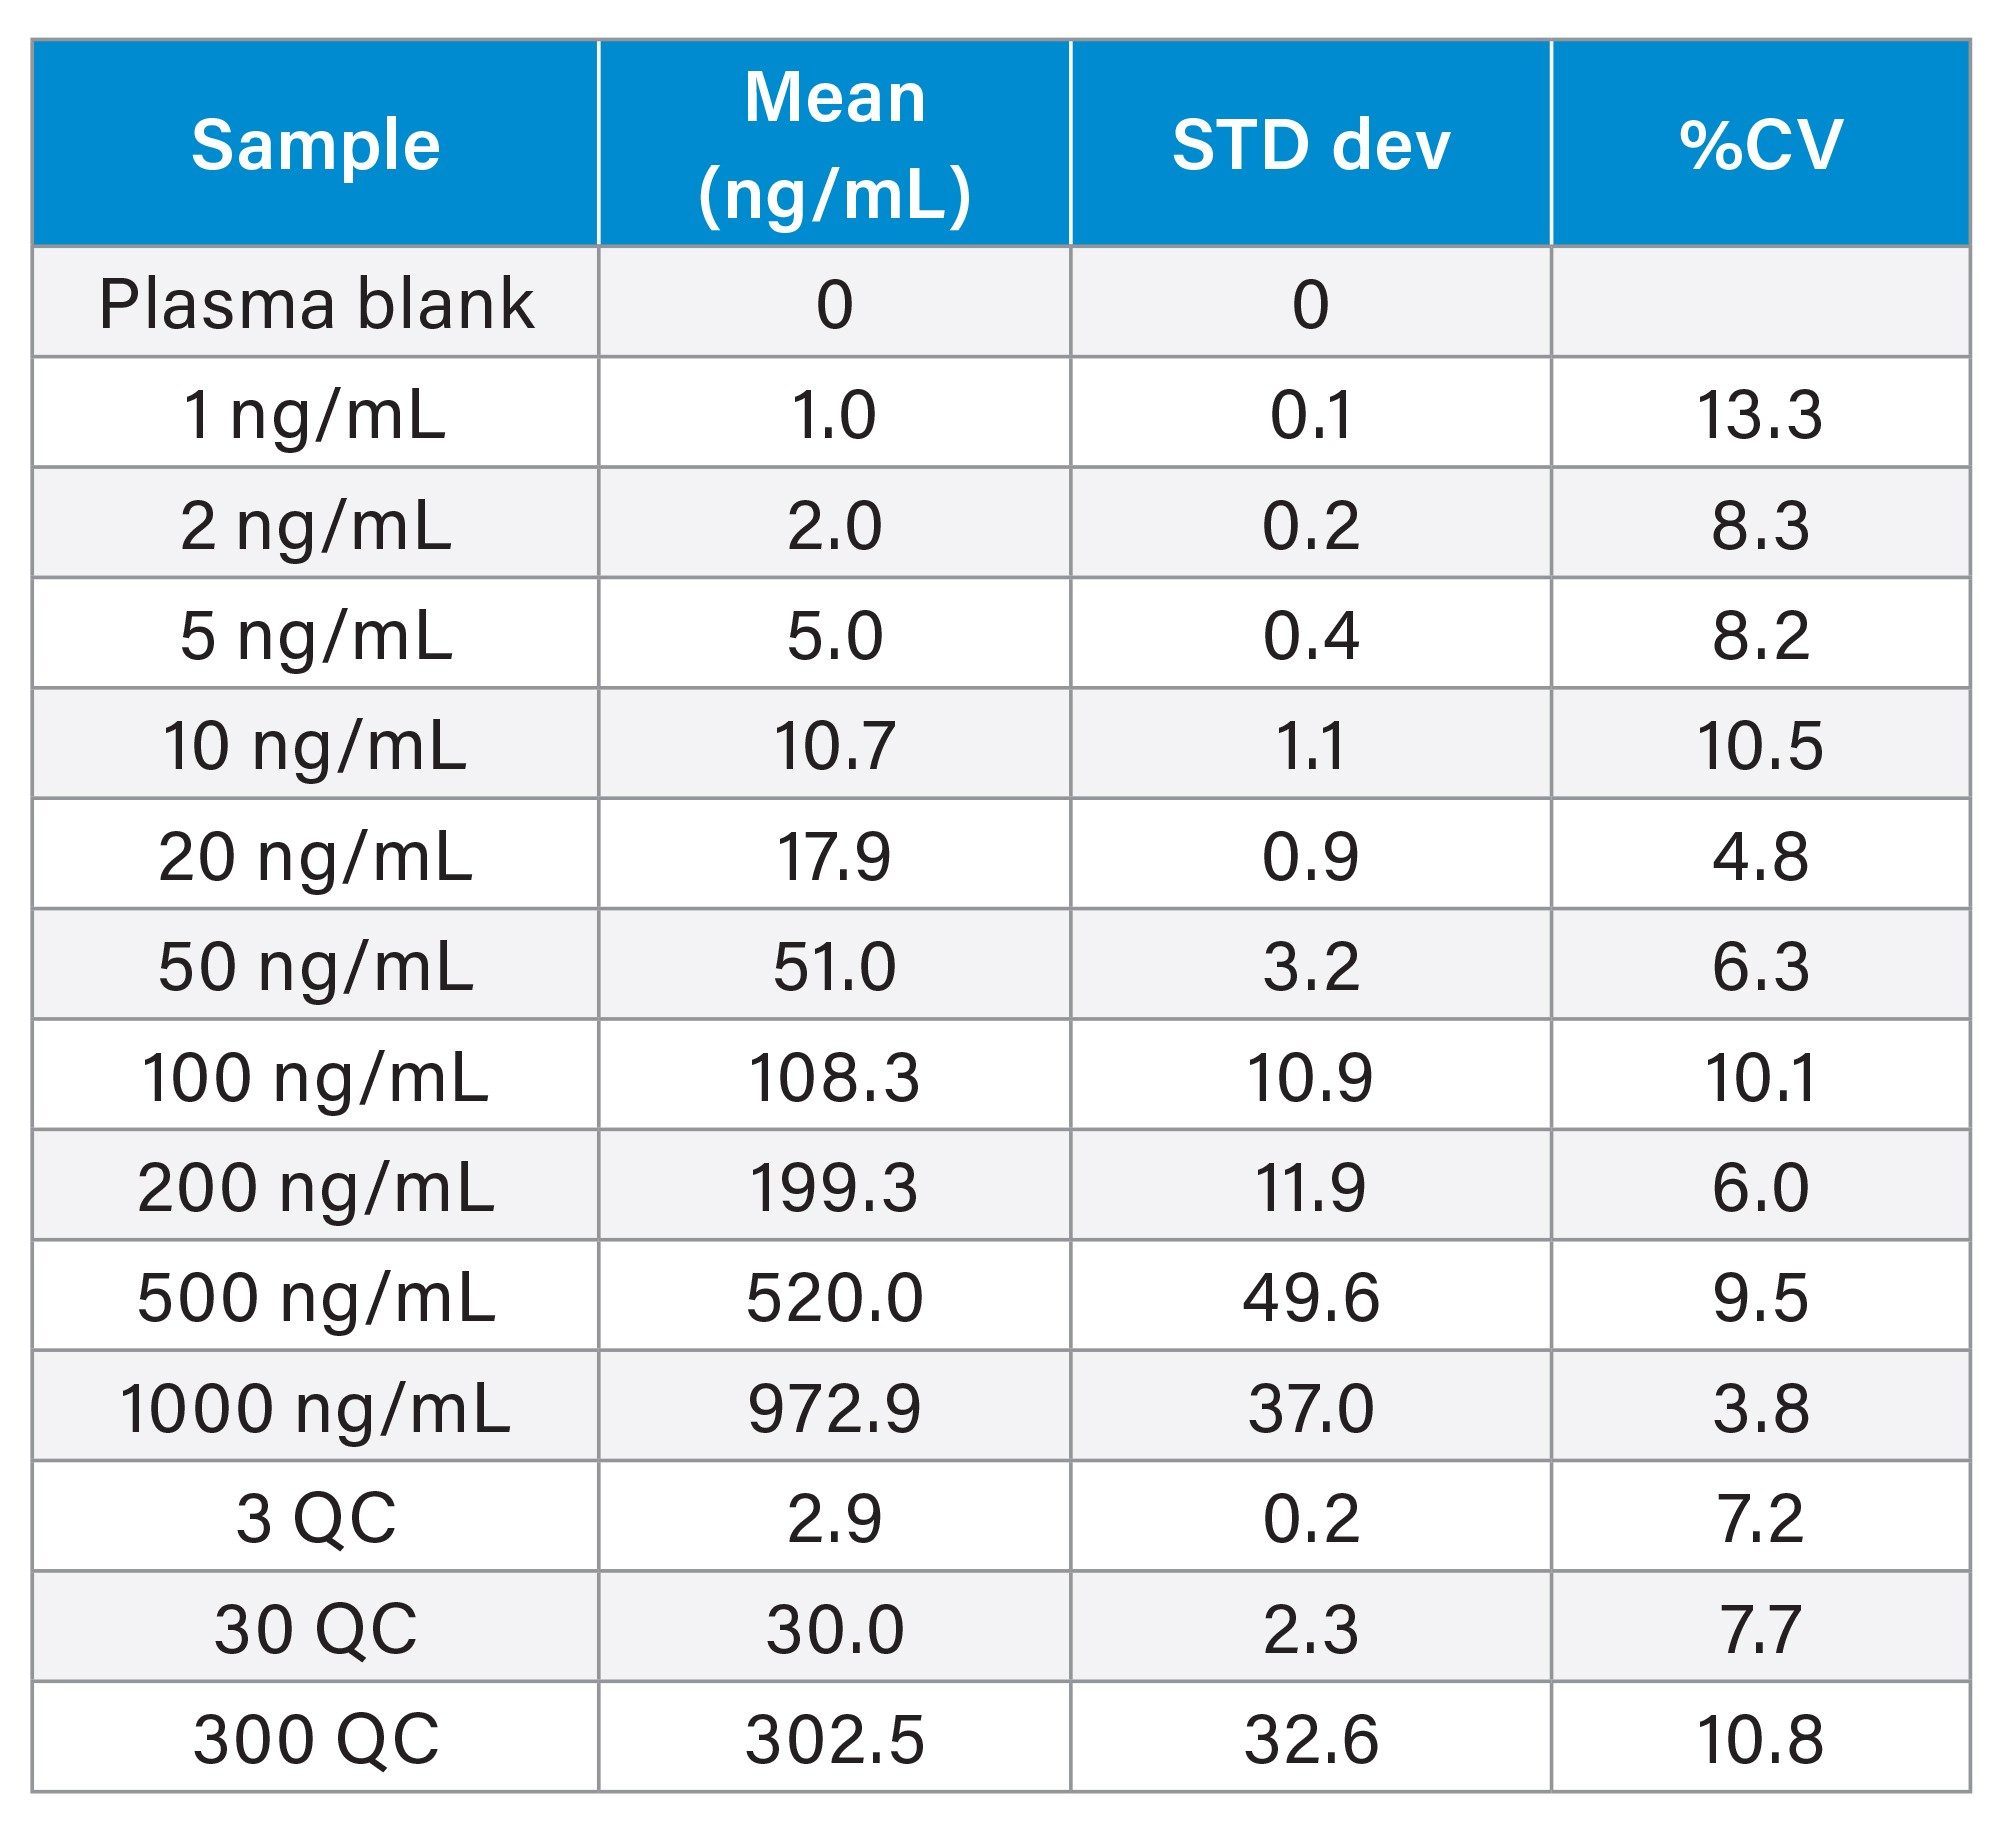
The methapyrilene rat plasma assay was subjected to a three day validation study to determine, limit of detection, precision, accuracy, stability, and reproducibility as described by FDA Bioanalytical Method Validation Guidance for Industry 2018.6 Each analytical batch consisted of a calibration line followed by six replicates of each QC followed by a second calibration line (extracted separately). The batch size was increased to 96 samples by the analysis of blank plasma extracts evenly spaced within the QC samples prior to the final calibration line. The inter day precision showed that the coefficient of variation ranged from 3.8–13.3% (1000 and 1 ng/mL standards respectively) the QC precision ranged from 7.2–10.8%, Table 3. Similar results were obtained from the validation of the assay in rat urine. All data meeting acceptability criteria for FDA criteria for the validation of bioanalytical methods
Monitoring Matrix Background
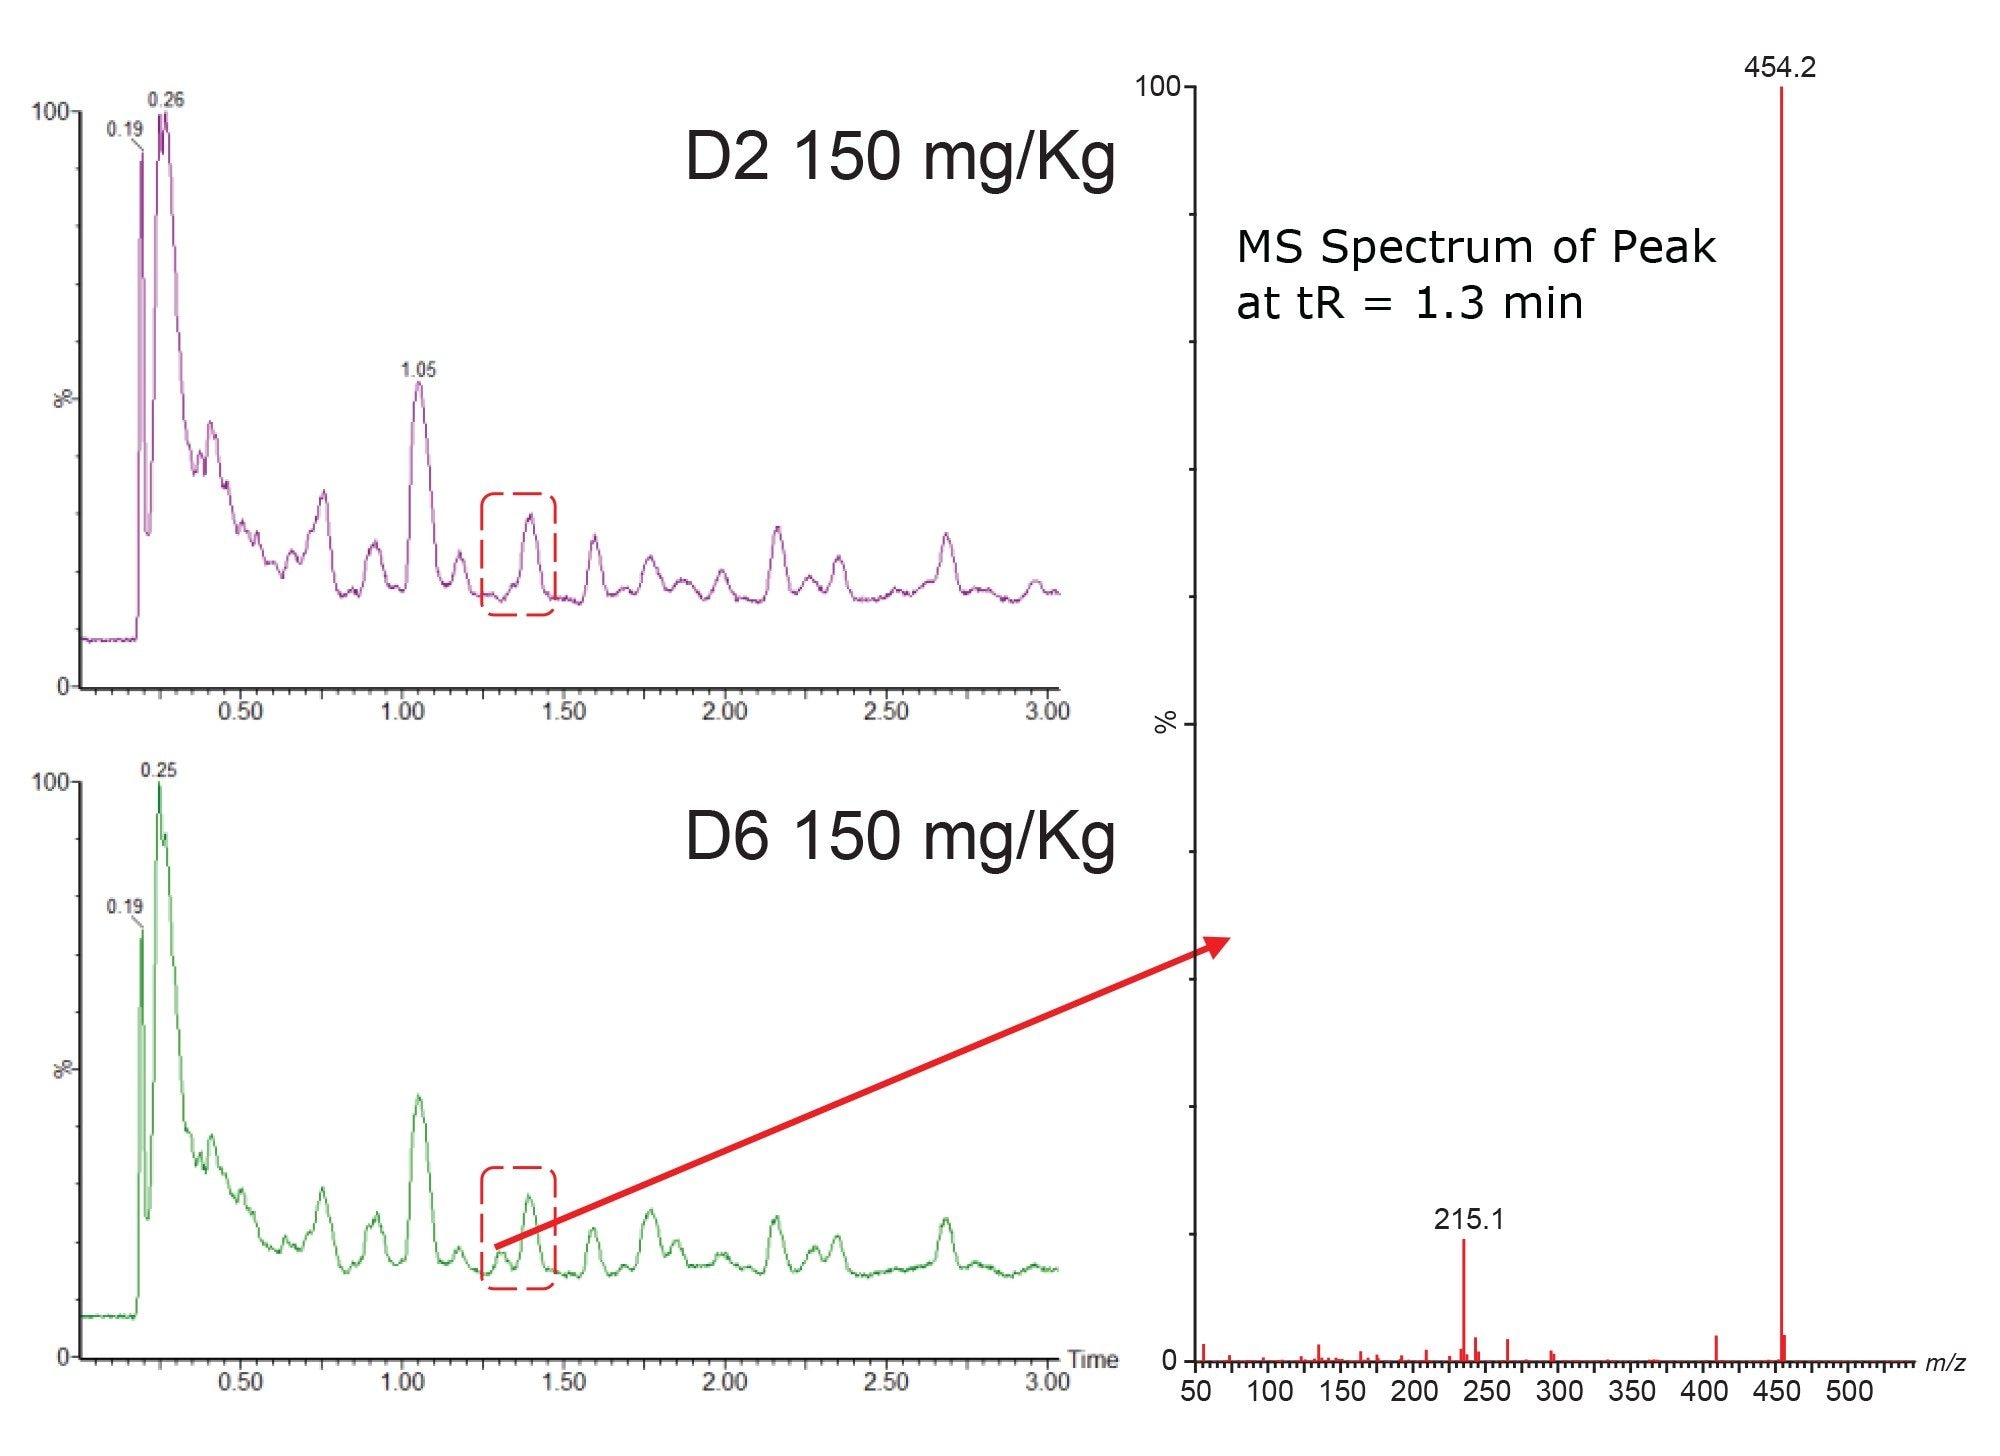
In animal studies the matrix background signal can vary significantly between species, gender, strain, diet, and age and can also be impacted by changes in the dosing vehicle. In the randomized human clinical trials (phase I-III) the matrix background signal can be effected by factors such as age (paediatric, geriatric), gender, health, and co-administered therapies, as well as diet, and ethnicity. Understanding how the variation in matrix background signal impacts LC-MS/MS method robustness, reliability, and accuracy are critical to wider method deployment. Waters Xevo range of tandem mass spectrometers are equipped with RADAR technology, which takes advantage of the innovative T-Wave™ collision cell design to rapidly switch between MRM (MS/MS) mode and MS full scan acquisition. This allows for the simultaneous acquisition of MRM and full scan data without detrimentally effecting the number of points across the chromatographic peak and maintaining the sensitivity of the assay, Figure 7. The positive ion full scan LC-MS RADAR data obtained from the analysis of urine samples on D2 and D6 are shown below in Figure 8. As can be seen from this data there is an additional peak in the D6 sample at tR=1.3 min (highlighted in red box) which is absent in the D2 sample. The RADAR derived MS spectrum of this feature produced a base peak of m/z=454.2 with a smaller, presumably fragment, peak at m/z=235.2. This is consistent with the spectrum produced by an O-glucuronide metabolite of methapyrilene. As the retention time is significantly different to that of methapyrilene this new peak was deemed to have no impact the accuracy of the results obtained from the analysis of methapyrilene in urine. This As well as, as in this case, providing some tentative indication about possible major metabolites forming in vivo on oral dosing, the RADAR approach can also be used to monitor background signal during method development as well as monitoring samples during routine batch analysis.

Conclusion
LC-MS/MS provides high sensitivity methodologies for the quantification of drugs and their metabolites in biological fluids. A simple robust MRM assay for the quantification of methapyrilene in rat plasma and urine was developed and validated. Intellistart Software was used to rapidly optimize the precursor ion, product ion, cone voltage and collision energy for the analysis of methapyrilene in rodent plasma and urine. The assay was validated in plasma and urine, using a three day protocol, over the calibration range of 1–1000 ng/mL. The method showed acceptable precision and reproducibility.
RADAR allows the simultaneous acquisition of full scan data and MRM data to monitor background signals for efficient method development, troubleshooting and clinical trial sample analysis without detriment to the quality of the quantitative MRM data. RADAR technology also facilitates the detection of other components, such as potential major metabolites which can help inform future preclinical and clinical studies.
References
- Thakur A, Tan Z, Kameyama T, El-Khateeb E, Nagpal S, Malone S, Jamwal R, Nwabufo CK. Bioanalytical Strategies in Drug Discovery and Development. Drug Metab Rev. 2021;53(3):434–458. doi: 10.1080/03602532.2021.1959606. Epub 2021 Aug 23. PMID: 34310243.
- Duggan JX. Quantification Below the LLOQ in Regulated LC-MS/MS Assays: A Review of Bioanalytical Considerations and Cautions. Bioanalysis. 2019 Apr;11(8):797-814. doi: 10.4155/bio-2018-0261.
- Robert S. Plumb. Tandem Quadrupole Acquisition Modes in DMPK Studies, Waters application note. 720008016, September 2023.
- Graichen ME, Neptun DA, Dent JG, Popp JA, and Leonard TB (1985) Effects of Methapyrilene on Rat Hepatic Xenobiotic Metabolizing Enzymes and Liver Morphology. Fundam Appl Toxicol 5:165–174.
- Molloy B, Mullin L, King A, Gethings LA, Plumb RS, Wilson ID. The Pharmacometabodynamics of Gefitinib after Intravenous Administration to Mice: A Preliminary UPLC-IM-MS Study. Metabolites. 2021 11;11(6):379. doi: 10.3390/metabo11060379.
- Bioanalytical Method Validation Guidance for Industry, 2018. https://www.fda.gov/regulatory-information/search-fda-guidance-documents/bioanalytical-method-validation-guidance-industry.
720008082, November 2023