Pushing the Boundaries of DESI Imaging With High Spatial Resolution
Abstract
Utilizing a commercial DESI™ XS source with minor adjustments, here we demonstrate acquisition of DESI tissue images with pixel sizes of 5 µm. Images show improved fidelity over those acquired with larger pixel sizes. Coupling high spatial resolution DESI XS imaging with the Microscope Mode released with High Definition Imaging (HDI™) Software v1.8 improves both speed and quality of DESI XS imaging applications.
Benefits
- Demonstrating a QTof platform offering superior sensitivity for DESI XS imaging analysis, and enabling faster scan speeds
- Providing a commercially available DESI XS set-up which allows imaging acquisitions down to a pixel size of 5 µm
- A novel software acquisition mode, Microscope mode, within High Definition Imaging (HDI) Software v1.8 enables a non-destructive imaging survey scan to be performed, allowing user selection of sub-regions of interest for higher resolution re-acquisition
Introduction
Desorption electrospray ionization (DESI) is an established ambient ionization imaging technique, allowing the mass spectrometry imaging of surfaces with minimal sample preparation and without the requirement for application of matrices.
As with all imaging techniques there is a continual drive towards smaller pixel sizes resulting in a higher image resolution. Here we demonstrate a low flow DESI technique for high image resolution achieved on a commercially available DESI XS source. Conventional DESI is typically performed at flow rates of 0.5–2 µL/min, Low flow DESI described here employs flow rates of <500 nL.
With the push to smaller pixel sizes the time to acquire data grows exponentially. Even with high acquisition rates of 10–20 pixels/sec the time required to analyse whole tissue sections becomes unsustainable. To help alleviate this problem we introduce a time saving, data driven re-acquisition technique which allows detailed high-resolution images to be acquired, following quick low resolution initial passes/survey scans.
Experimental
A small piece of porcine liver and a murine brain was sectioned at 18 µm onto glass microscope slides.
These sections were analysed with no further treatment on a Xevo™ G3 QTof MS coupled to a DESI XS source, equipped with a high-performance sprayer and heated transfer line. The solvent for the DESI sprayer was supplied by an ACQUITY™ M-Class µBSM. To maintain back pressure the solvent line was fitted with a 1.7 µm ACQUITY™ C18 Column, 45 µm I.D ZenFit™ capillary tubing was utilized to carry the solvent to the sprayer replacing the typical 150 µm I.D tubing.
MS Conditions
|
MS system: |
Xevo G3 Qtof MS |
|
Source type: |
DESI XS |
|
Cone voltage (V): |
60 |
|
Source temperature (°C): |
150 |
|
Acquisition range: |
50–1200 |
|
Analyzer mode: |
Sensitivity |
|
Experiment type: |
MS |
DESI Setup
|
Capillary voltage (V): |
0.6 |
|
Nitrogen flow (psi): |
19.5 |
|
Solvent: |
95% Methanol 5% Water |
|
Solvent flow rate: |
0.5–0.25 µL/min |
|
Heated transfer line temperature (°C): |
450 Negative mode, 200 Positive mode mode |
|
Pixel size: |
5–100 µm |
|
Equivalent scan speed Hz: |
10–20 scans per second |
Data Processing
MS data were manually assessed using MassLynx™ Software prior to being processed in High Definition Imaging (HDI) Software for image visualization and selection of regions of interest (ROI) for more detailed image acquisition.
Results and Discussion
Optimization of nano-flow DESI XS imaging requires the adjustment of three factors of conventional flow DESI. These are: solvent flow rate, nebulizing gas flow rate, and proximity of the sprayer nozzle to the tissue. Details of the optimized solvent flow rate and nebulizing gas flow rate are detailed in the experimental section above.
Decreasing the flow rate shortens the working distance of the sprayer, requiring the sprayer to be much closer to the tissue surface than with conventional flow DESI. The photograph seen within Figure 1A shows a visual example of the approximate distance between sprayer nozzle and the tissue. A schematic estimating the spray diameter with each flow rate and distance can be seen in Figure 1B. From this it can be estimated that when using the low‑flow DESI XS configuration the extraction area is likely to be <10 µm as a narrow spray diameter is maintained.
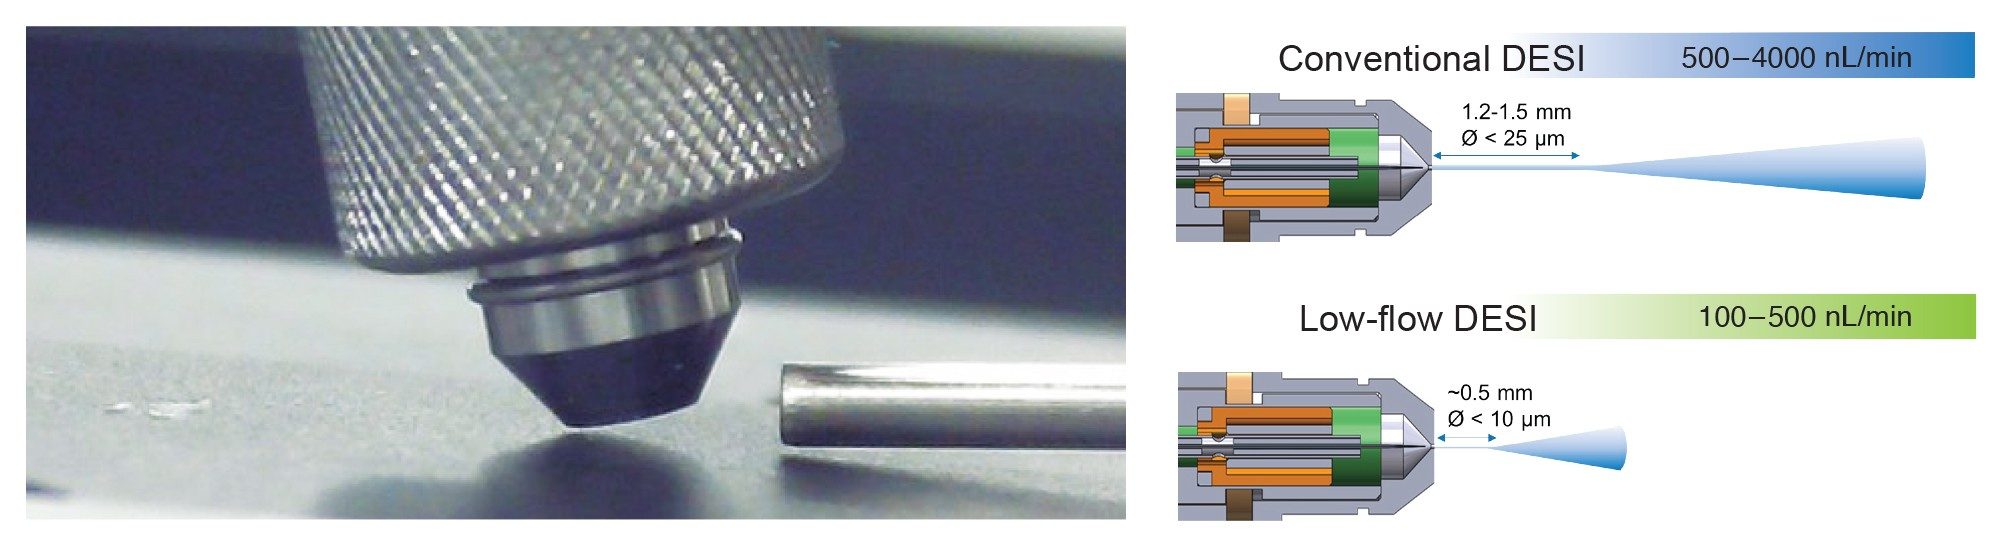 Figure 1. A) A photograph showing a typical low-flow DESI sprayer positioning in relation to tissue. B) Supporting schematic estimaing spray diameter with low flow rate and distance, compared to conventional DESI flow rates.
To achieve a stable flow, it was also observed that the back pressure for the M-Class ACQUITY BSM was required to be at least 300 psi. This can be achieved by placing a column (details which can be found in the experimental section) into the solvent line and reducing the internal diameter of the solvent delivery tubing.
To demonstrate improved image fidelity with the smaller pixel sizes, when using the low-flow DESI configuration Mass Spectrometry images were acquired with 50 µm, 20 µm, 10 µm, and 5 µm pixel sizes. This experiment was performed using both conventional flow DESI and low-flow DESI XS configurations. The results from this can be seen in Figure 2:
A) Showing the results from 500 nL/min flow DESI it can be determined that the image fidelity does not significantly improve between the 20 µm and 10 µm pixel size. It is also clear that the image quality of the 5 µm pixel size image is poor. This is likely due to the longer dwell time and spray diameter being much larger than the pixel size.
B) Showing the results from the 250 nL/min flow DESI it can be determined that the image fidelity appears to improve between the 10 µm and the 5 µm pixel sizes suggesting that the image resolution has increased with the decreasing pixel size.
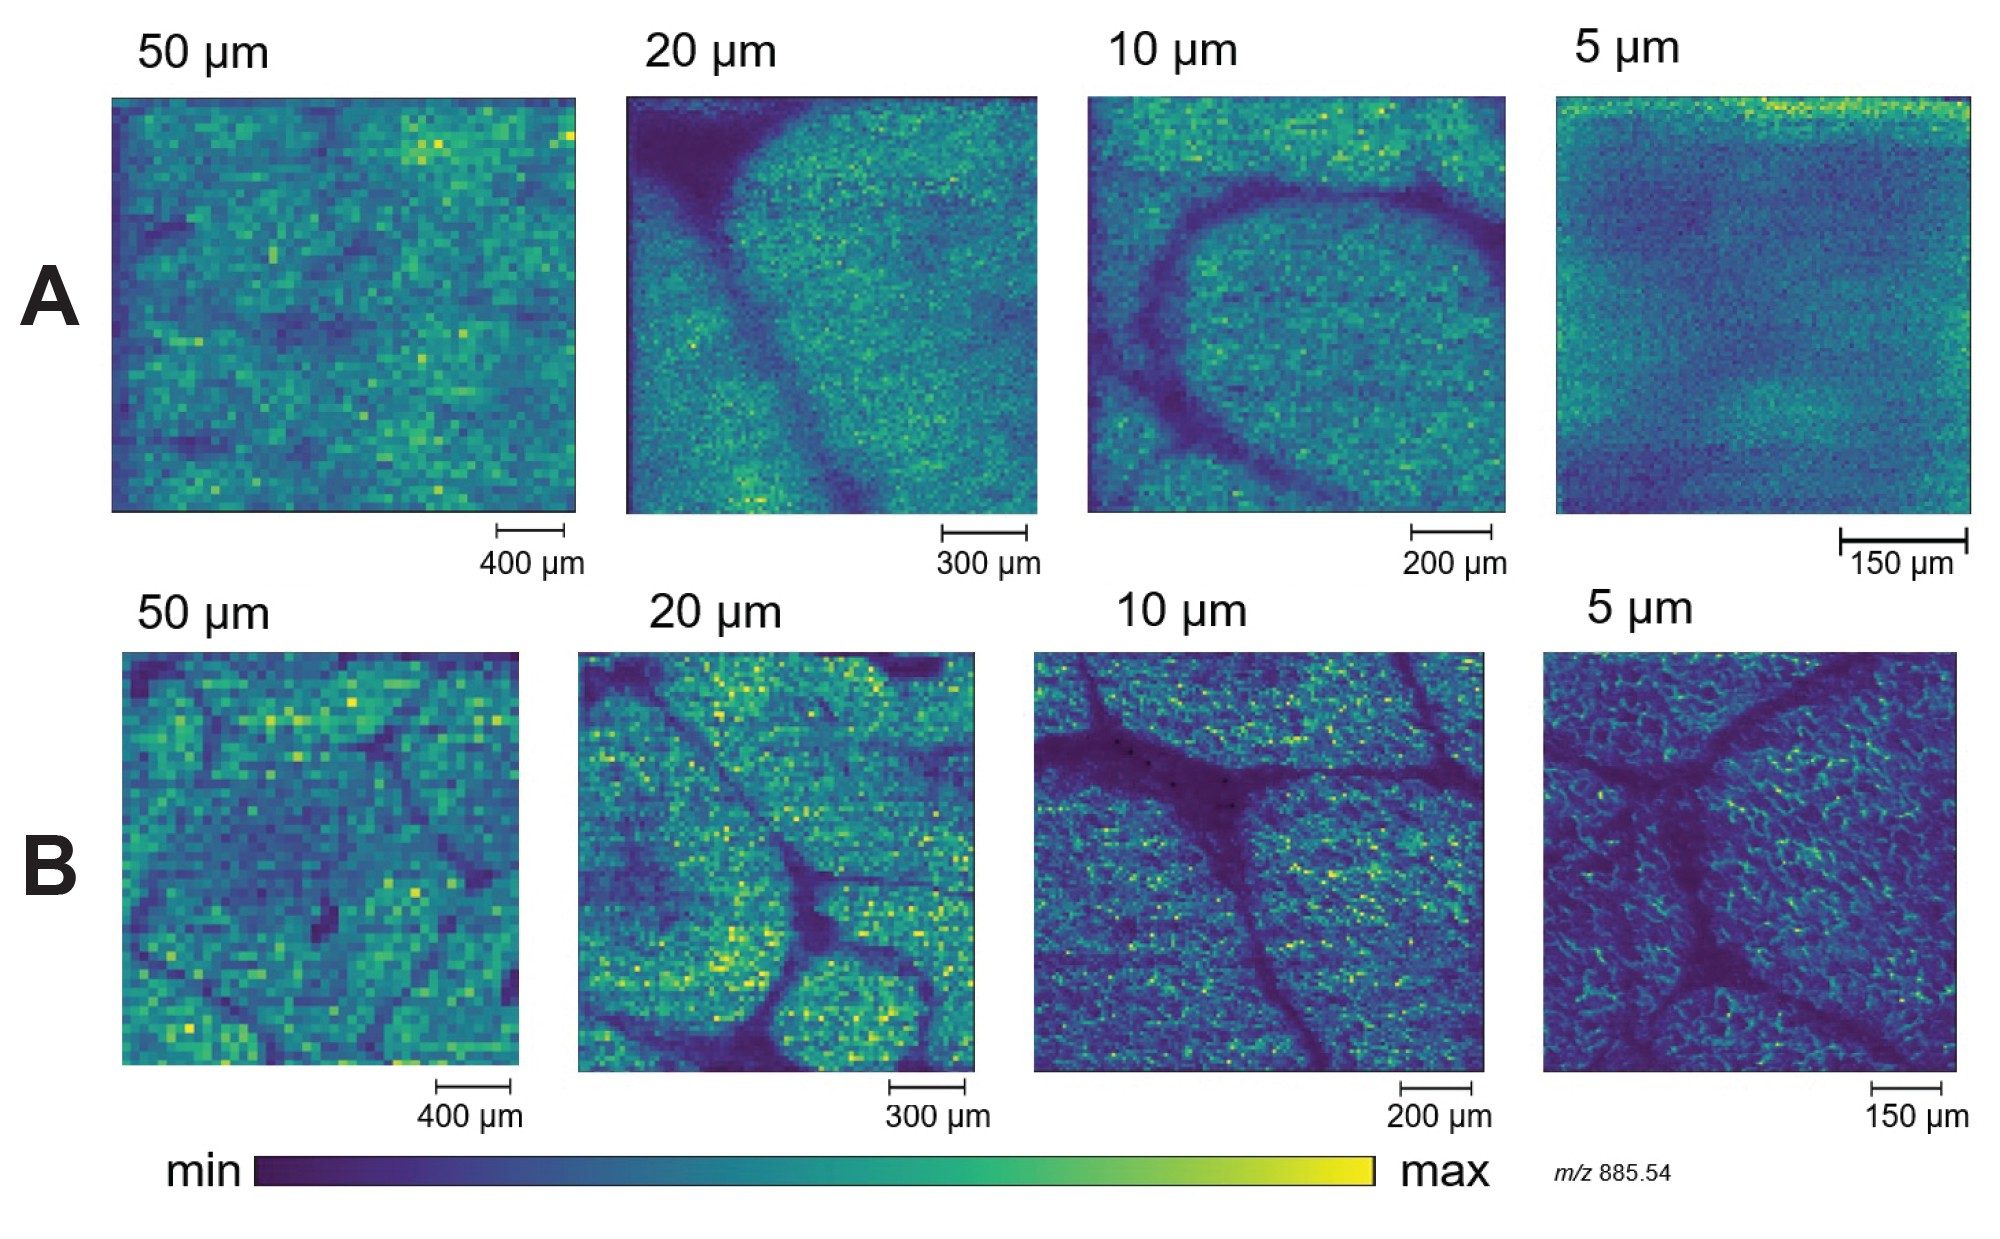 Figure 2. Showing image fidelity improvements with decreasing pixel size, A) with a low conventional flow DESI 500 nL/min and B) with low flow DESI 250nL/min. Images aquired at 10 Hz in negative ion mode (m/z 885.55 displayed).
With a decreasing pixel size, acquisition time for any image increases exponentially, resulting in single DESI acquisitions requiring multiple days for an entire tissue image. In order to mitigate this time restriction for low-flow/high image resolution DESI XS imaging an acquisition tool was developed within High Definition Imaging (HDI) Software v1.8. The new mode of analysis allows a survey scan can be initially acquired e.g. with a 100 µm pixel size, to give an overview of the tissue. Then the image produced by this survey scan can be used to select regions of the tissue where a more detailed image is desired (Figure 3).
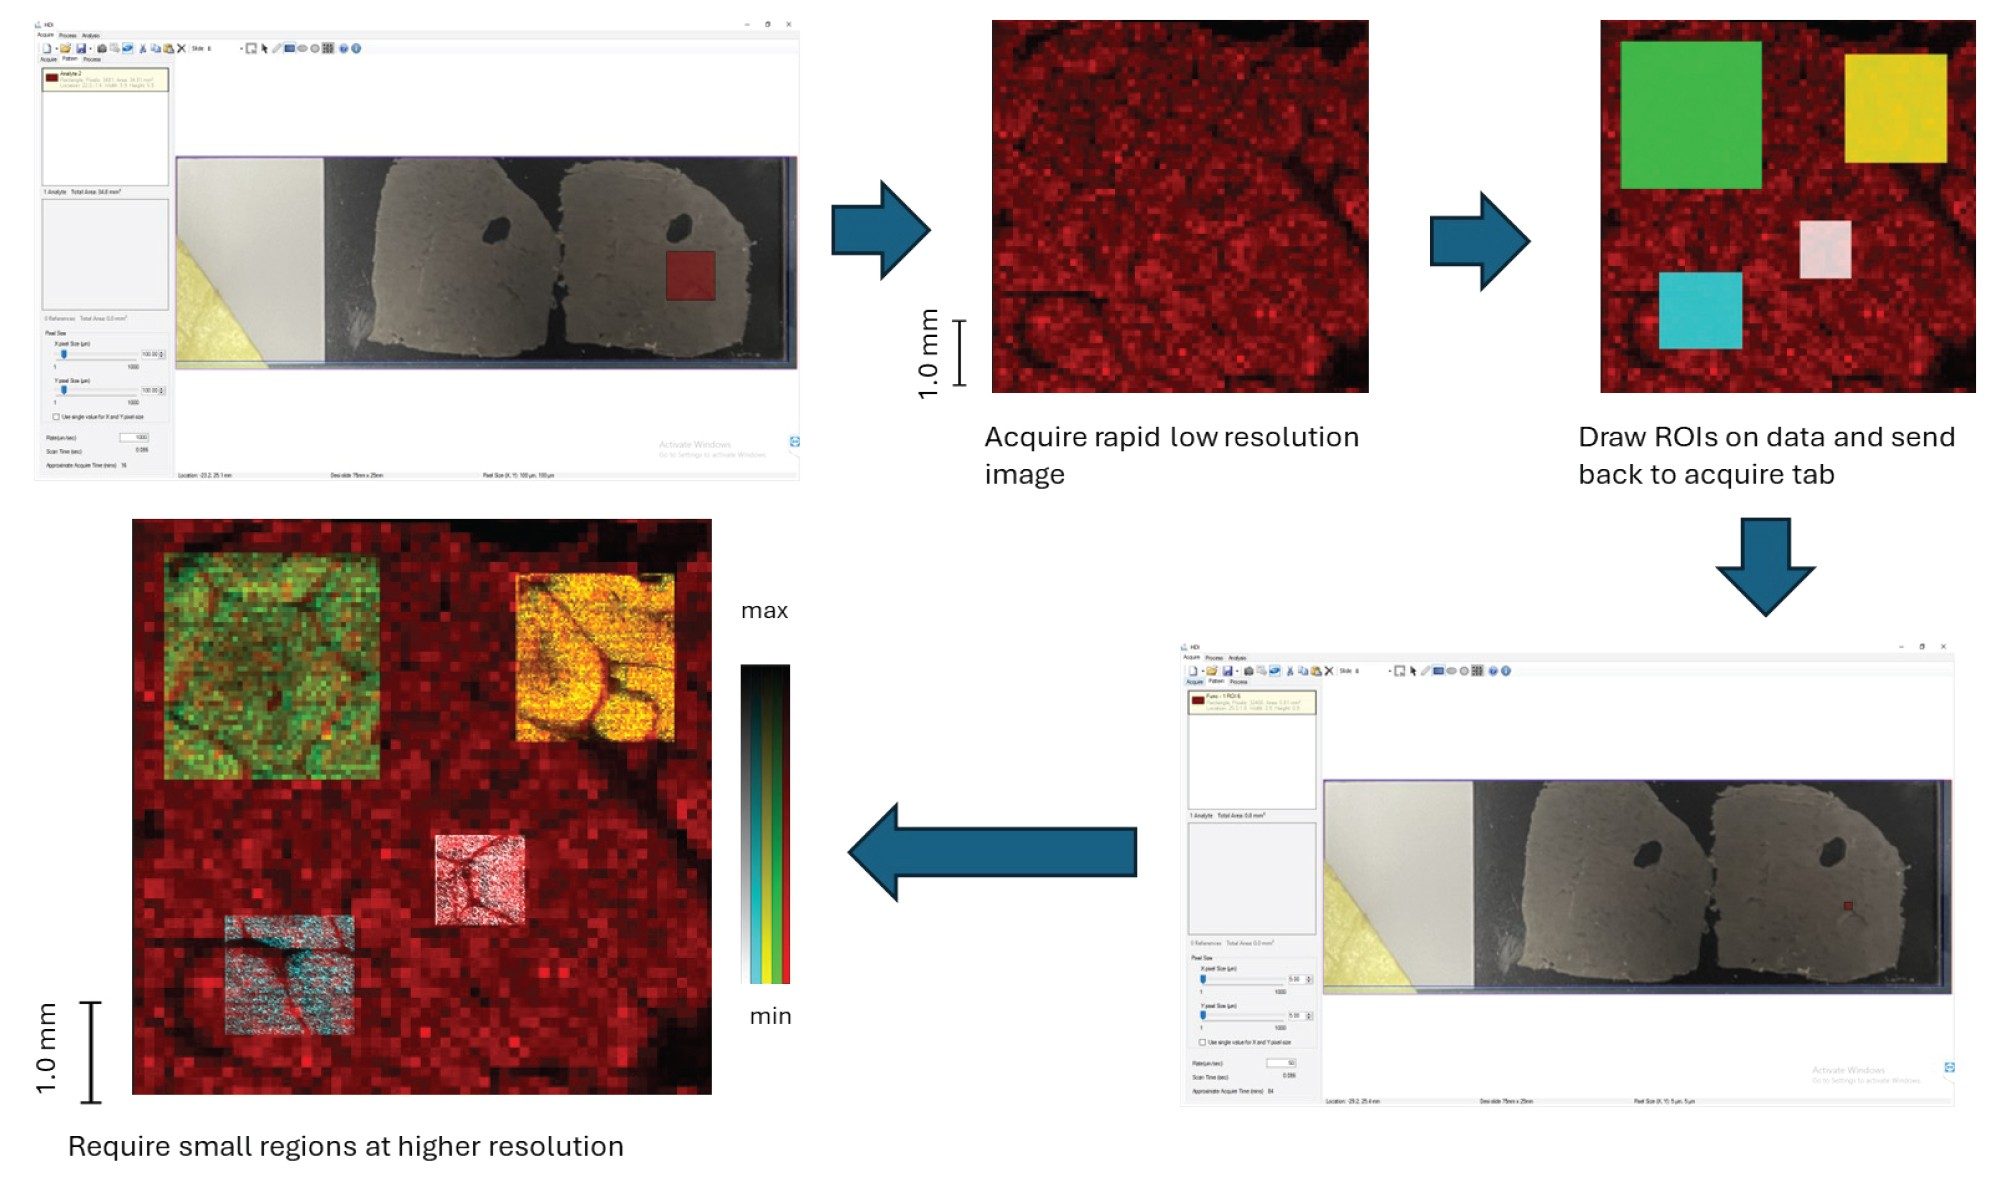 Figure 3. Microscope mode available within HDI v1.8. Survey scans at larger pixel size (e.g. 100 µm) are preformed then smaller targeted areas of tissue can be imaged at a smaller pixel size (50 µm green, 20 µm orange, 10 µm blue, 5 µm white shown here) to give higher spatial resolution, without needing to acquire the whole tissue at the smaller pixel size.
It can be demonstrated that there is no obvious changes to the tissue or the data acquired when a survey scan is performed prior to more detailed targeted analysis compared to a targeted analysis on fresh tissue (Figure 4). This is true for both the image quality, and also spectral intensity when an identical region of interest (ROI) is extracted from each of the two acquisitions. This is due to the non-destructive nature of DESI, particularly using the low-flow configuration.
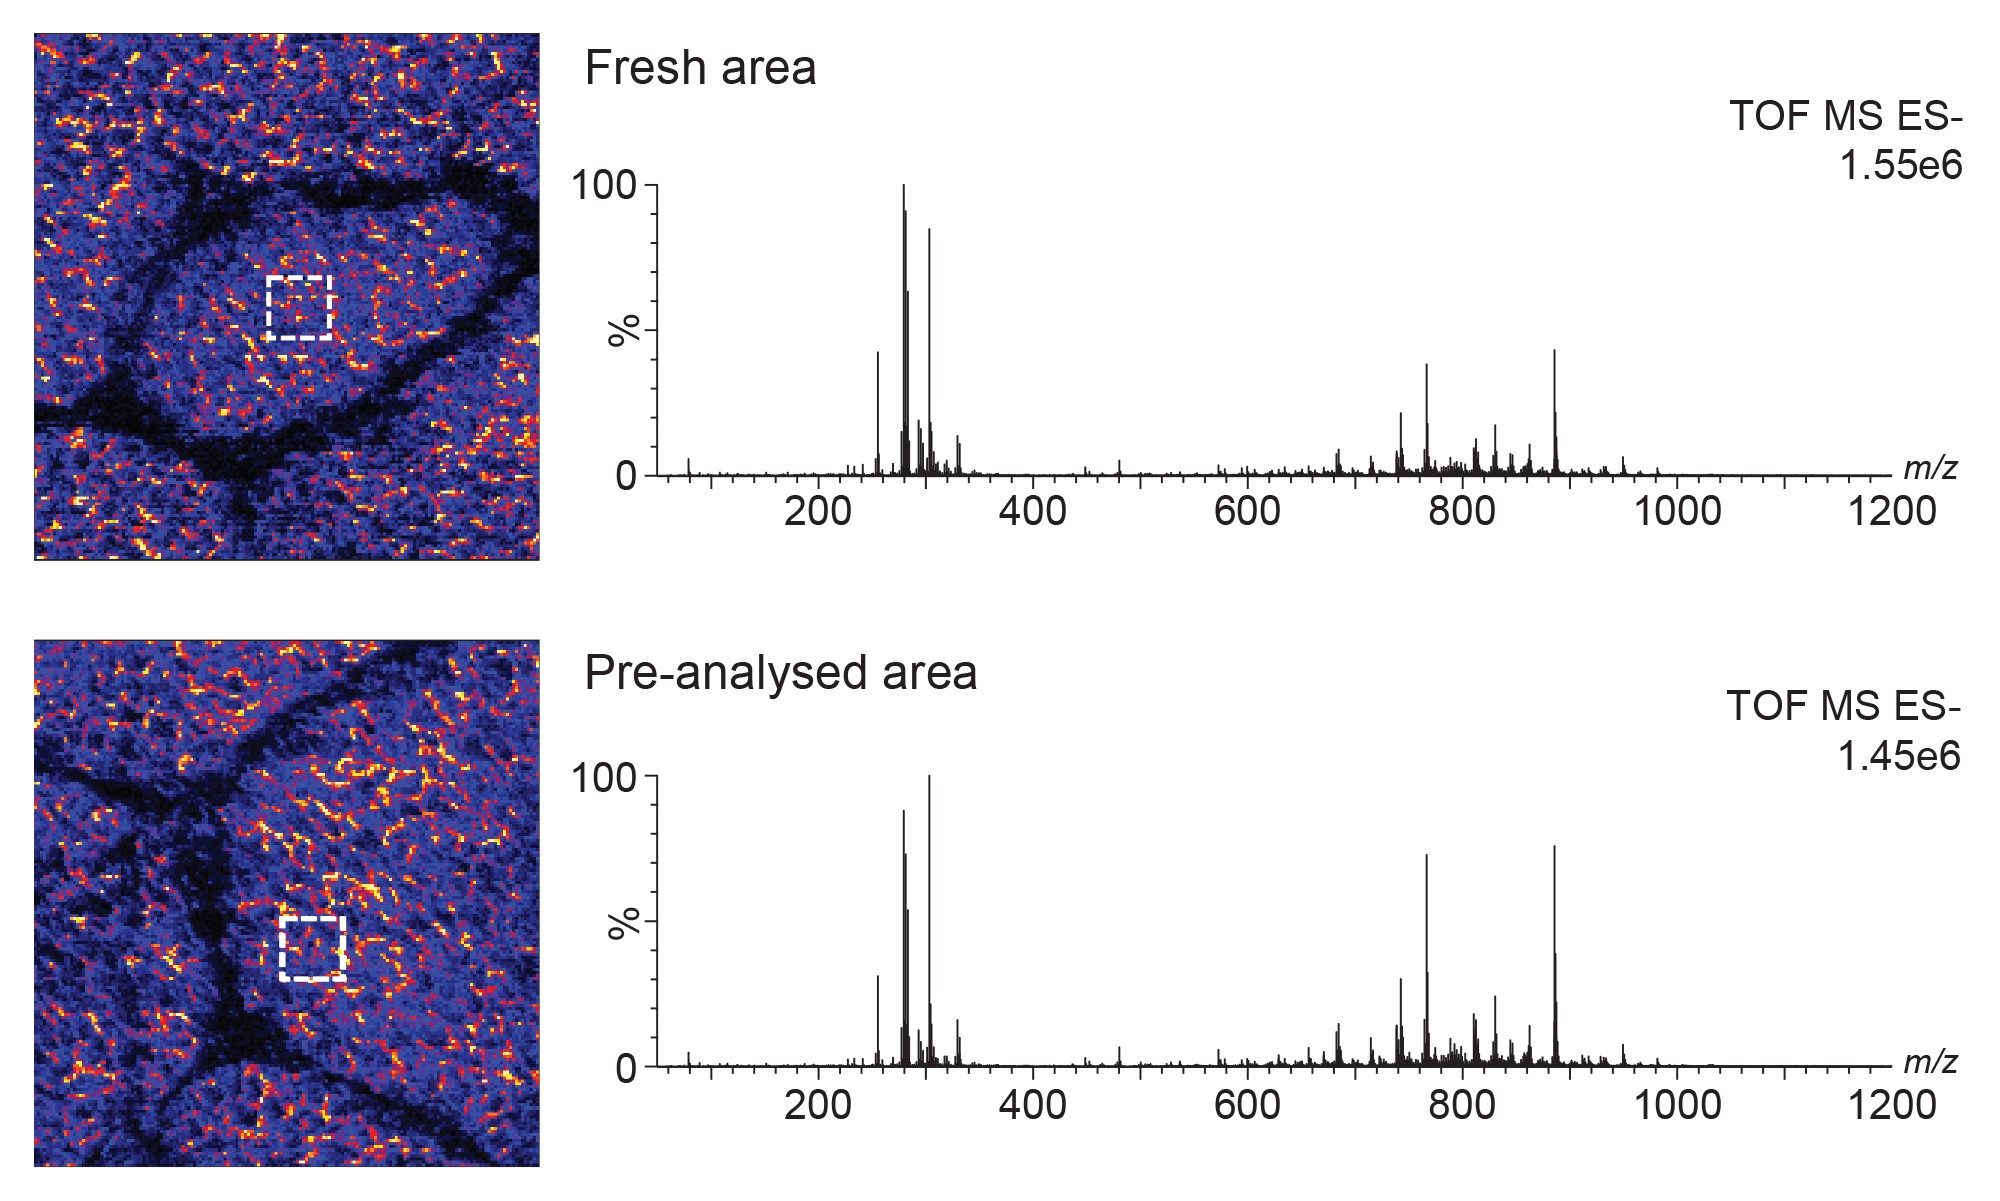 Figure 4. Example images of two 5 µm acquisitions, Top, from a fresh area of tissue and bottom from a pre-analysed area of tissue (a survey scan has been performed at 100 µm previously) acquired at 10 Hz in negative ion mode (m/z 885.55 displayed). A 20x20 pixel ROI extracted from the areas indicated (dotted box) for each analysis produced comparable spectra.
With a 5 µm pixel size, DESI is beginning to push spatial resolution towards single cell. An example of the potential for single cell images are given in Figures 5 and 6 where we have utilized the low-flow DESI configuration to image a small area of a murine cerebellum, focusing on a white matter structure.
The murine cerebellum images are produced selecting a single lipid signal with an m/z 760.5848, putatively identified as PC 34:1 (+0.26 ppm), for which the strongest signal is localized to structures that appear as single non-uniform cells within the white matter, most likely oligodendrocytes.1–2 The cells are measured to be between 10-15 µm in diameter with a 10–20 µm spacing. When the image is acquired with a 10 µm pixel size the closely localized cells are not clearly differentiated. When the image is acquired with a 5 µm pixel size the cells are clearly differentiated allowing for an estimation of image resolution of <10 µm, with a 5 µm pixel size.
- Figure 5 A shows a 10 µm pixel acquisition of a small section of murine cerebellum. Using a lipid with m/z 760.5848 a number of cell structures can be seen within the fissure. Acompanying the mass spectrometery image is a visual of the pre-analysed slide captured using a Lecia DM 2500 LED microscope.
- Figure 5 B shows a similar region of murine cerebellum (to A) analysed from consecutive sections, with a 10 µm pixel size and with a 5 µm pixel size, showing an improvement in image fidelity with the smaller pixel size.
- Figure 5 C shows the same acquisitions (as B) zoomed closer so pixel definition can be better visualized.
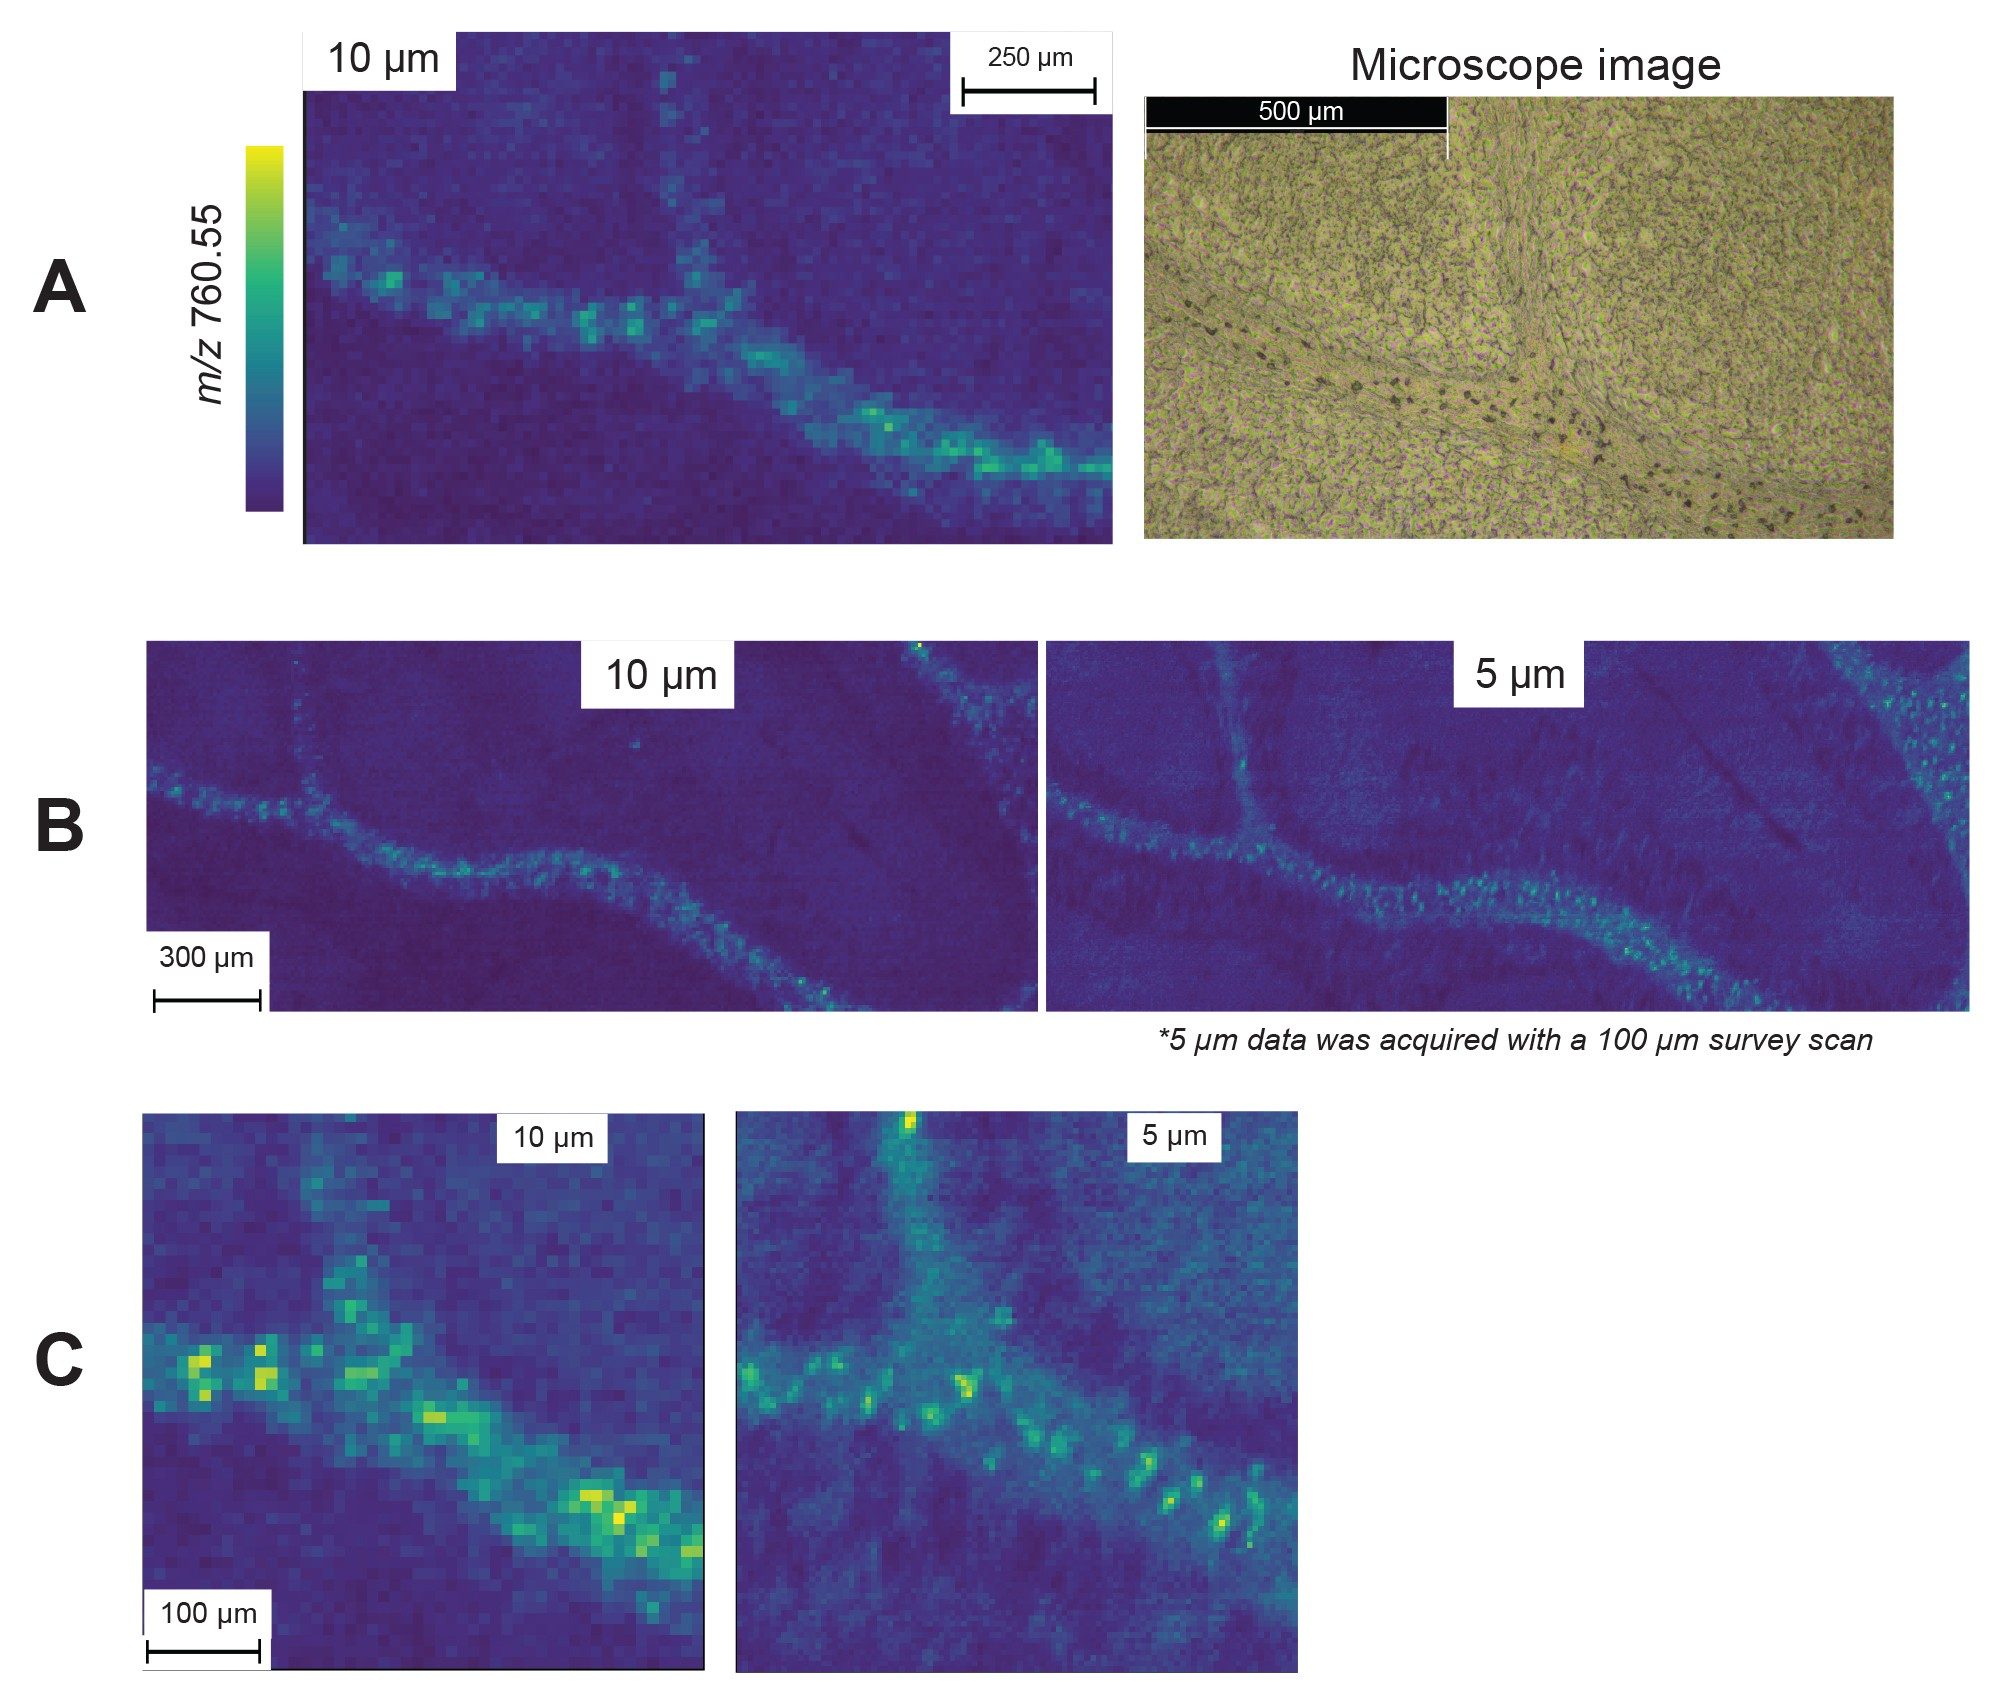 Figure 5. A) A small area of a murine cerebellum fissure with coresponding microscope image, B) an area of a murine cerebellum white matter on consecutive sections imaged at both 5 µm and 10 µm, and C) a closer zoom of (B). Images were aquired in positive mode at 20 hz.
Conclusion
We have demonstrated an increasing image fidelity with smaller pixel sizes, down to a pixel size of 5 µm, requiring only minor modifications to the commercially available DESI XS source. When it appears that image fidelity does not improve much beyond 20 µm when a traditional DESI flow configuration is employed.
We have shown that performing a survey scan utilizing the low flow DESI XS set-up but with larger pixel sizes does not affect data quality of the more detailed smaller pixel acquisition. No evidence of the survey scan was observed in the rescanned image and that the new Microscope mode within High Definition Imaging (HDI) Software v1.8 allows accurate reacquisition of a ROI defined from the survey scan image.
In combination, the low flow DESI and Microscope Mode of analysis unlock resolution approaching the single cell level, in reasonable acquisition time frames, with a commercially available DESI XS source.
References
- Marcus Fruttiger. et al, Defective Oligodendrocyte Development and Severe Hypomyelination in PDGF-A knockout mice, Development (1999) 126 (3): 457–467.
- Jäkel, S., Agirre, E., Mendanha Falcão, A. et al. Altered Human Oligodendrocyte Heterogeneity in Multiple Sclerosis. Nature 566, 543–547 (2019). https://doi.org/10.1038/s41586-019-0903-2
720008551, October 2024