Robust Large Image Acquisition at High Spatial Resolution Using the DESI™ XS Source Coupled to a Xevo™ G3 QTof Mass Spectrometer
Abstract
Demonstrating the suitability of the Xevo G3 QTof Mass Spectrometer (MS) coupled with the DESI XS source for high spatial resolution, large image acquisition, showing a whole Rat sagittal brain section acquired with a 10 µm pixel size. The entire image comprises of 2,321,700 individual pixels, and generated 364 Gb of raw data, requiring a total acquisition time in excess of 35 hours even at 20 scans per second. We show that image quality, spectral fidelity, and feature mass accuracy remains stable throughout the entire analysis and that data this large can be successfully processed and displayed in MS Imaging software packages.
Benefits
- Robust, reproducible, and flexible system solution for MS Imaging
- Comfortably acquires large and lengthy DESI XS images
- Substantial sized data smoothly imported and processed within High Definition Imaging (HDI™) Software
Introduction
With all mass spectrometry imaging techniques, there is a drive for higher spatial resolution through smaller pixel sizes. We have demonstrated that the Xevo G3 QTof coupled to a DESI XS source is capable of acquiring images with pixels of as little as 5 µm. However, with the implementation of these small pixel sizes the acquisition time increases exponentially.
When acquiring mass spectrometry tissue imaging experiments, as with all lengthy mass spectrometry analysis - there is a potential for a batch effect to be seen. Factors such as detector contamination- resulting from a high ion current - matrix build-up on the sprayer nozzle, or fluctuating laboratory temperatures can have a detrimental effect on the data quality over a long analysis time.
Here we present a large image acquisition, of a whole murine sagittal brain section acquired with a 10 µm pixel size. The entire image comprises of 2,321,700 individual pixels, and generated 364 Gb of raw data, requiring a total acquisition time in excess of 35 hours. This acquisition demonstrates that the Xevo G3 QTof and DESI XS source combination provides a robust and reliable imaging platform for large acquisitions, even those with relatively small pixels.
Experimental
A rat brain was sectioned (sagittal orientation) at 18 µm onto glass microscope slides. These sections were analysed with no further treatment on a Xevo G3 QTof MS coupled to a DESI XS source, equipped with a high-performance sprayer and heated transfer line.
MS Conditions
|
MS system: |
Xevo G3 QTof MS |
|
Source type: |
DESI XS |
|
Acquisition polarity: |
Positive Ionization Mode |
|
Cone voltage: |
80 V |
|
Source temperature: |
150 °C |
|
Acquisition range: |
50–1200 |
|
Analyzer mode: |
Sensitivity |
|
Experiment type: |
MS |
DESI Setup
|
Source: |
DESI XS |
|
Capillary voltage: |
0.7 V |
|
Nitrogen flow: |
20 psi |
|
Solvent: |
95% Methanol 5% Water |
|
Solvent flow rate: |
250 nL/min |
|
Heated transfer line temperature: |
200 °C |
|
Pixel size: |
10 µm |
|
Step rate: |
200 µm/s |
|
Equivalent scan speed: |
20 Hz |
Solvent Delivery
The solvent for the DESI sprayer was supplied by a ACQUITY™ M-Class BSM. To maintain back pressure the solvent line was fitted with a 1.7 µm ACQUITY C18 Column, 45 µm I.D. ZenFit™ capillary tubing was utilized to carry the solvent to the sprayer replacing the typical 150 µm I.D tubing.
Data Processing
MS data were processed and visualized in the Waters High Definition Imaging (HDI) Software v1.8, this included LockMass correction using a continuous LockMass correction (CLMC) algorithm, the data was also manually assessed using MassLynx™ Software.
For LockMass correction, a correction period of 10 minutes was set with a combine time of 2 minutes, the signal threshold was set to 500 counts with a 500 ppm window, the peak at m/z 826.572 was used putatively identified as PC (36:1) K+ with a theoretical mass of m/z 826.57226.
Results and Discussion
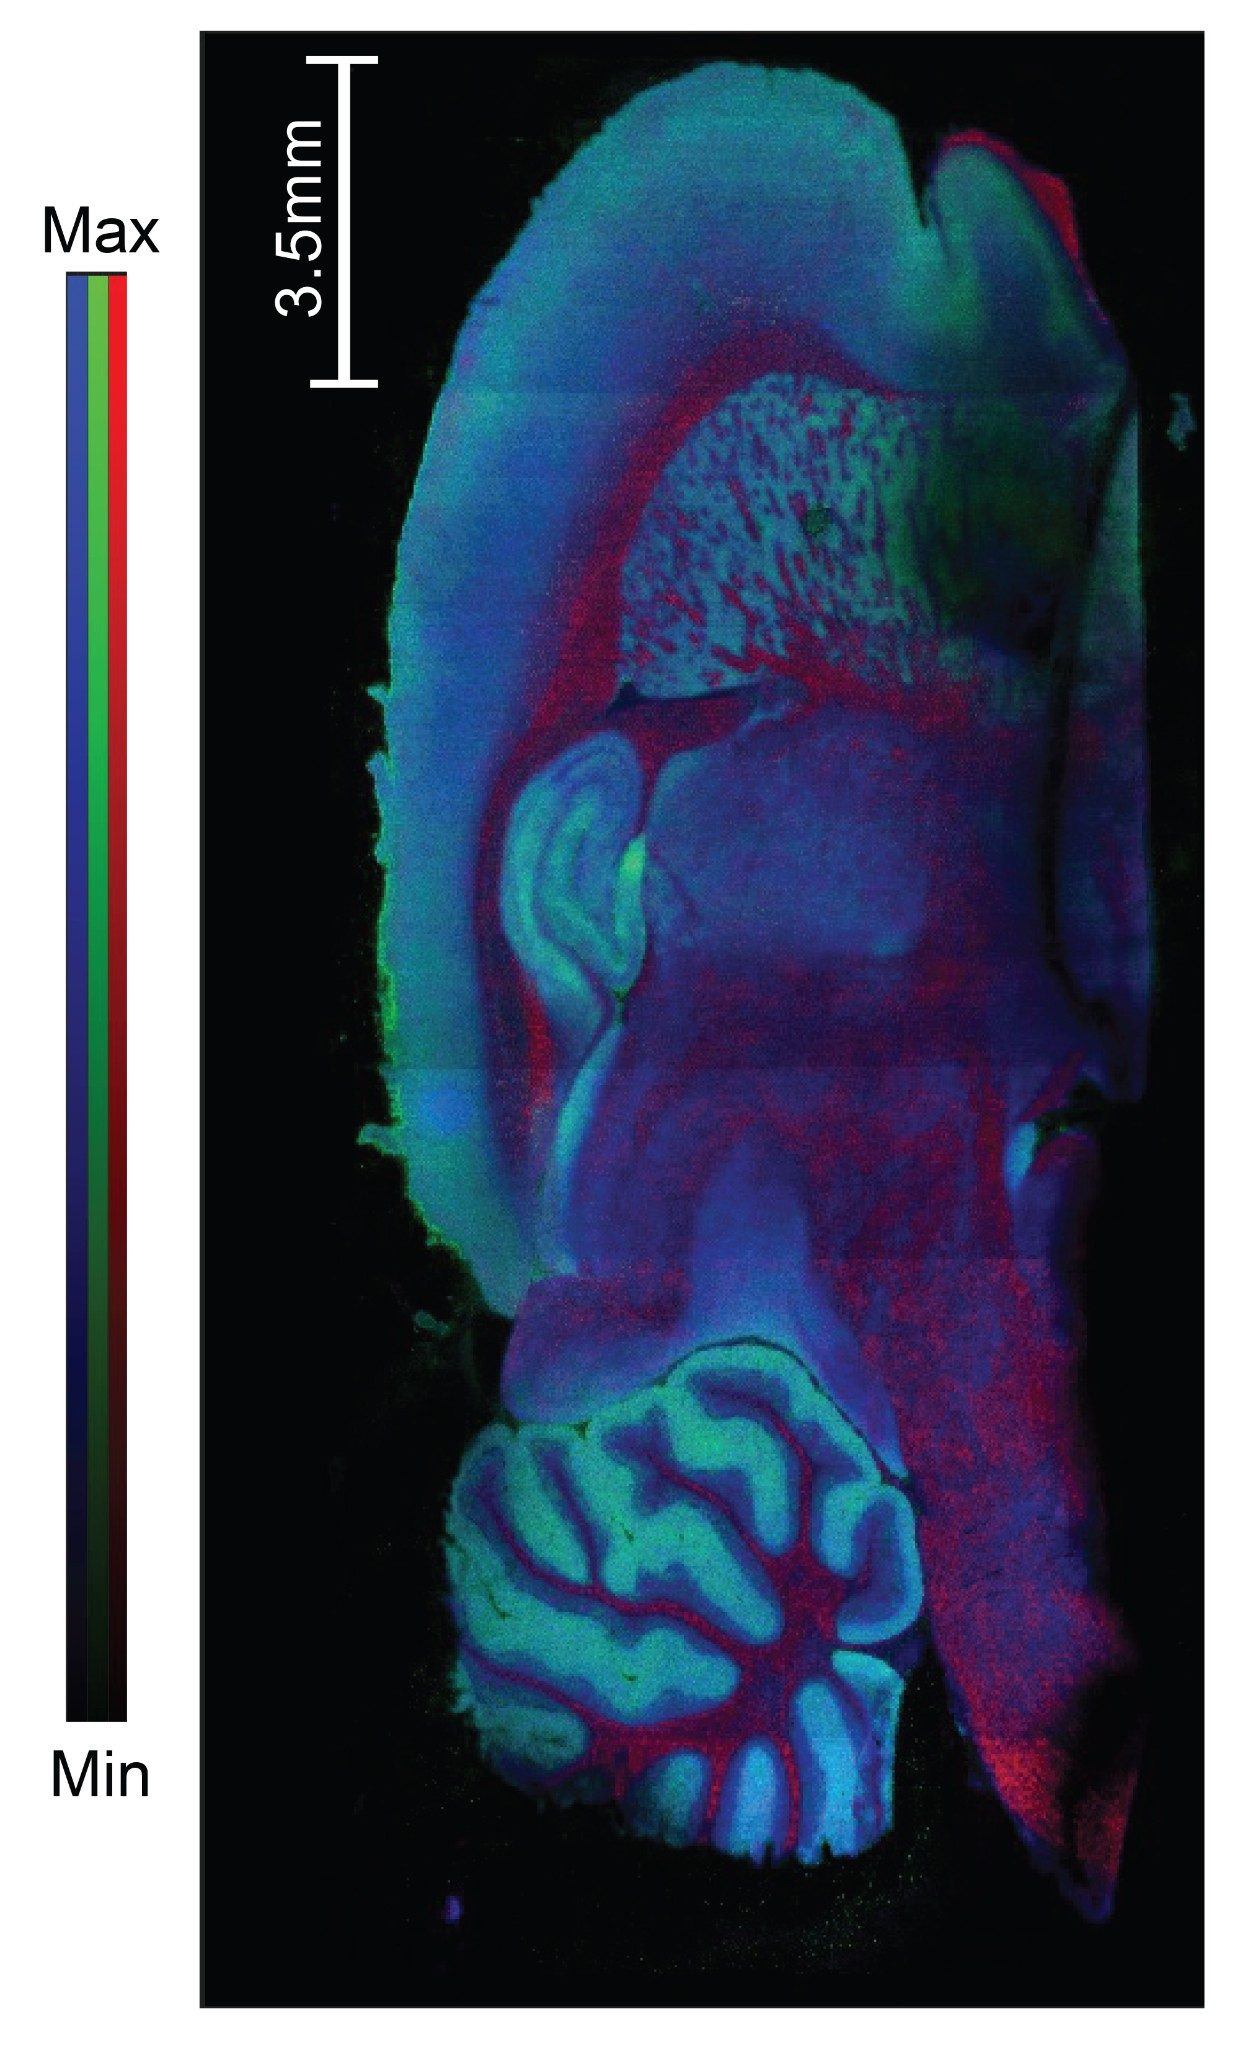
The MS Imaging system was employed to acquire the entire sagittal rat brain section at a 10 µm pixel size, totaling 2,321,700 individual pixels, with no issues or stoppages. The image within Figure 1 shows an example red, green, blue (RGB) overlay of three differentially localized lipid signals identified in this analysis:
- Red: m/z 760.5848, putatively identified as either Phosphatidylcholine (PC) 34:1 or phosphatidylethanolamine (PE) 37:1 with a 0.37 ppm mass accuracy
- Green: m/z 772.5253, putatively identified as PC 32:0 or PE 35:0 with a 0.73 ppm mass accuracy
- Blue: m/z 782.5668, putatively identified as PC 34:1 or PE 37:1 with a 0.29 ppm mass accuracy
The image was acquired as orientated within Figure 1, when visualized within the High Definition Imaging (HDI) Software, the image quality and feature clarity remain consistent throughout the entire image and the High Definition Imaging (HDI) Software was able to process and display the whole dataset successfully.
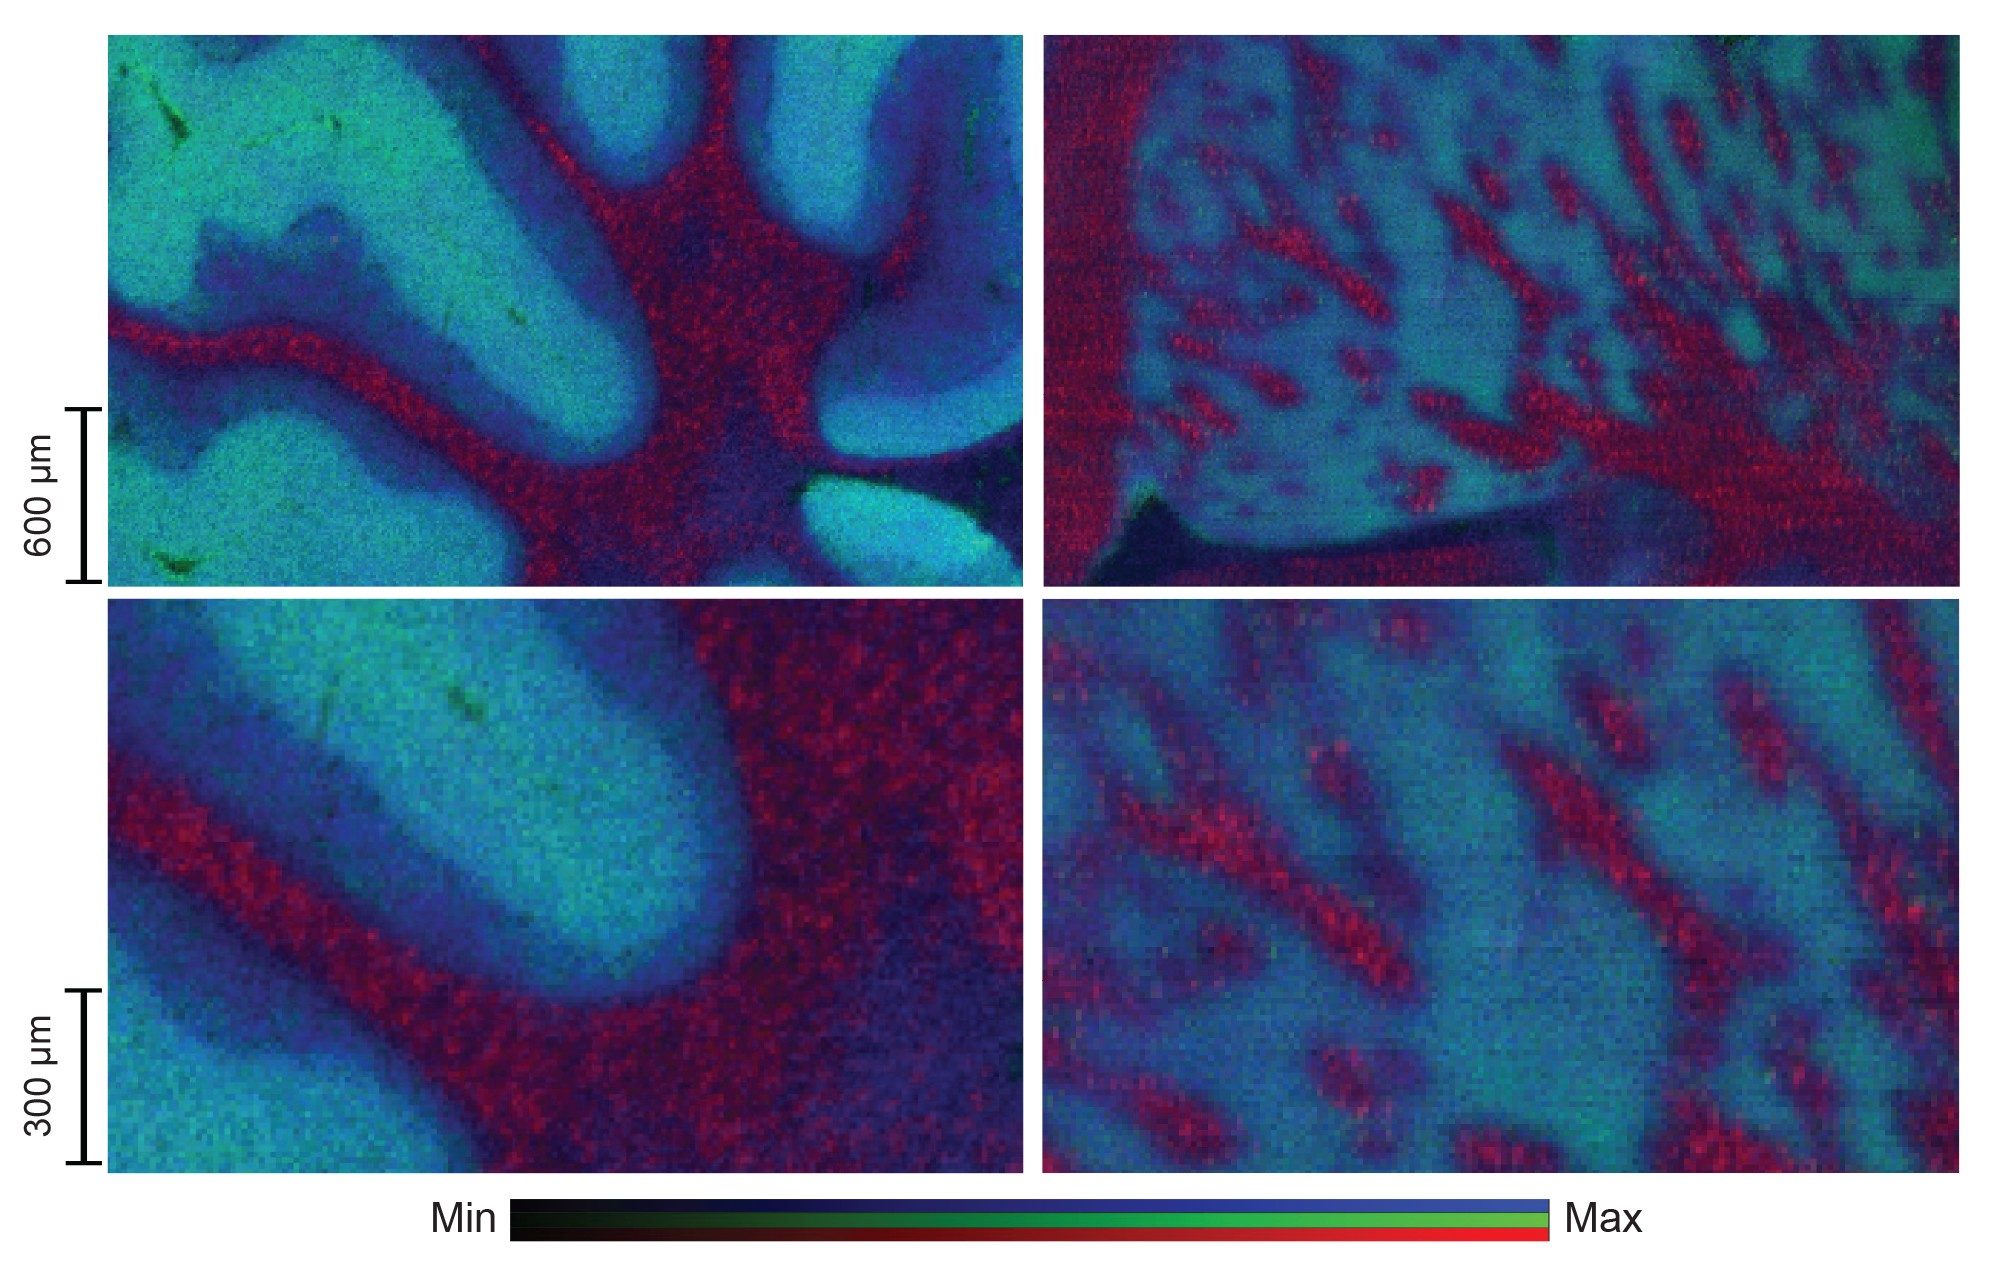
When areas of tissue are enlarged more detail can be seen within the image, Figure 2 shows a small section of the cerebellum (left) and a small section of the striatum (right). These two tissue regions are well separated spatially within the brain and demonstrate that image clarity remains consistent throughout the whole acquisition. The 10 µm pixel size allows the visualization of fine tissue structure with sharp definition.
The stable image quality is consistent across the spectra, demonstrated in Figure 3 where the top 15 monoisotopic tissue related analytes are displayed. They are presented with individual intensity scales, meaning that the maximum intensity is only representative of distribution of the single analyte in each image and is not indicative of relative concentrations across the multiple analytes.
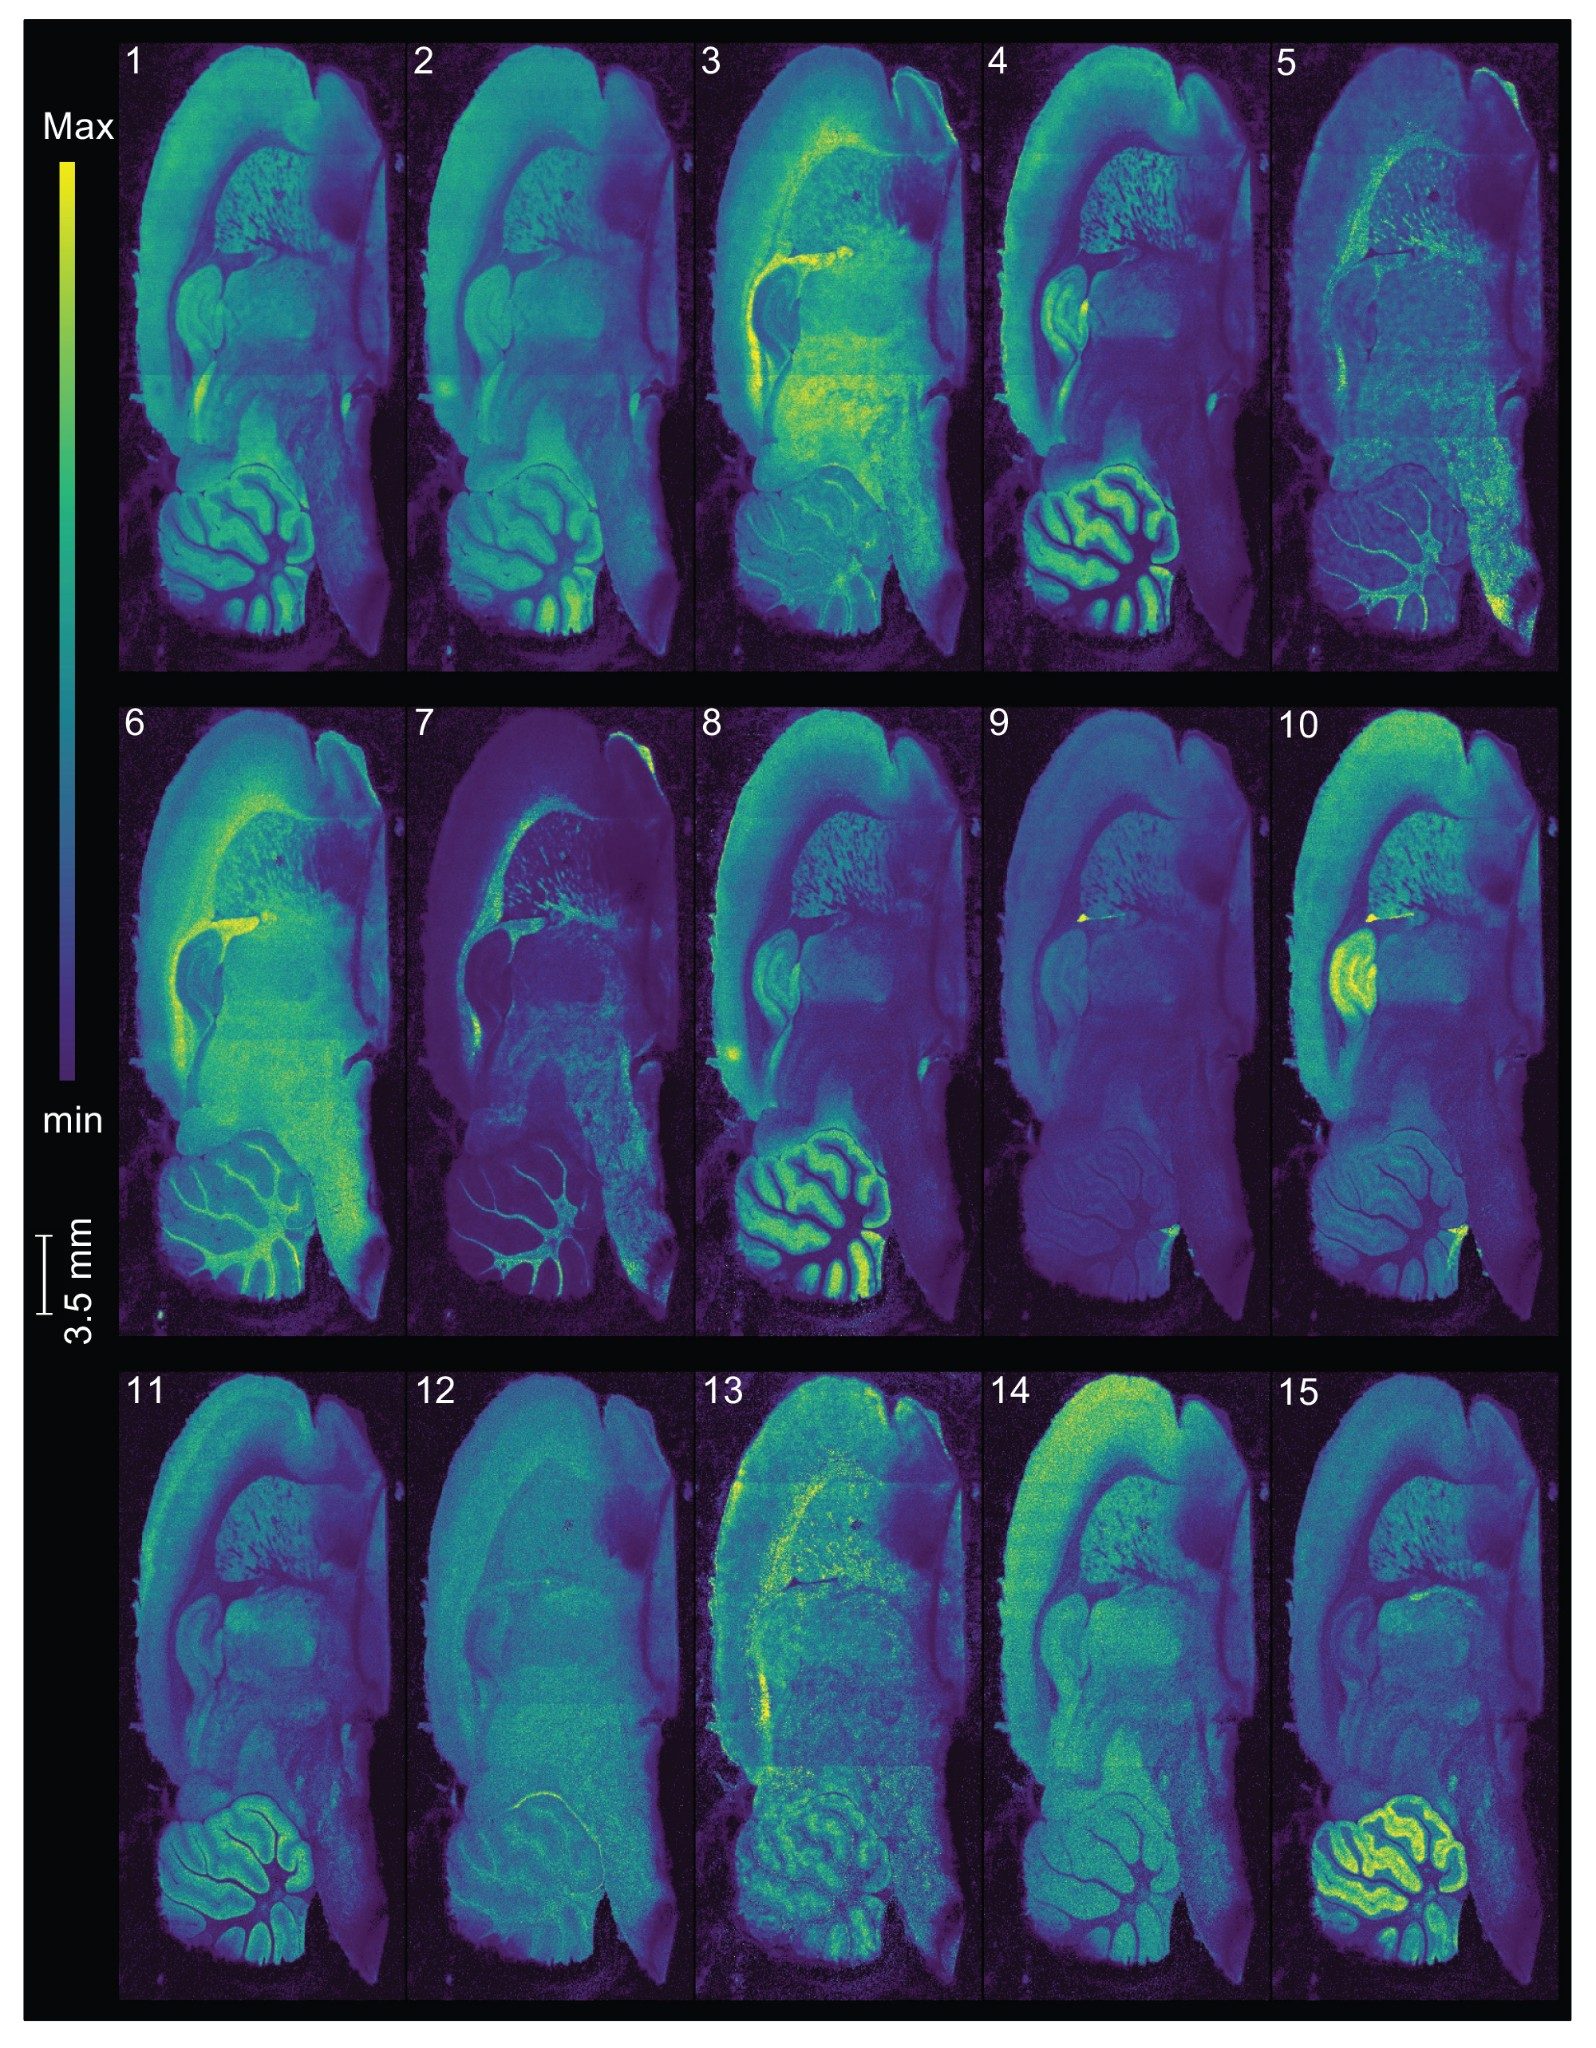
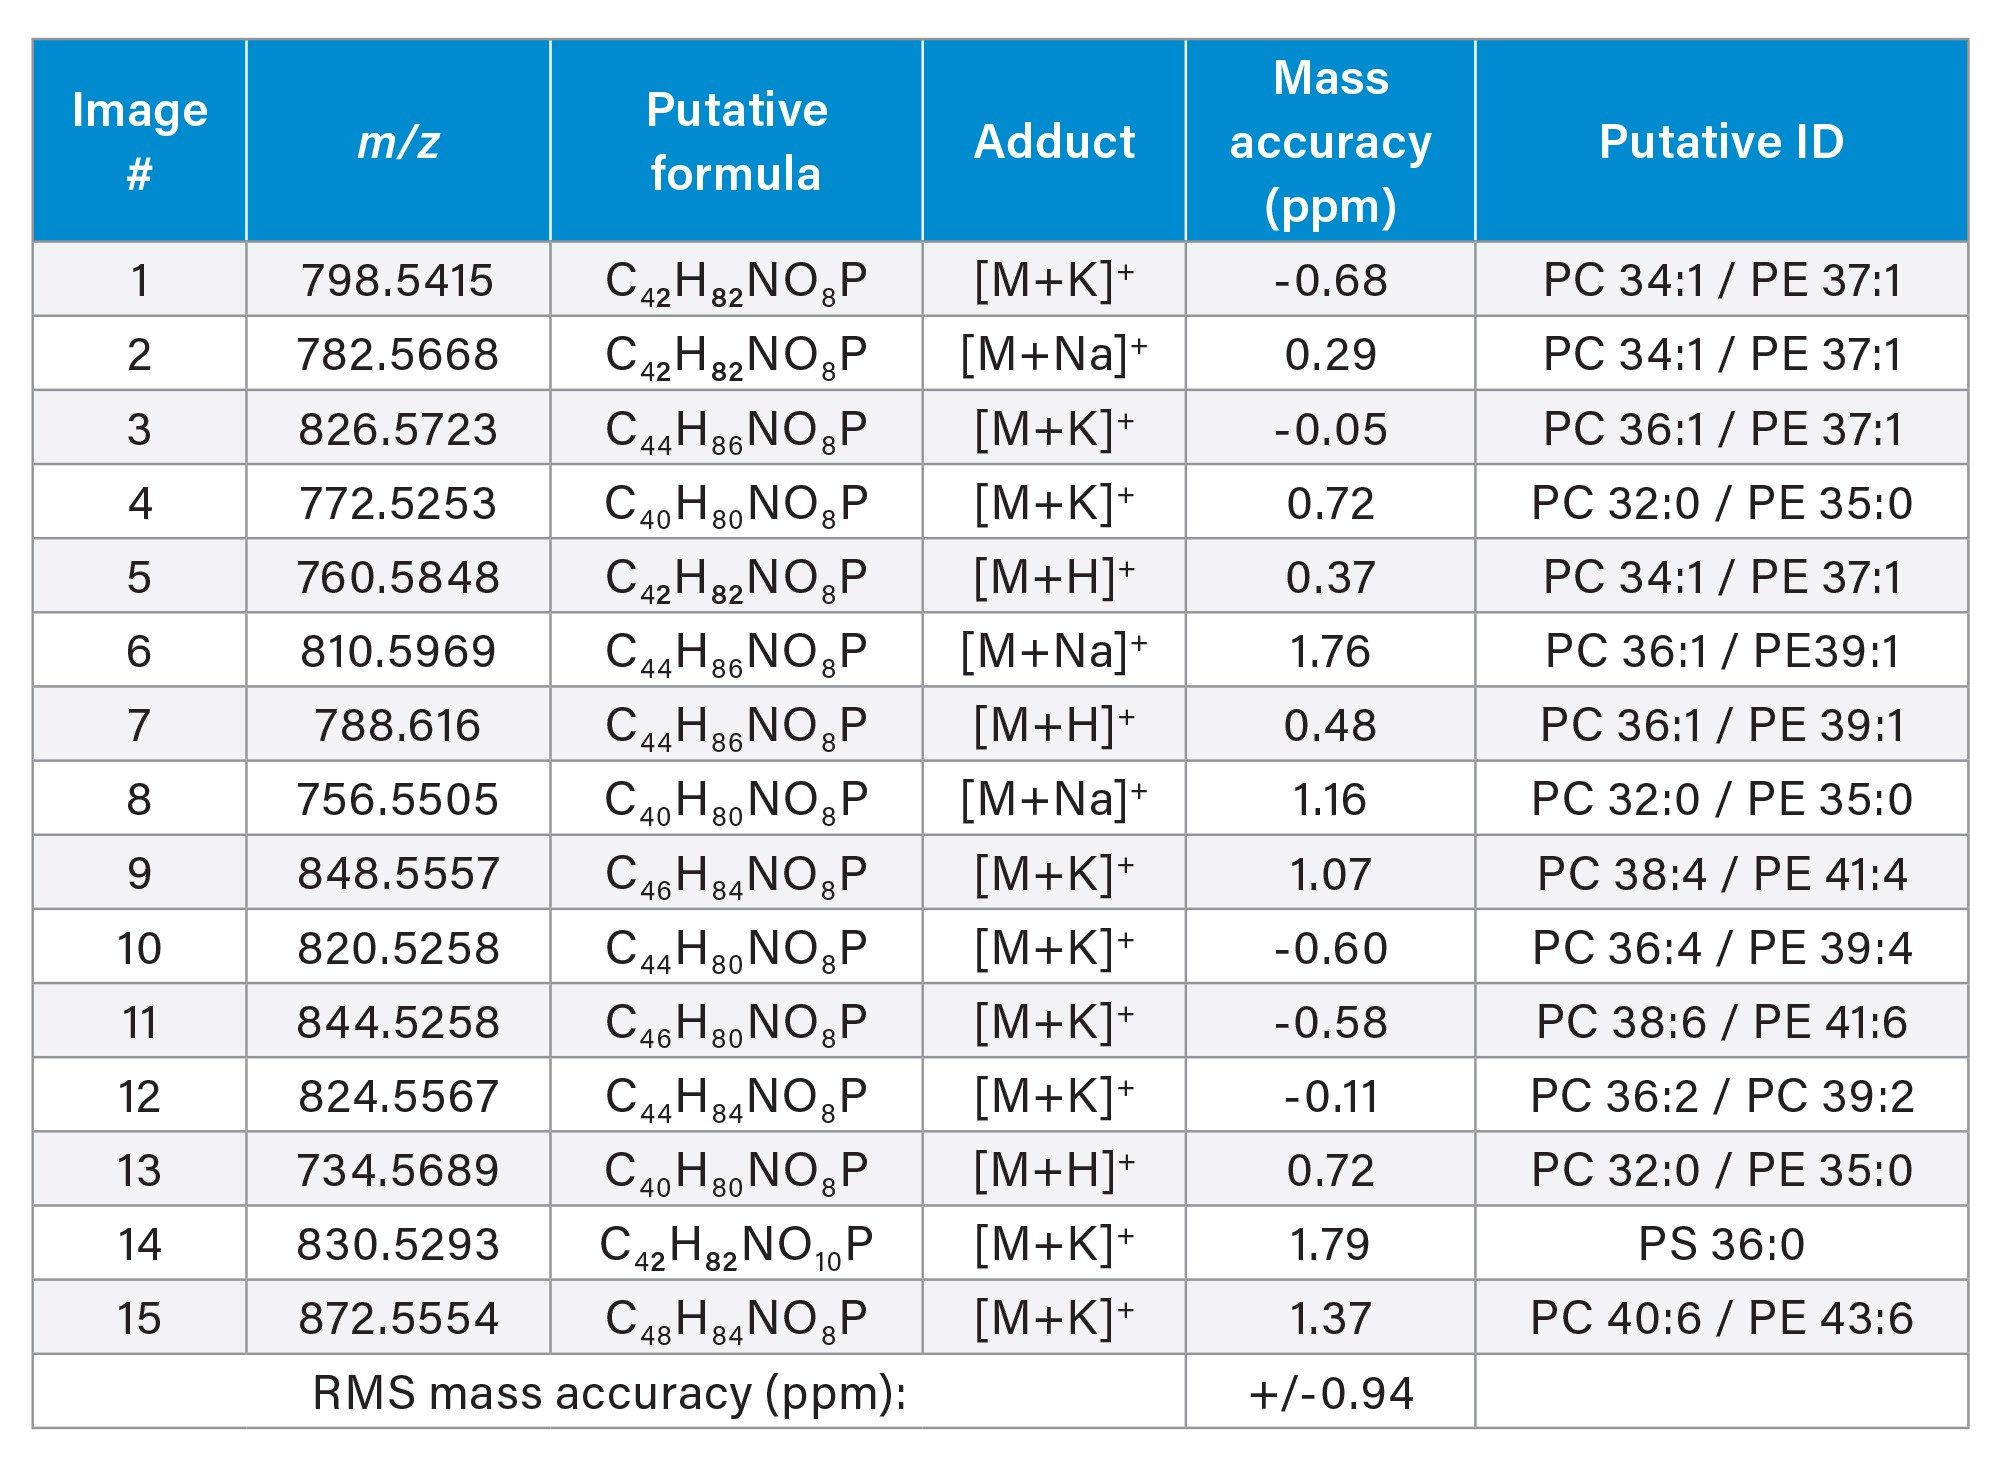
The peak picked masses for the above images can be seen in Table 1 along with the closest putative identifications, matched against the Lipid Maps database. The mass accuracy for these peaks was found to be better than 2 ppm. The majority of lipids in the top 15 highest intensity analytes have been putatively identified as isobaric PC/PE classes. PC lipids are preferentially ionized in positive mode - due to the permanently charged quaternary amine groups and their high intensity may also suppress ionization of other lipid classes.1,2 However, a contribution to the image from the corresponding PE cannot be discounted, as such we have included both potential lipid classes within the putative ID column. For unambiguous lipid class identification, further analysis by MS/MS would be required to examine the head group fragment peak.
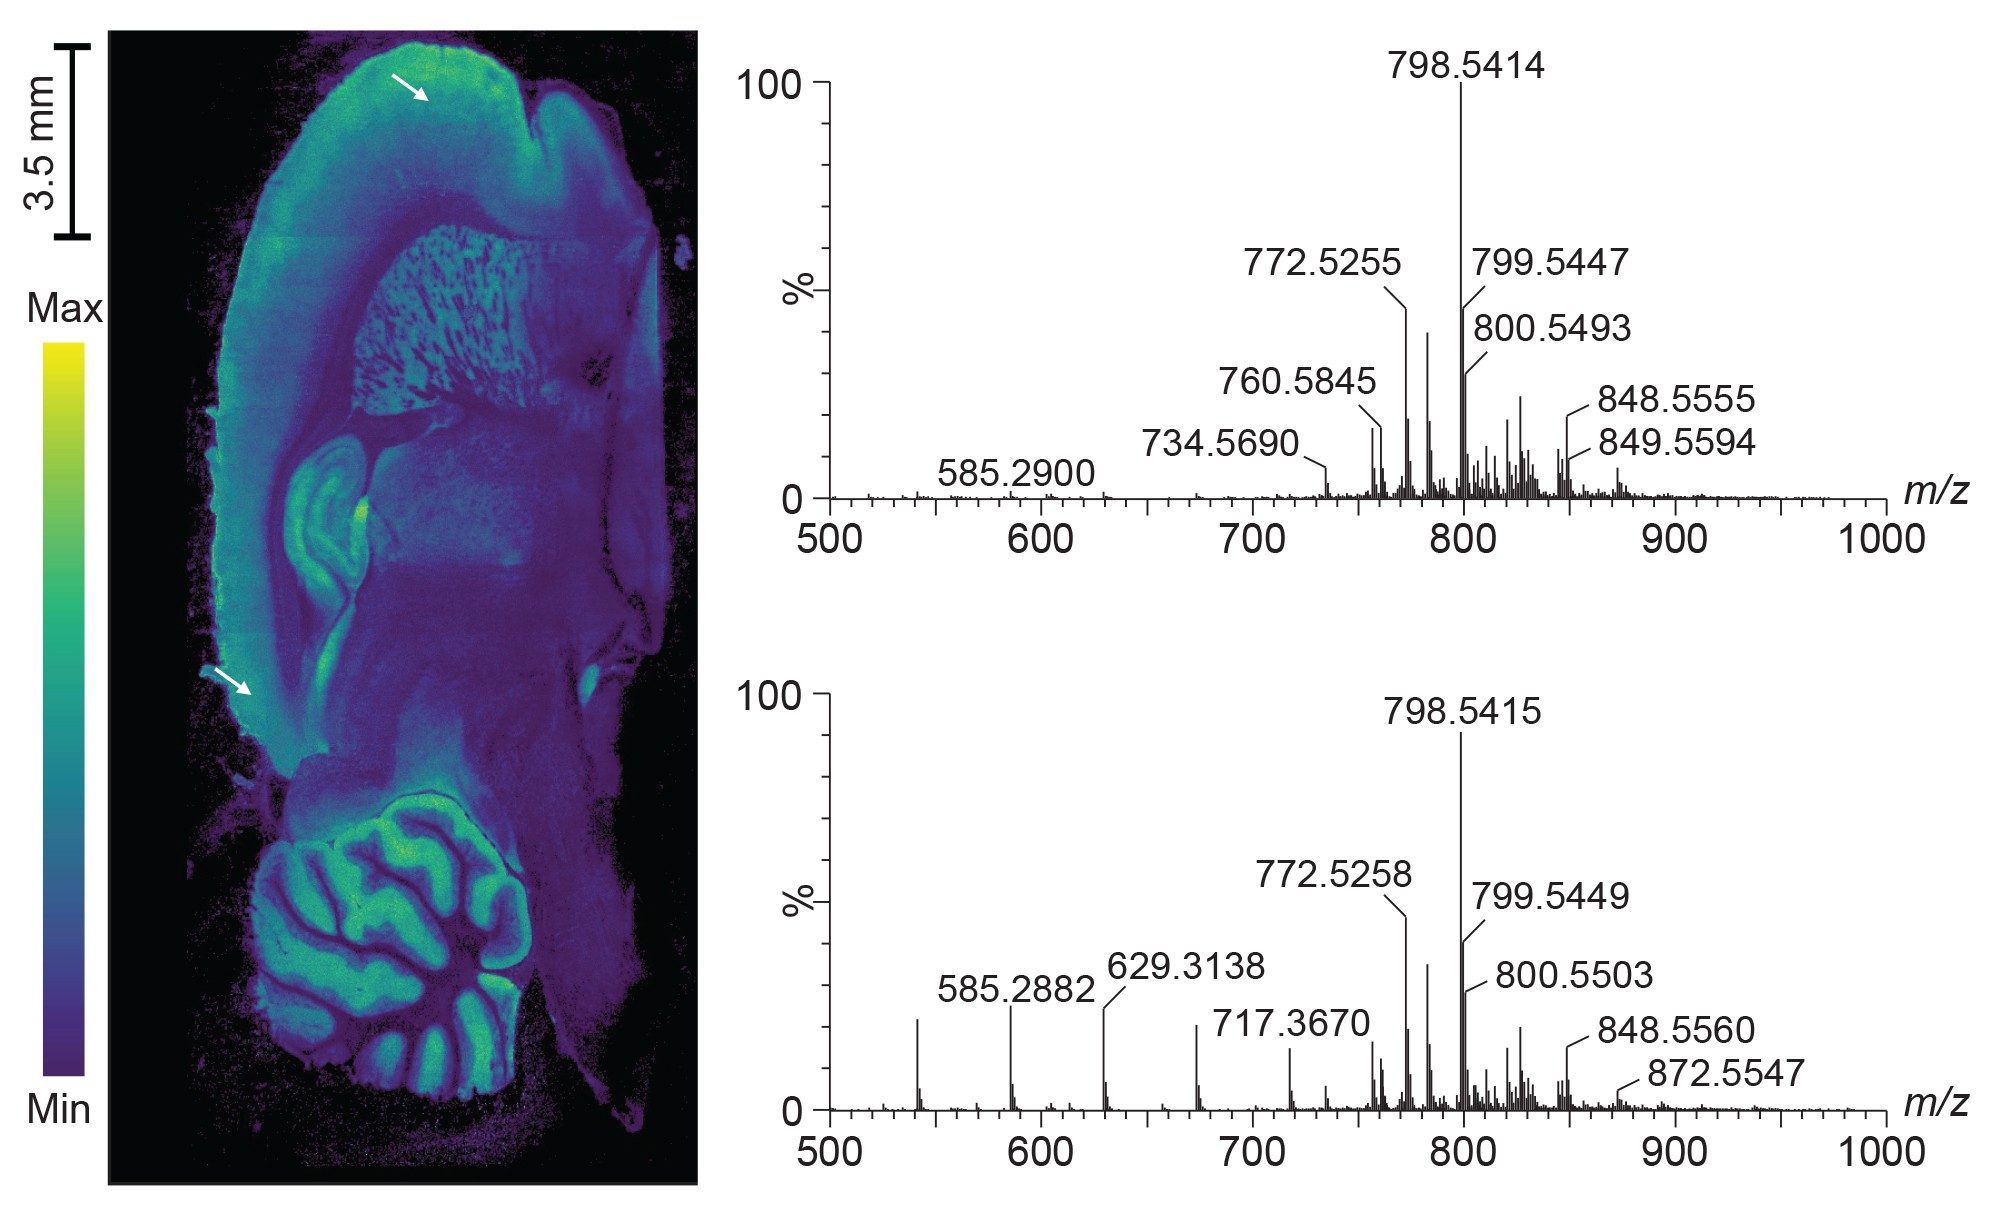
To further visualise the spectral consistency throughout the analysis, spectra of the cerebral cortex region of the rat brain has been extracted from the start and end of the structure (Figure 4). These scans occurred at approximately 2.2 hours, and 20.3 hours of the acquisition (18.1 hours apart) and show that the spectral profile and intensity are comparable. It can also be noted that – unlike MALDI – DESI XS signal is not affected by the presence of polymer contamination, the scans at 20.3 hours (bottom of the image) show the presence of a repeating unit indicative of a polymer, likely from embedding media. The mass resolution was also found to be consistent throughout the analysis, e.g. the lipid with an m/z of 798.54 has a mass resolution of ~27,000 FWHM for both timepoints.
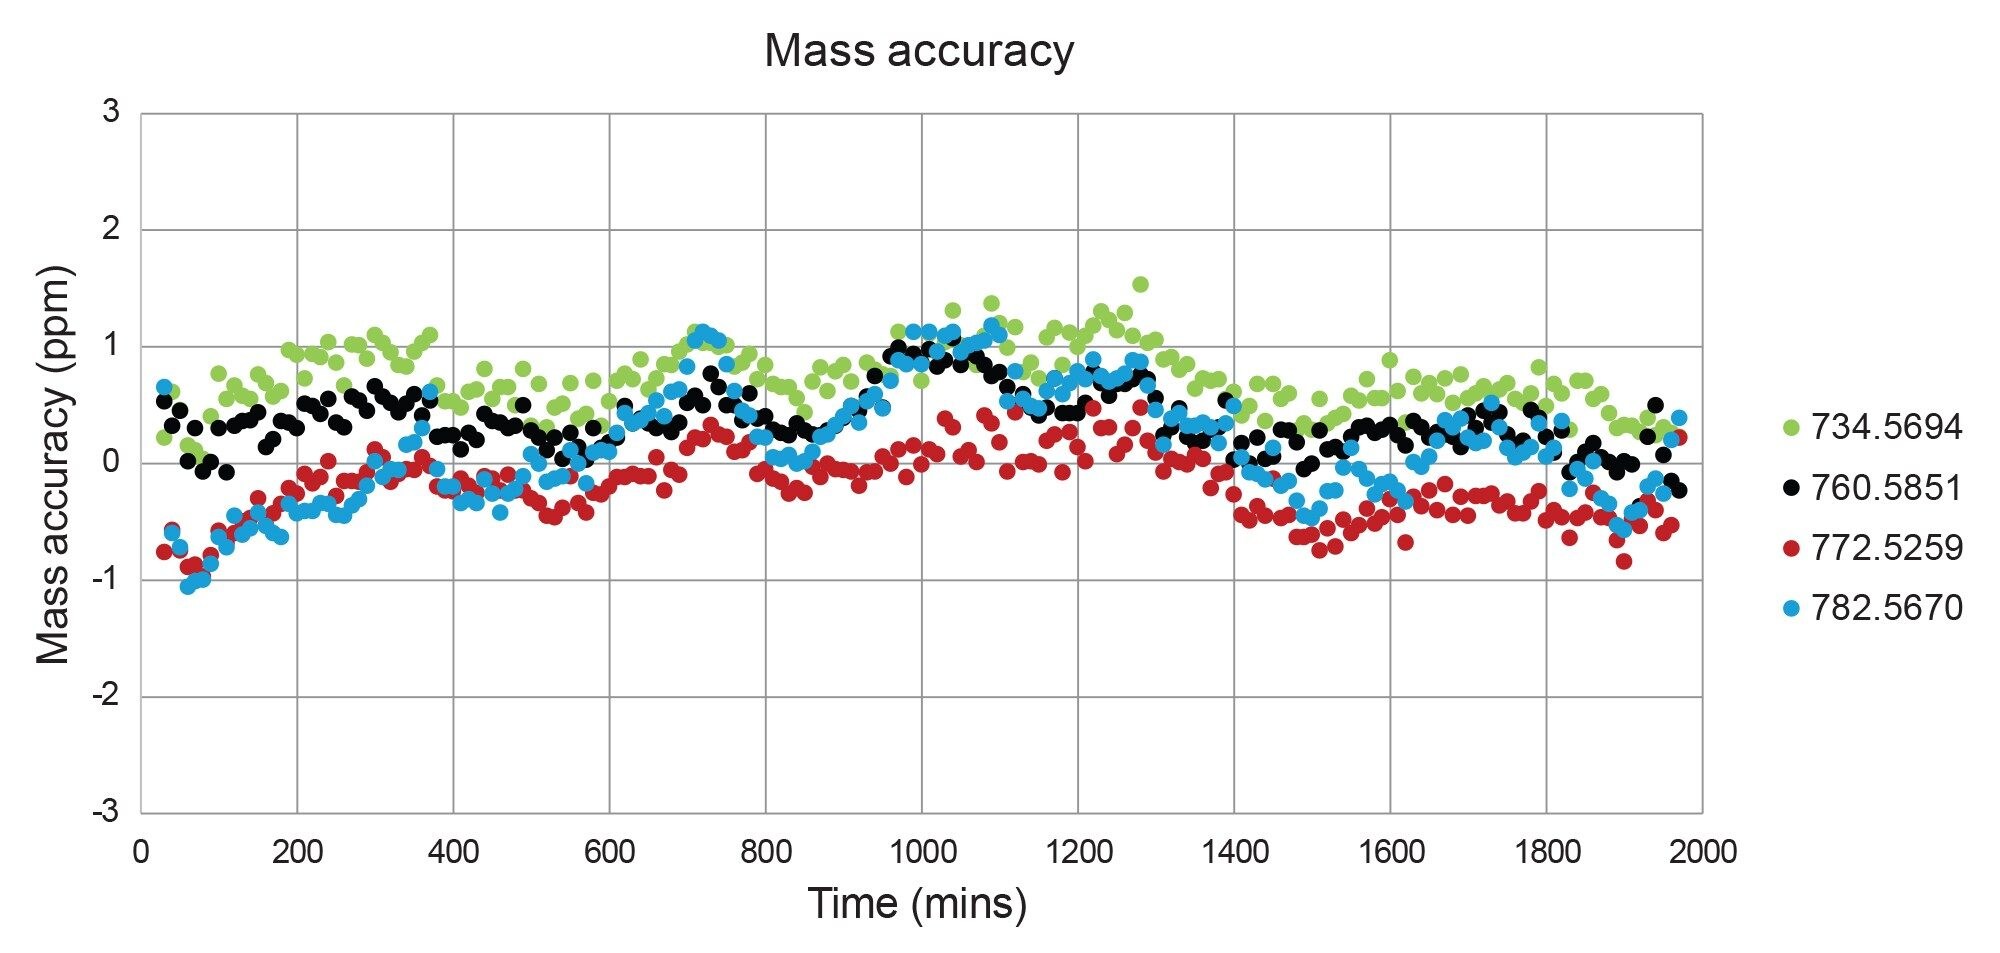
Lastly; we looked at mass accuracy over the course of the >35 hour analysis. Figure 5 shows a graph depicting the mass accuracy in ppm of: m/z 734.5694, m/z 760.5851, m/z 772.5259, and m/z 782.5670 over the course of the tissue acquisition (0.5 hrs to 32.8 hrs). Measurements were taken at 10 minute intervals, combining 2 minutes of data at each point, the putative identifications for these peaks can be seen in Table 1. Data displayed in Figure 5 is taken from CLMC lockmass processed data to remove any small contributions of mass fluctuation due to changes in lab temperature over the course of the acquisition.
This shows that the relative mean standard error for these analytes was +/- 0.77, 0.44, 0.35, and 0.51 ppm respectively.
Conclusion
We have shown that the Xevo G3 QTof coupled to a DESI XS is a robust and reproducible MS Imaging system, suitable for large image acquisitions at high spatial resolution. We have demonstrated that the image and spectral quality remain consistent over a >35 hour acquisition, and that software packages such as MassLynx and High Definition Imaging (HDI) Software are comfortable processing a single image with data exceeding 350 Gb in size.
References
- Petkovic M, Schiller J, Mueller M, Benard S, Reichl S, Arnold K, Arnhold J. Anal. Biochem.2001; 289:202. [PubMed: 11161314].
- Schiller J, Suss R, Petkovic M, Zschornig O, Arnold K. Anal. Biochem. 2002; 309:311.
720008578, October 2024