Screening Metabolomics of Human Urine Using a Waters™ High Resolution QTof Mass Spectrometer and MARS Data Processing Software
Abstract
Describing the combination of HILIC UPLC, High Resolution Mass Spectrometry (HRMS), and an intelligent workflow driven software allows for the rapid accurate metabolomic analysis of biological samples. Here we demonstrate the use of MARS™ (distributed by Mass Analytica, Barcelona, Spain) metabolomics data processing software to identify and pathway profile a typical metabolomic study. The Xevo™ G3 QTof delivers rapid, robust data acquisition for large cohort metabolomic studies and MARS provides a comprehensive solution for data processing, including feature detection, identification, and pathway profiling.1 The resulting data shows a clear unsupervised PCA separation between the three study groups with exogenous or environmental markers being the most significant differences from the volunteer lifestyles.
Benefits
- Simple and robust acquisition strategy delivering excellent data reproducibility
- Customizable workflow which can be tailored to application goals
- Various multivariate statistical analysis tools
- Quantification and pathway analysis tools
Introduction
Metabolomics is an area of research which allows for the identification of key metabolic changes of an organism resulting from: disease, tailored treatment, environmental exposure, lifestyle etc. The metabolome is very complex, containing 1000’s of compounds which depending upon matrix can vary vastly in molecular weight, concentration, and polarity, as such a comprehensive analysis of such a wide range of molecules within a single rapid injection is challenging. In a screening metabolomic study samples are typically analyzed by Reversed-Phase (RP) liquid chromatography or HILIC liquid chromatography or a combination of both (requiring two analytical runs), coupled to a mass spectrometer capable of high accurate mass data independent acquisition with a wide dynamic range. Despite developments in analytical technology the detection and identification of small molecule metabolites remains a significant challenge, mainly associated with software capabilities processing large cohort complex datasets, and/or around database searching resulting in putative compound identification.
Here we demonstrate the suitability of the Waters HRMS systems, and the powerful workflow driven MARS Software for the rapid, objective, and reliable discovery of compounds of interest. The benefits of this approach are demonstrated using a commercially available small urine metabolomics study derived from pooled urine samples of healthy volunteers and grouped based upon their nicotine intake from smoking cigarettes. The resulting data showed significant changes in exogenous or environmental markers for each of the different volunteer lifestyles.
Experimental
Study Design
Healthy volunteers provided a urine sample, these were subsequently pooled into three master samples as supplied, indicating nicotine intake from cigarettes: non-smoker, passive nicotine intake, and current smoker. This is a commercially available metabolomic sample set; NIST SRM 3671 Nicotine Metabolites in Human Urine (NIST, USA).
Sample Preparation
A study QC was prepared taking a 200 µL aliquot from each smoker level and combining to create a QC pool.
Waters LCMS QC Reference Standard (LCMS Mix) (p/n: 186006963), was diluted 1:3 in ultrapure water - 500 µL of LCMS Mix diluted with 1500 µL of ultrapure water.
A 10 µL aliquot of each smoker level and of the pooled QC sample was diluted with 170 µL of ultrapure water and spiked with 20 µL of the prepared LCMS Mix and vortexed for 15 seconds to ensure homogenicity.
Five analytical replicates of each sample were injected using an ACQUITY™ Premier System onto the Xevo G3 QTof with no further sample preparation, acquisition was controlled by the waters_connect™ platform.
LC Conditions
|
LC system: |
ACQUITY I-Class Premier FTN |
|
Column: |
ACQUITY UPLC™ BEH™ Amide (1.0 mm x 50 mm, 1.7 µm) |
|
Column temperature: |
45 ˚C |
|
Injection volume: |
1 µL |
|
Flow rate: |
0.6 mL/min |
|
Mobile phase A: |
Water 0.1% formic acid |
|
Mobile phase B: |
Acetonitrile 0.1% formic acid |
|
Gradient: |
1% A hold 0.03 minutes, 1%–20% A 0.03–2 minutes, 20%–50% A 2–2.3 minutes, hold 2.3–2.5 minutes, re-equilibrate initial conditions 2.5–3.5 minutes |
MS Conditions
|
MS system: |
Xevo G3 QTof |
|
Ionization polarity: |
Positive ion |
|
Capillary voltage: |
2 kV |
|
Sampling cone: |
30 V |
|
Source offset: |
80 V |
|
Source temperature: |
120 °C |
|
Desolvation temperature: |
600 °C |
|
Cone gas flow: |
50 L/Hr |
|
Desolvation flow: |
600 L/Hr |
|
StepWave mode: |
Default Transmission |
|
Detector auto gain: |
On |
|
Analyzer mode: |
Sensitivity |
|
Data format: |
MSE continuum |
|
Acquisition range: |
50–1200 Da |
|
Dynamic range: |
Extended |
|
Scanning speed: |
10 Hz |
|
Fragmentation ce: |
20–40 eV |
|
Lockspray flow: |
10 µL/min |
|
Lockspray settings: |
Average 3 scans every 60 seconds |
|
IDC: |
On (Default) |
Data was processed within MARS Software for peak picking, statistical analysis, compound identification, and pathway profiling.
Results and Discussion
A small-scale urine metabolomics study was analyzed on a Xevo G3 QTof coupled to an ACQUITY Premier System, this data demonstrated excellent retention time and analyte detection stability as well as consistent mass accuracy measurement within ±5 ppm for even the smallest of compounds, with a linear dynamic range of up to 5 orders of magnitude this set-up is ideally suited for large cohort metabolomic studies.1,3
One of the biggest challenges in omics studies is the confident identification of potential biomarkers, particularly within the field of metabolomics as low molecular weights make mass accuracy a challenge, and many small molecule compounds have very similar molecular formula. Recent initiatives have been developed to help improve the quality of these results for example the metabolomics quality assurance and quality control consortium (mQACC), offering guidance on best practice and acceptance/exclusion criteria, however implementation of these guidelines requires robust, accurate, and comprehensive instrument systems and processing software capabilities.4,5 The workflow outlined aims to produce quality datasets and generate confident results (Figure 1).
 Figure 1. Overview of the proposed Waters HRMS-MARS workflow.
MARS Software, distributed by Mass Analytica, is a comprehensive software tool for processing LC-MS/MS-based metabolomics data, designed to incorporate all variations of acquisition modes, including data dependent (DDA) and data independent (DIA) acquisition methods. The MARS Software solution is a complete workflow inclusive of raw data import, peak detection, compound identification, quantification, statistical analysis, trend analysis, flux analysis, and biopathway profiling analysis. Within a single MARS analysis session, different modes of analysis (e.g. MS/MS and MSE) can be combined to increase knowledge, accuracy, and obtain a more comprehensive analysis of potential biomarker compounds.
Peak Picking/Feature Finding
MARS Software supports the processing of data files produced by all Waters data acquisition platforms: MassLynx™ (.raw files), UNIFI™, or waters_connect (.uep files) with the software able to directly interface with the waters_connect/UNIFI Oracle database and import files directly without the requirement to export projects via the Application Programming Interface (API). For this study, data generated were directly imported into MARS from the waters_connect Oracle database. The “LC-MS Settings” window provides the user the ability to use either default settings or customize conversion and processing settings based on the LC-MS instrument and method used for data acquisition, as well as the intrinsic features of the dataset. The informatics solution allows data files from positive and negative polarity modes to be included within the same analysis session and/or combined into a single data matrix - if desired - streamlining sample comparison and multivariate statistics, reducing the requirement for multiple statistical sessions for the same study.
Once imported, data requires sample pre-processing and peak detection, Figure 2 shows a typical view of this process, with the NIST smokers urine data. MARS performs data processing in five steps: (1) baseline and noise reduction; (2) peak extraction; (3) smoothing; (4) signal-to-noise ratio; and (5) retention time (RT) correction; (6) alignment; (7) deisotoping and deconvolution; (8) gap-filler (optional).6 A “super sample” is produced during the processing step, containing the features from all samples combined into a single (virtual) chromatogram speeding up holistic data processing tasks such as analyte identification.
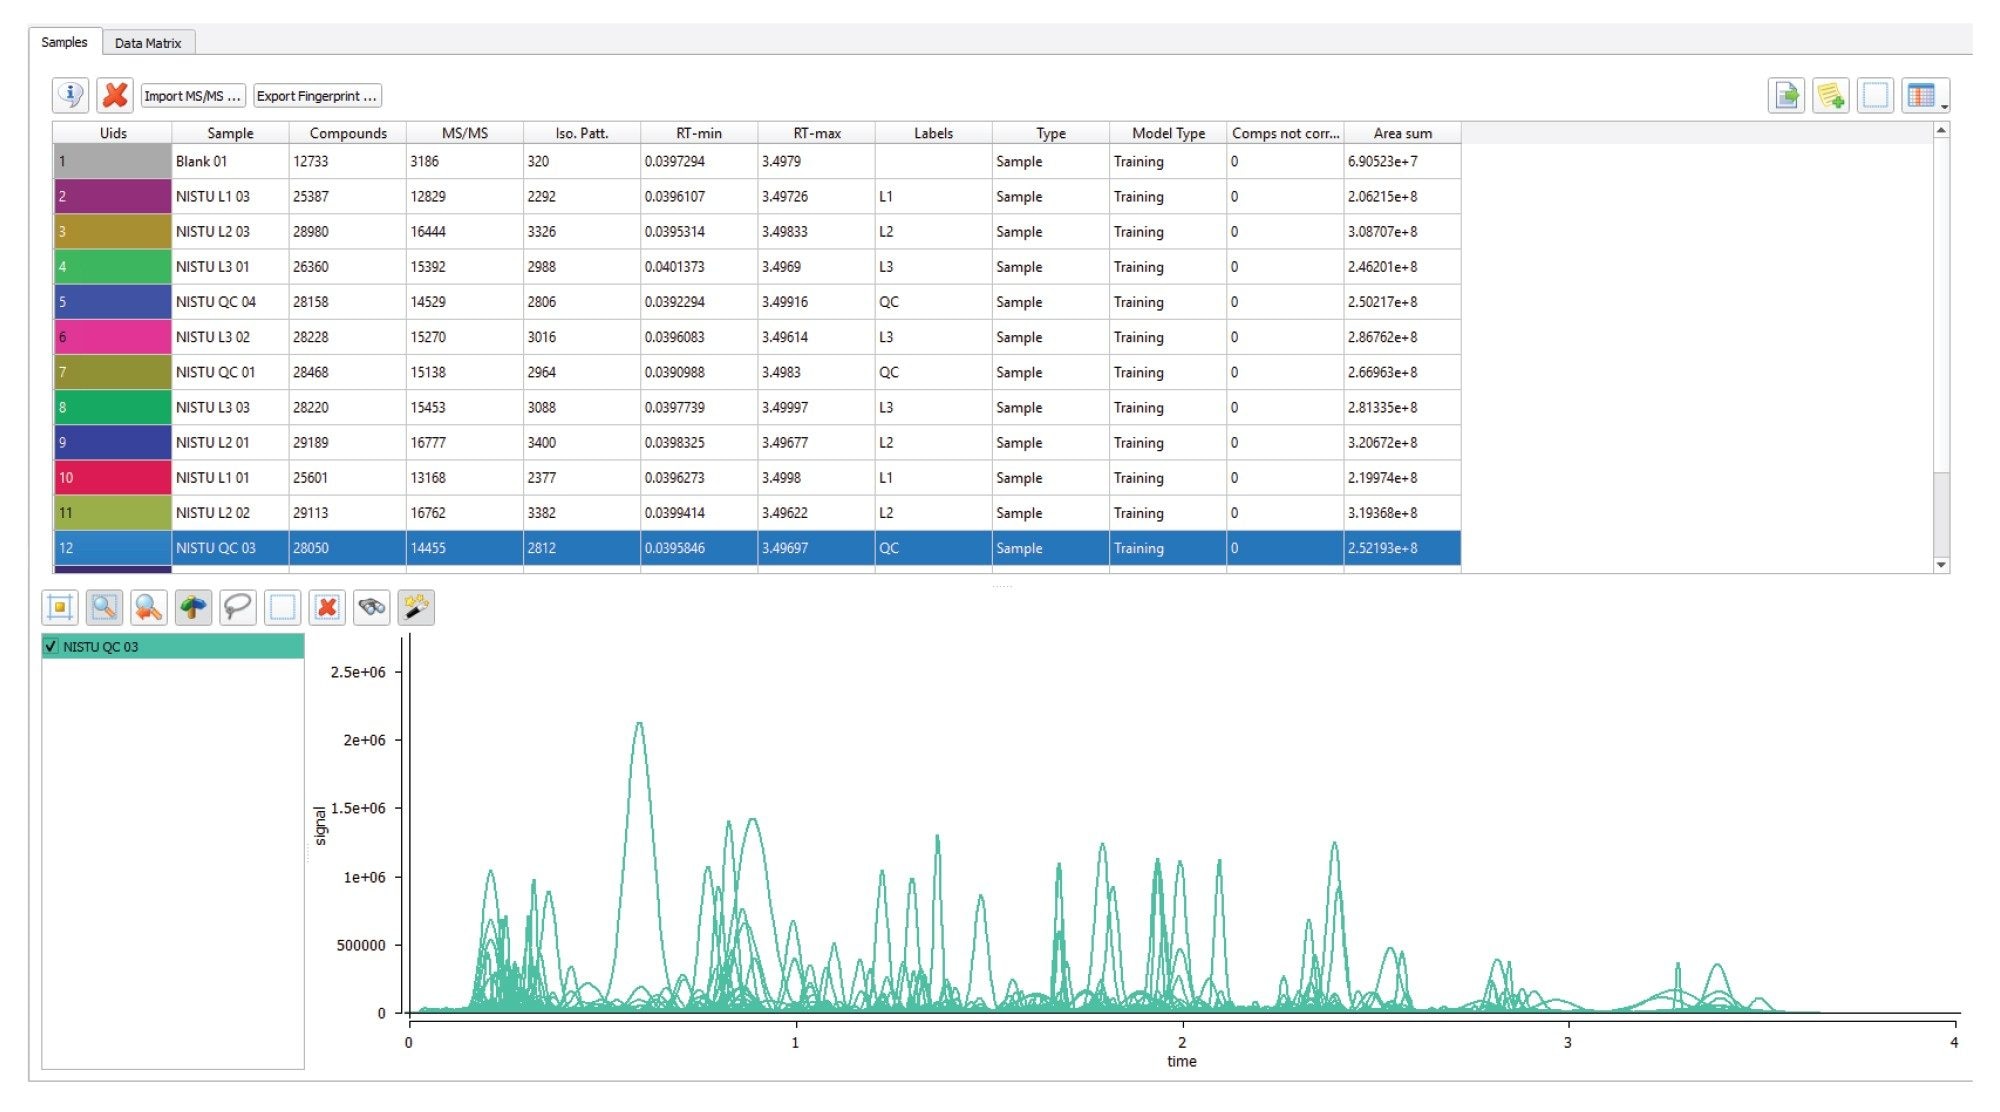 Figure 2. Representative data from the HILIC positive mode analysis of the NIST QC Pool, imported, and peak picked.
Alignment and Statistics
Untargeted omics involves comparing molecules from samples within a large cohort study to look for statistically relevant compound fold changes between the groups. Following peak extraction, and data processing the profile of each analytical sample is initially defined as a series of mass‑to‑charge ratios at given retention times (m/z@RT; at this stage, isotopic peaks as well as peaks related to different adducts are not clustered and hence treated as distinct entities. The software then searches for patterns relating to isotopes at the same retention time, indicating that multiple peaks correspond to the same compound. The data is then aligned to form a matrix, with rows representing the samples and columns representing the m/z@RT entries, as shown in Figure 3.
 Figure 3. Representative data matrix showing results from the feature m/z 148.0604@2.88 (m/z@RT), putatively identified as Glutamic Acid, which shows alignment of the MS and MSE spectra, and the varying concentration across the samples of the analysis.
The resulting data matrix can then be subject to multivariate analysis (MVA) to reveal underlying patterns in the data. Various unsupervised (e.g. principal component analysis: PCA, Consensus PCA) and supervised (e.g. partial least-squares: PLS, PLS-DA, O-PLS) algorithms for multivariate analysis are available within the MARS Software depending upon application goal and number of groups. Figure 4 shows an example MVA data obtained from a PCA model and corresponding S-plot from the NIST urine sample data. This data shows a clear separation between the three nicotine intake levels, demonstrates tight replicate clustering and a centralized QC pool injection cluster, indicating excellent technical reproducibility over the analysis.
Further advanced tools for the visualization and interpretation of the statistical analysis, as well as the evaluation of robustness, are also possible. For instance, a user may exclude or select variables (i.e. compounds) for the statistical purpose, outlier samples can also be excluded, and the plot regenerated and the frequency plot (frequency of variable occurrence vs the number of samples) can also be employed.
 Figure 4. Example view of statistical tools available within MARS. Showing the PCA score plot (left) generated with all sample levels and QC injections, and an S-Plot generated comparing Level 1 against Level 3 using PLS-DA (right).
Identification and Semi-Quantification
The putative identification of small molecules is extremely challenging, with many isomeric or similar molecular weight compounds and as such databases including high energy fragmentation information are used extensively. Compounds are generally identified by generating a database (e.g. of human metabolome structures, MS, and MS/MS data when available) through the DB Manager module. In addition to the monoisotopic mass and the experimental fragment ions of the compound the user can input information, such as retention time and if available collision cross section (CCS) values to increase the identification reliability. For Waters files processed in MARS, Waters utilizes a downloadable HMDB library which can be used by our customers.7 In addition to HMDB, MARS allows building database using MoNa (Mass Bank of North America)MiMe, or in-house generated data.8,9
A scoring function is applied to any potential identifications from matching against the library, the overall score will be indicative of the difference between experimental and theoretical mass (Δ ppm), isotopic pattern score, MS/MS fragmentation scores and (if applicable) CCS values from databases. The weight to be assigned to each partial score can be set by the user when the identification method is defined (e.g. for full scan acquisition, the MS/MS score can be set at 0). In addition, based on the level of confidence for an identification result, especially based on MS/MS fragmentation matches, identified features are color coded to provide an indication of the reliability and robustness of the identifications (Figure 5), which comprise of:
- Dark Green: the first proposed match is of high-confidence and based on a good MS/MS spectral matching. To achieve the dark green confidence level, the combination of the partial scores (i.e. mass score, isotopic pattern score, fragmentation score, and CCS score - when available) provides an overall score ≥ 80.
- Orange: the first proposed match is an identification awaiting approval/review typically due to a low fragment score value or because MS/MS information is not available in the database/dataset for a given metabolite. An orange background reflects an overall score ≤ 60.
- Red: unidentified.
- Light green: promoted-high identifications, other possible adducts or in-source fragmentations detected for co-eluted peaks of already identified metabolites. The check is performed considering RT, isotopic pattern, and trend across the samples.
In this example approximately 6000 compounds were putatively identified (orange or green) within the human urine HILIC analysis, using a downloaded HMDB database.7
 Figure 5. Shows an example of a high-confidence identification. In this example feature, m/z 138.0912@1.20 has been putatively identified as Tyramine. The structure and MS/MS spectrum can be viewed with the corresponding fragments highlighted in red and the precursor m/z highlighted in green.
MARS also contains a specific tool to automatically detect drugs and their metabolites. The search of these species in the samples set is very useful when the variation in the metabolome could be effected by prescription or non-prescription drugs, or when different treatment strategies are being investigated for tailored/personalised medicine regimes. Starting from the chemical structure of a drug as the input file, the structures of potential metabolites are generated by applying in silico common metabolic reactions. For each predicted metabolite, a m/z list is automatically generated considering user-defined ionization adducts and metabolites in the samples set are identified by a spectral matching approach.
In this study, the drug metabolite identification tool in MARS was used to identify the drug-related metabolites of cocaine, and these species were removed from the analysis to show the group separation without these high signal features. Figure 6 shows an example of a primary Cocaine metabolite: Benzoylecgonine, identified among the detected features by applying the drug metabolite identification tool in MARS.
 Figure 6. Benzoylecgonine metabolite was predicted from a cocaine SDF using drug metabolite identification functionality. Display above shows the identified metabolite, with its structure and extracted ion chromatograms (EIC) of this metabolite in the three levels of nicotine intake (L1 Red, L2 Blue, L3 Green).
Data Interpretation
Trend Analysis
Trend analysis is a powerful tool allowing compound abundances to be grouped by anticipated trends. In addition, the application of clustering algorithms and the “group by trend” features, enables the identification of potential biomarkers but also the inspection of new adducts or in‑source fragmentations. Figure 7 shows a number of metabolites and endogenous compounds with distinct differences across the three nicotine intake levels.
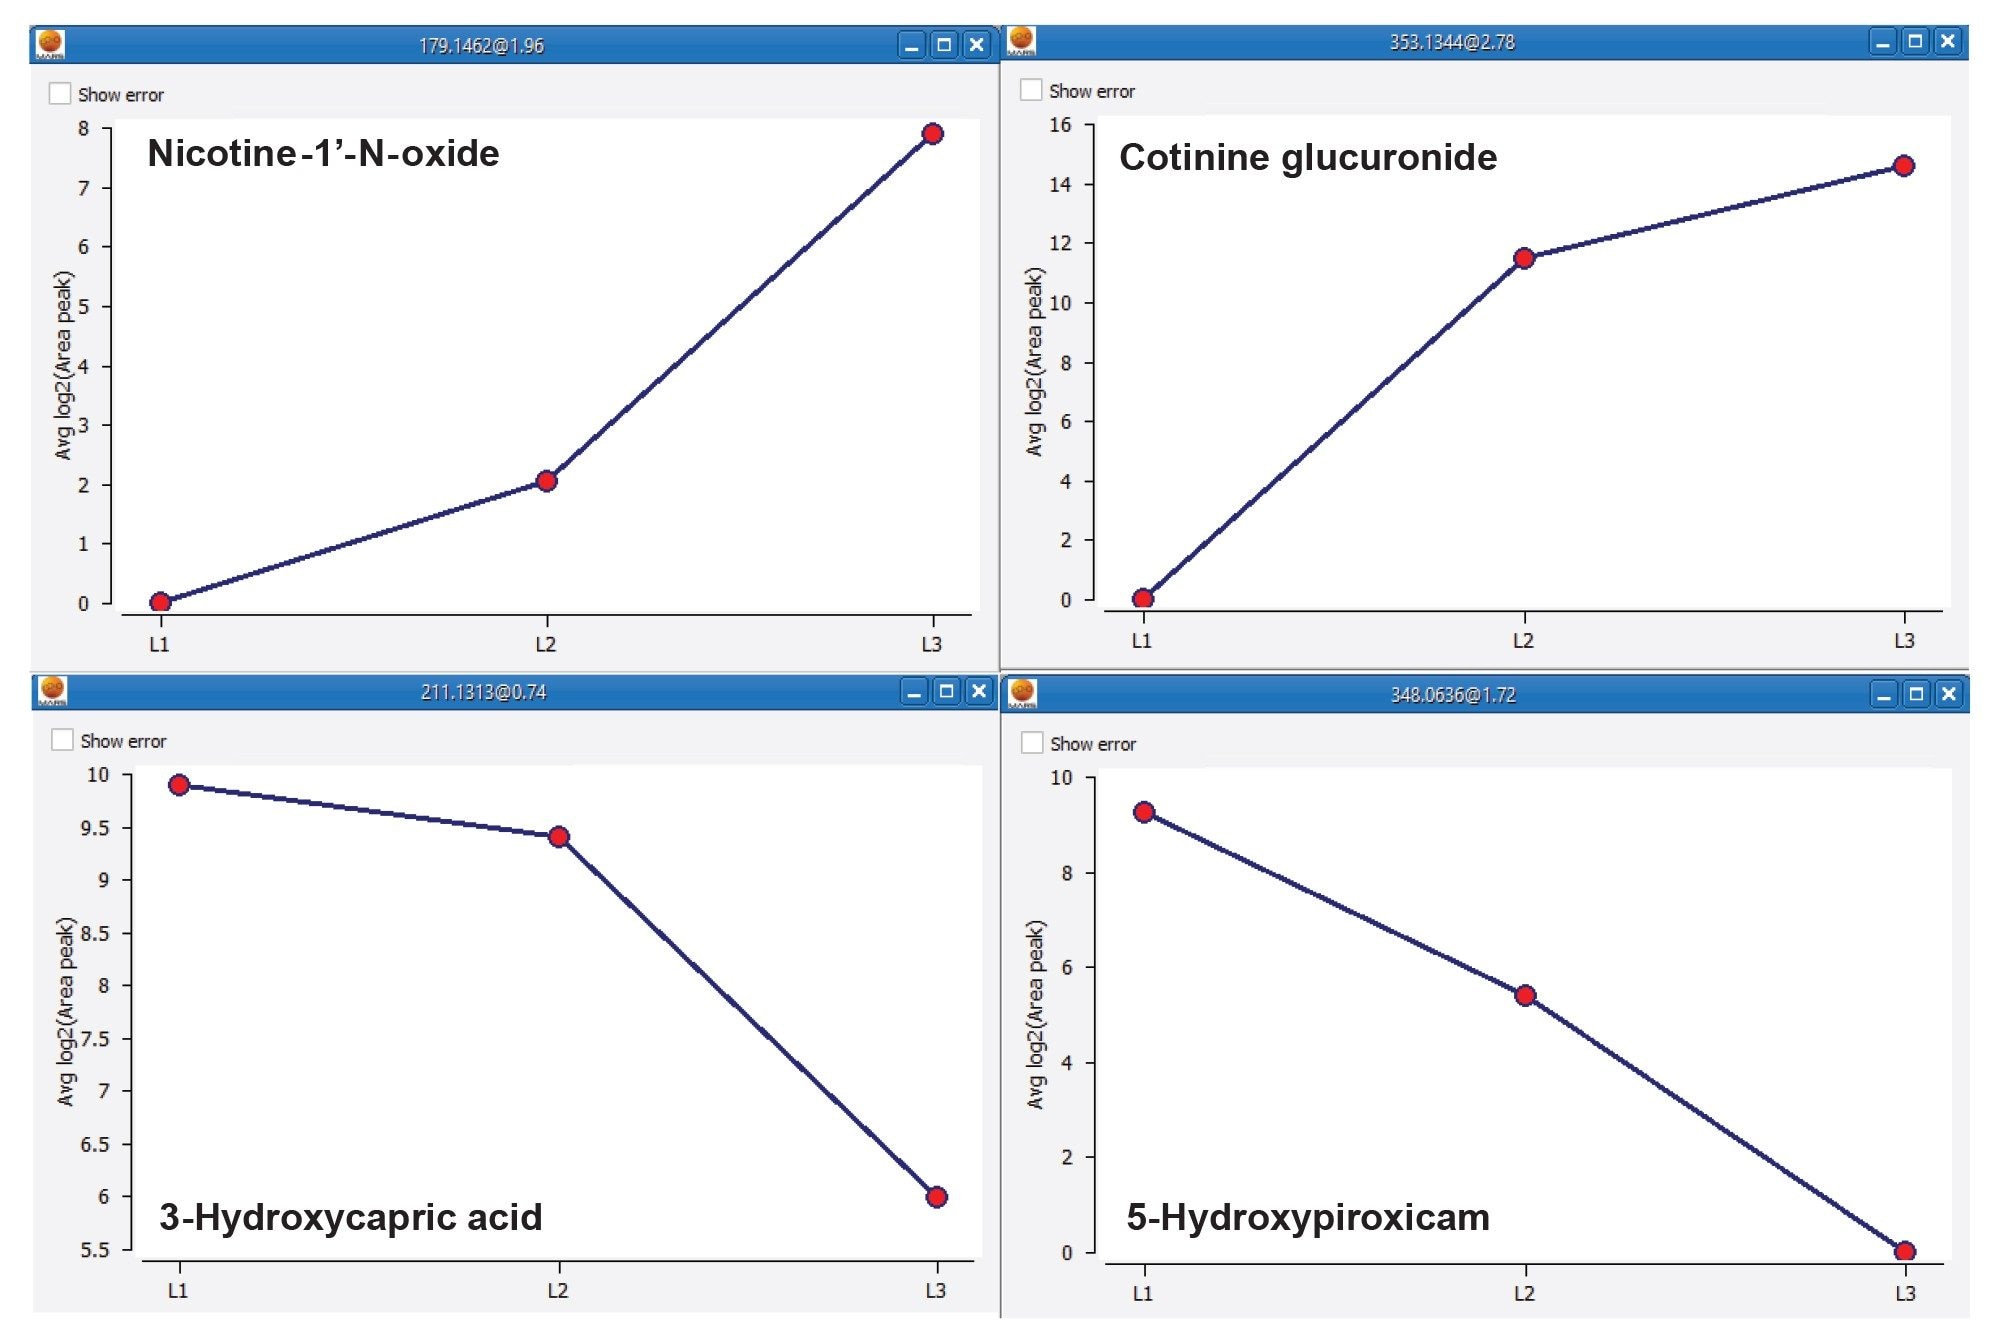 Figure 7. Abundance trend examples for metabolites and endogenous compounds over the three Nicotine intake levels showing suggested features of interest for separation of the three groups.
Following statistical analysis of the data sets to demonstrate fold change information for features of interest, absolute concentration is potentially a further step towards verification of feature significance. The MARS quantification tool can be used to quantify endogenous compounds from both targeted and untargeted experiments should there be a suitable concentration profile available for the compounds of interest. Allowing the scientist to either select the concentrations corresponding to the linearity range to refine the linear regression, or to apply the polynomial regression to the entire interval. Calibration curves for the various adducts of the calibrant may also be generated.
Pathways
The ability to map endogenous compounds to pathways is essential to understanding potential biological significance, allowing for mechanistic/process interpretation and hypothesis. MARS has a collection of typical endogenous human pathway maps (i.e. global map, and metabolic pathways) that can be linked either to the database or to the results of the previously performed identification. Figure 8 shows a portion of the Tyrosine metabolic pathway, with the putatively identified Tyramine highlighted.
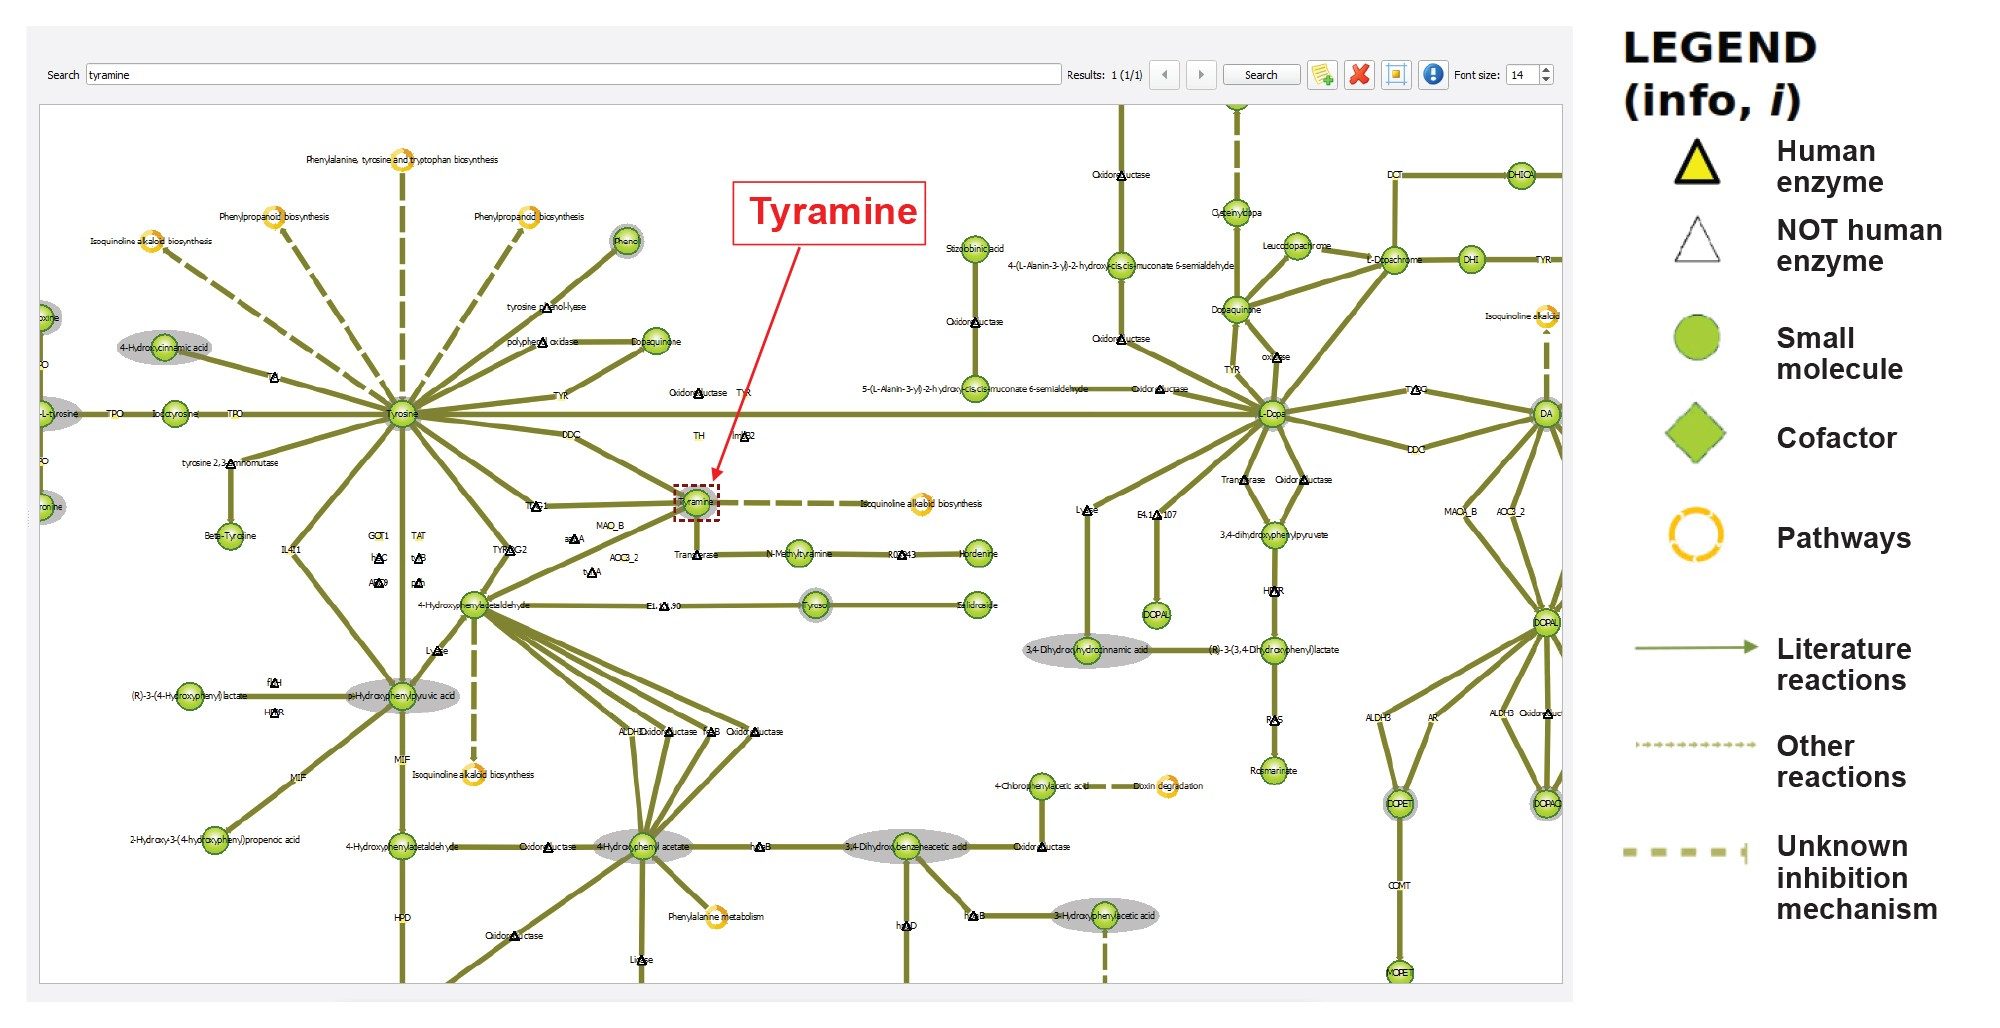 Figure 8. Portion of the metabolic pathway depicted in “Tyramine metabolism” map in MARS.
Conclusion
Describing the combination of HILIC UPLC, High Resolution Mass Spectrometry, and an intelligent workflow driven software allows for the rapid accurate metabolomic analysis of biological samples. The MARS Software enables accurate multivariate statistical analysis and identification of features of interest through database searches. Waters LC-MS datasets (DDA or DIA-based) acquired with either waters_connect or MassLynx Software can be directly processed in the MARS Software platform without the need to export datafiles. The workflow described above allows for the processing of metabolomic data and offers a flexible solution suited to discovery OMICS application questions. The Xevo G3 QTof coupled to an ACQUITY Premier System, a demonstrated excellent retention time and analyte detection stability as well as consistent mass accuracy measurement within ±5 ppm.
References
- Reproducibility and Robustness of the Xevo G3 QTof Mass Spectrometer for the Analysis of Large Cohort Studies. Waters Application Note. 720008274. 2024.
- Improved Transmission of Labile Species on the Xevo G3 QTof Mass Spectrometer with the StepWave™ XS. Waters Application Brief. 720007794. 2022.
- Sensitivity and Linear Dynamic Range of the Xevo G3 QTof. Waters Application Brief. 720008043. 2023.
- Beger RD, et al. Towards Quality Assurance and Quality Control in Untargeted Metabolomics Studies. Metabolomics. 2019 Jan 3; 15(1): 4.
- Evans AM, et al. on behalf of the Metabolomics Quality Assurance, Quality Control Consortium (mQACC). Dissemination and Analysis Of the Quality Assurance (QA) and Quality Control (QC) Practices Of LC-MS Based Untargeted Metabolomics Practitioners. Metabolomics. 2020 Oct 12; 16(10): 113.
- Laura Goracci, et al. MARS: A Multipurpose Software for Untargeted LC–MS-Based Metabolomics and Exposomics, Analytical Chemistry 2024 96 (4), 1468–1477. DOI: 10.1021/acs.analchem.3c03620
- David S Wishart, et al. HMDB 5.0: the Human Metabolome Database for 2022. Nucleic Acids Research, Volume 50, Issue D1, 7 January 2022, Pages D622–D631. https://doi.org/10.1093/nar/gkab1062
- Mass Bank of North America, UC Davis West Coast Metabolomics Center, Fiehn Laboratory, University of California, Davis. https://mona.fiehnlab.ucdavis.edu/
- David S Wishart, et al. MiMeDB: The Human Microbial Metabolome Database. Nucleic Acids Research, Volume 51, Issue D1, 6 January 2023, Pages D611–D620. https://doi.org/10.1093/nar/gkac868
720008397, June 2024