The Application of Cyclic Ion Mobility to Non-targeted Analysis of Per- and Polyfluoroalkyl substances (PFAS) in Environmental Samples
Abstract
Per- and polyfluoroalkyl substances (PFAS) are a group of synthetic compounds that have been identified as a class of environmental contaminants of high concern. As new regulations on the use and manufacture of legacy PFAS are imposed, alternative replacement PFAS compounds have emerged. In addition, remediation efforts for PFAS contamination may create new fluorinated compounds. Targeted analysis methods using tandem quadrupole mass spectrometry play an important role for regulatory methods looking at a relatively short list of legacy and emerging PFAS. Non-targeted analysis (NTA) with high-resolution mass spectrometry (HRMS) is a powerful, complementary technique for the discovery and identification of new PFAS. Here, HRMS was coupled with liquid chromatography and ion mobility separation using the SELECT SERIES™ Cyclic™ IMS mass spectrometer to improve the number of detected features in complex environmental samples. The workflow presented in this application note utilized software tools for the confident identification of known PFAS and the discovery of a previously unreported series of PFAS in environmental water samples.
Benefits
- Confident identification of known PFAS in complex matrices based on accurate mass, retention time, expected fragment ions and collision cross section (CCS)
- Discovery of new PFAS utilizing an IMS-based filter designed for the unique chemistry of PFAS
- Improved structural elucidation of known and unknown compounds by additional spectral alignment with ion mobility separation
Introduction
Per- and polyfluoroalkyl substances (PFAS) are a group of commonly used compounds in industrial and consumer goods, known particularly for their hydrophobic and non-stick properties. The chemistry of PFAS includes a carbon backbone with multiple fluorine atoms. The strength of the carbon-fluorine bond makes these compounds resistant to degradation and earning them the nickname ‘forever chemicals'. PFAS are of growing concern due to their potential negative health effects. The two most notorious PFAS, perfluorooctanoic acid (PFOA) and perfluorooctane sulfonate (PFOS), have been banned for use and production in most of the world. More widespread bans are anticipated as the potential health risks associated with certain PFAS become better understood. In response to regulations, chemical manufacturers have utilized different chain lengths or alternative functional groups to maintain the benefits of PFAS while mitigating the potential health risks.
The estimated number of PFAS has grown to over 10,000 (and depending on the definition used for PFAS that number could be as high as seven million) that have been created/used.1–2 While targeted techniques are able to detect these compounds at low levels, the number of current targets is limited. Even the latest methods in the United States: EPA method 1633 and ASTM D8421 have target lists of 40 and 44 PFAS respectively; a small fraction of the possible PFAS in environmental samples.3–4 For the detection and identification of both known and new PFAS in a sample, non-targeted analysis (NTA) with high resolution mass spectrometry (HRMS) is a powerful technique.5
In this application note, NTA of environmental samples for the detection and identification of new and unexpected PFAS was performed using the SELECT SERIES Cyclic IMS mass spectrometer coupled to an ACQUITY™ UPLC™ System that included the PFAS solution kit to control for PFAS background contamination. Ion mobility spectrometry (IMS) is a gas phase separation of ions based on their size, shape, and charge. The addition of IMS is beneficial for NTA of complex samples because it adds an extra dimension of separation and increased system peak capacity. Measurements of IMS drift time can be correlated to collision cross section (CCS, typically measured in Å.2) Which can be used as an additional identification metric related to ion shape.6–7 An advantage for the SELECT SERIES Cyclic IMS platform is the ability to customize the IMS separation with the interactive software control. For this analysis, IMS parameters were tuned to obtain the best IMS separation for ions with shorter drift times (small molecules and halogenated compounds) in a single pass of the cyclic device. As PFAS may be present at low levels in complex samples, a data independent acquisition (HDMSE) was utilized to get as much information as possible in a single injection. Detected peaks were first compared to an internal HRMS PFAS library for identification. Unidentified peaks were selected for further scrutiny based on their detected drift time in the ion mobility dimension.
Experimental
Sample Description
The environmental samples were prepared and analyzed previously in accordance with EPA method 1633.3 Sample preparation details and targeted analysis results are reported in Waters™ application note 720008118. All standards used (target analytes, extracted internal standards, and non-extracted internal standards) were obtained from Wellington Laboratories. The environmental samples were analyzed concurrently with a solvent blank and standard mix of 30 PFAS (PFAC30PAR native PFAS solution/mixture from Wellington Laboratories).
Environmental samples discussed in this application note include surface water that was collected locally as well as influent and effluent wastewater that were kindly provided by a treatment facility in the Midwest United States.
MS Conditions
The system utilized for this analysis included an ACQUITY UPLC I-Class Plus that had been fitted with the PFAS Solution kit (p/n: 176004548) and a SELECT SERIES Cyclic IMS mass spectrometer. The LC separation utilized Atlantis™ Premier BEH™ C18 AX mixed mode columns as both the isolator and analytical columns. Previous work has demonstrated that the mixed mode chemistry is beneficial in the analysis of PFAS especially for the detection of short chain compounds.9 The MS was operated with negative ion electrospray over the mass range of m/z 50–1200. Data were acquired using HDMSE with a single pass of the Cyclic IMS cell and a collision energy ramp (10–40 eV) in the transfer cell.
LC Conditions
|
LC system: |
ACQUITY UPLC I-Class PLUS modified with PFAS Kit |
|
Vials: |
Polypropylene vials with polyethylene caps (p/n: 186005230) |
|
Isolator column: |
Atlantis™ Premier BEH C18 AX 2.5 µm, 2.1 x 50 mm (p/n: 186009390) |
|
Analytical column: |
Atlantis Premier BEH C18 AX 1.7 µm, 2.1 x 100 mm (p/n: 186009368) |
|
Column temperature: |
35 °C |
|
Sample temperature: |
10 °C |
|
Injection volume: |
25 µL |
|
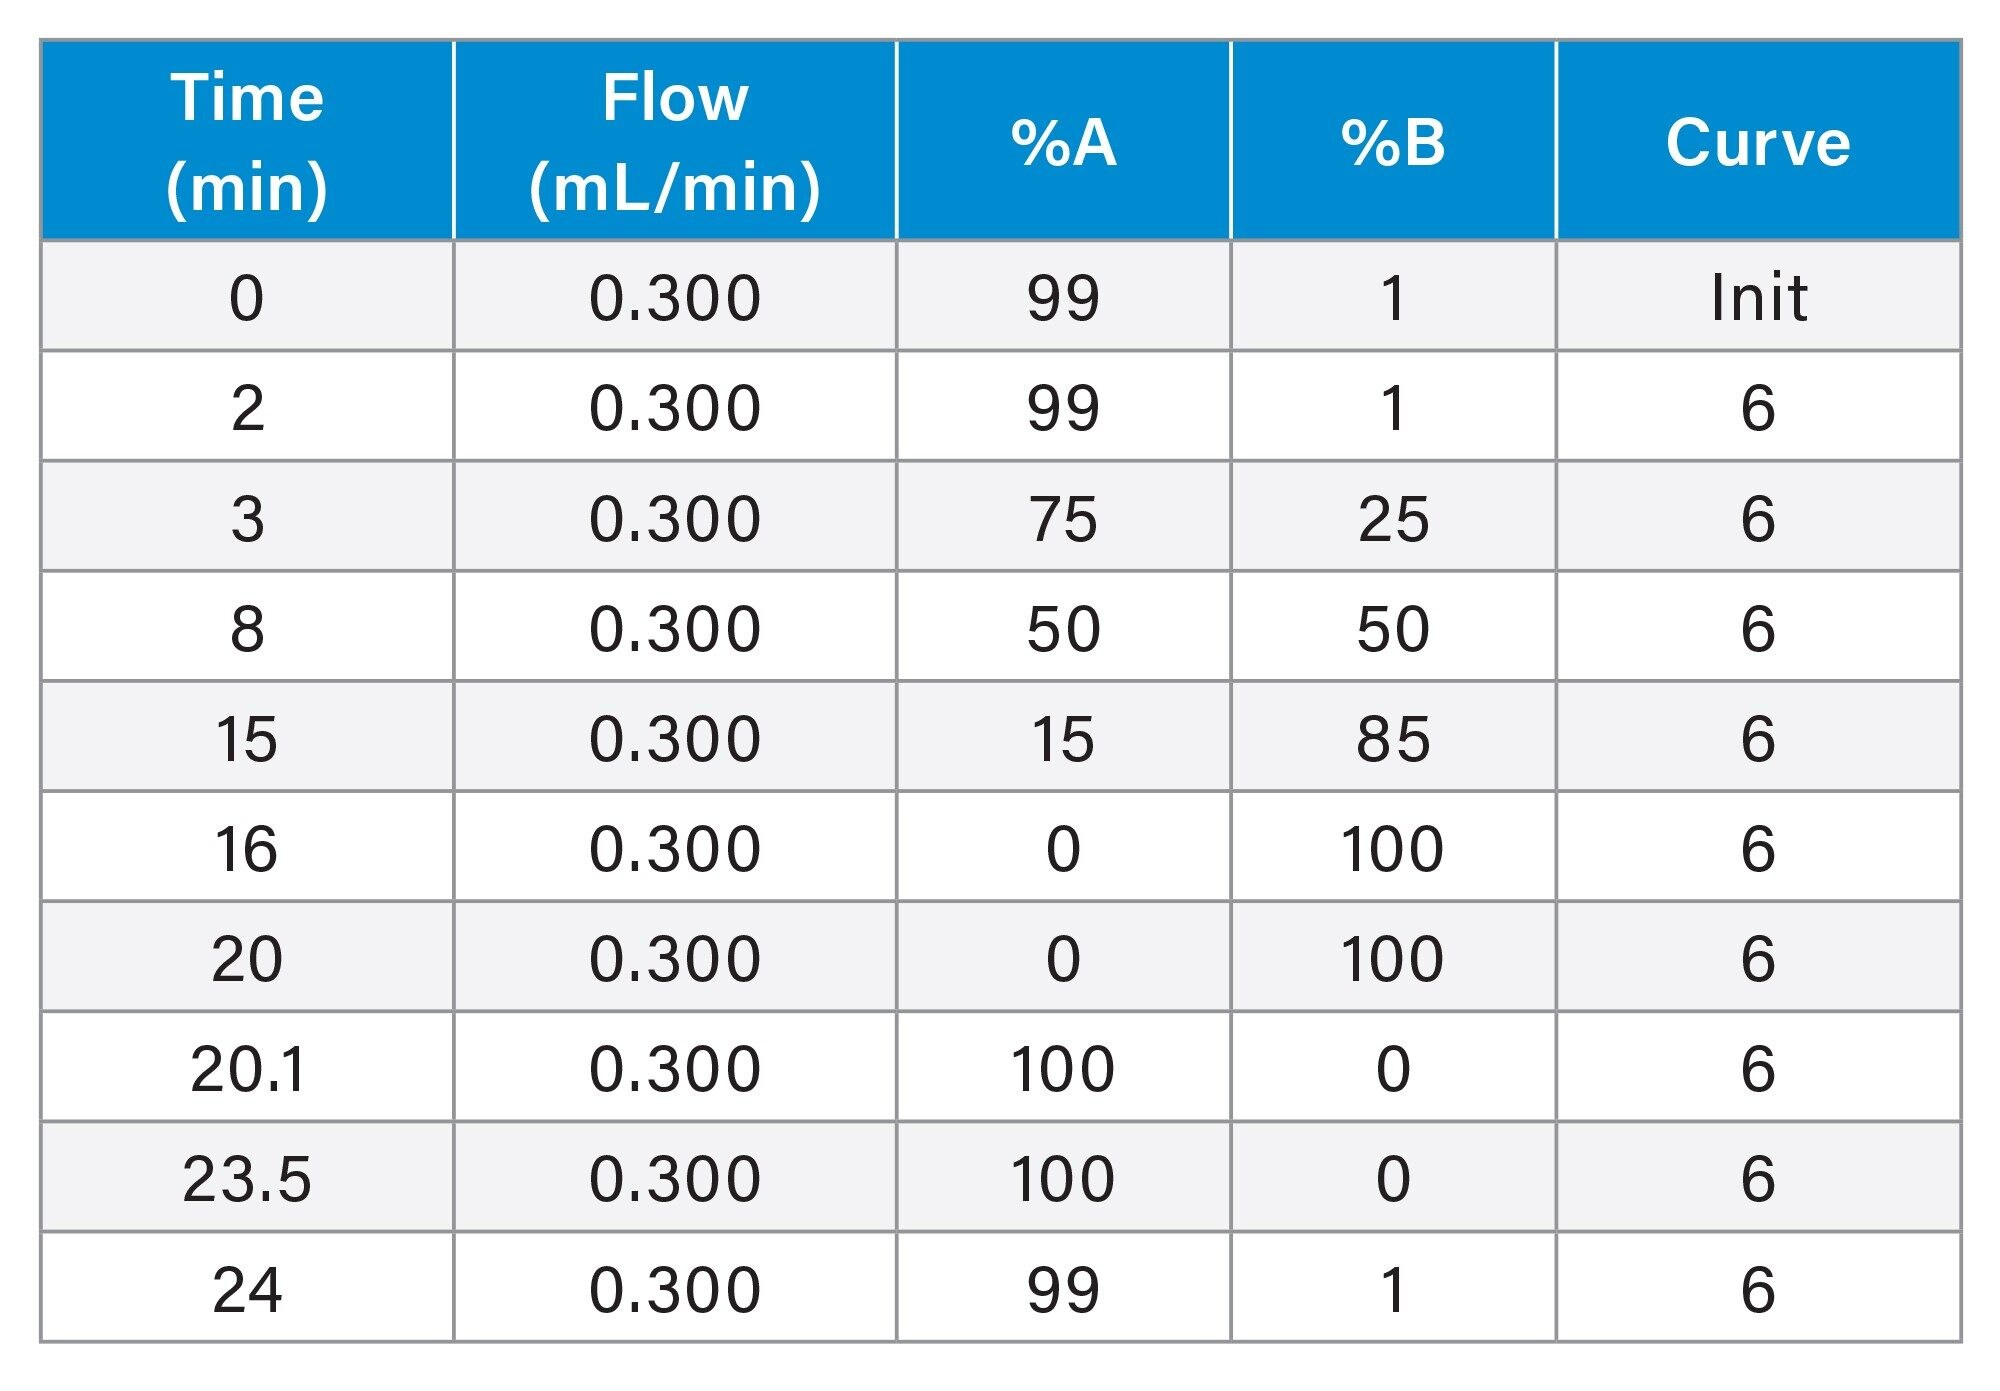
Flow rate: |
0.3 mL/min |
|
Mobile phase A: |
2 mM ammonium acetate in water |
|
Mobile phase B: |
0.1% (v/v) ammonium hydroxide in methanol |
Gradient Table
MS Conditions
|
MS System: |
SELECT SERIES Cyclic IMS |
|
Ionization mode: |
ESI- |
|
Capillary voltage: |
0.5 kV |
|
Cone voltage: |
10 V |
|
Acquisition mode: |
HDMSE |
|
Acquisition range: |
m/z 50–1200 |
|
Collision energy: |
Low: 4 eV High: 10–40 eV |
|
Mass resolution: |
V Mode (60,000 FWHM) |
|
IMS resolution: |
Single Pass, ~65 FWHM |
|
IMS TW static height: |
15 V |
|
IMS cycle time: |
51.6 ms |
Data Management
Data were acquired using MassLynx™ software (version: 4.2) and processed in the UNIFI™ application of the waters_connect™ platform (version: 3.2).
Libraries of Known PFAS for Suspect Screening
Detection of PFAS in the environmental samples was based on comparison with an application specific UNIFI scientific library for suspect screening of PFAS that contains over 100 compounds.10 Each library entry includes compound name, formula, structure, and experimentally-derived detection results from the analysis of reference standards. In the course of this study, the observed retention time and CCS values were updated in the library for thirty compounds in the Wellington PFAC30PAR native PFAS solution/mixture. Additional suspect PFAS were screened against a theoretically generated PFAS library and the EPA CompTox list of PFAS structures.2,10
Results and Discussion
The schematic in Figure 1 describes the workflow utilized in this study. The experiments described were qualitative and used only to determine which PFAS were detected in the three samples. A data-independent acquisition was done with HDMSE that gives accurate mass measurements of precursor and product ions as well as CCS in a single injection. An accurate mass screening with IMS analysis method within the UNIFI application in waters_connect was used for the data processing. The 4D peak picking, alignment of high and low CE energy data, and comparison with the target library are all done automatically within the application. The detected peaks can then be separated into two categories: those that matched the target list (identified) and those that did not match (candidates). The target list of PFAS for suspect screening contained around 100 compounds that had been previously analyzed by HRMS.10 Detected peaks that did not match the target list (candidates) still have accurate mass measurement, high and low CE spectral alignment, and CCS measurements that can be used for database searching. The list of candidates for each injection can be numerous and further filtering was used to limit the list for identification of possible PFAS.
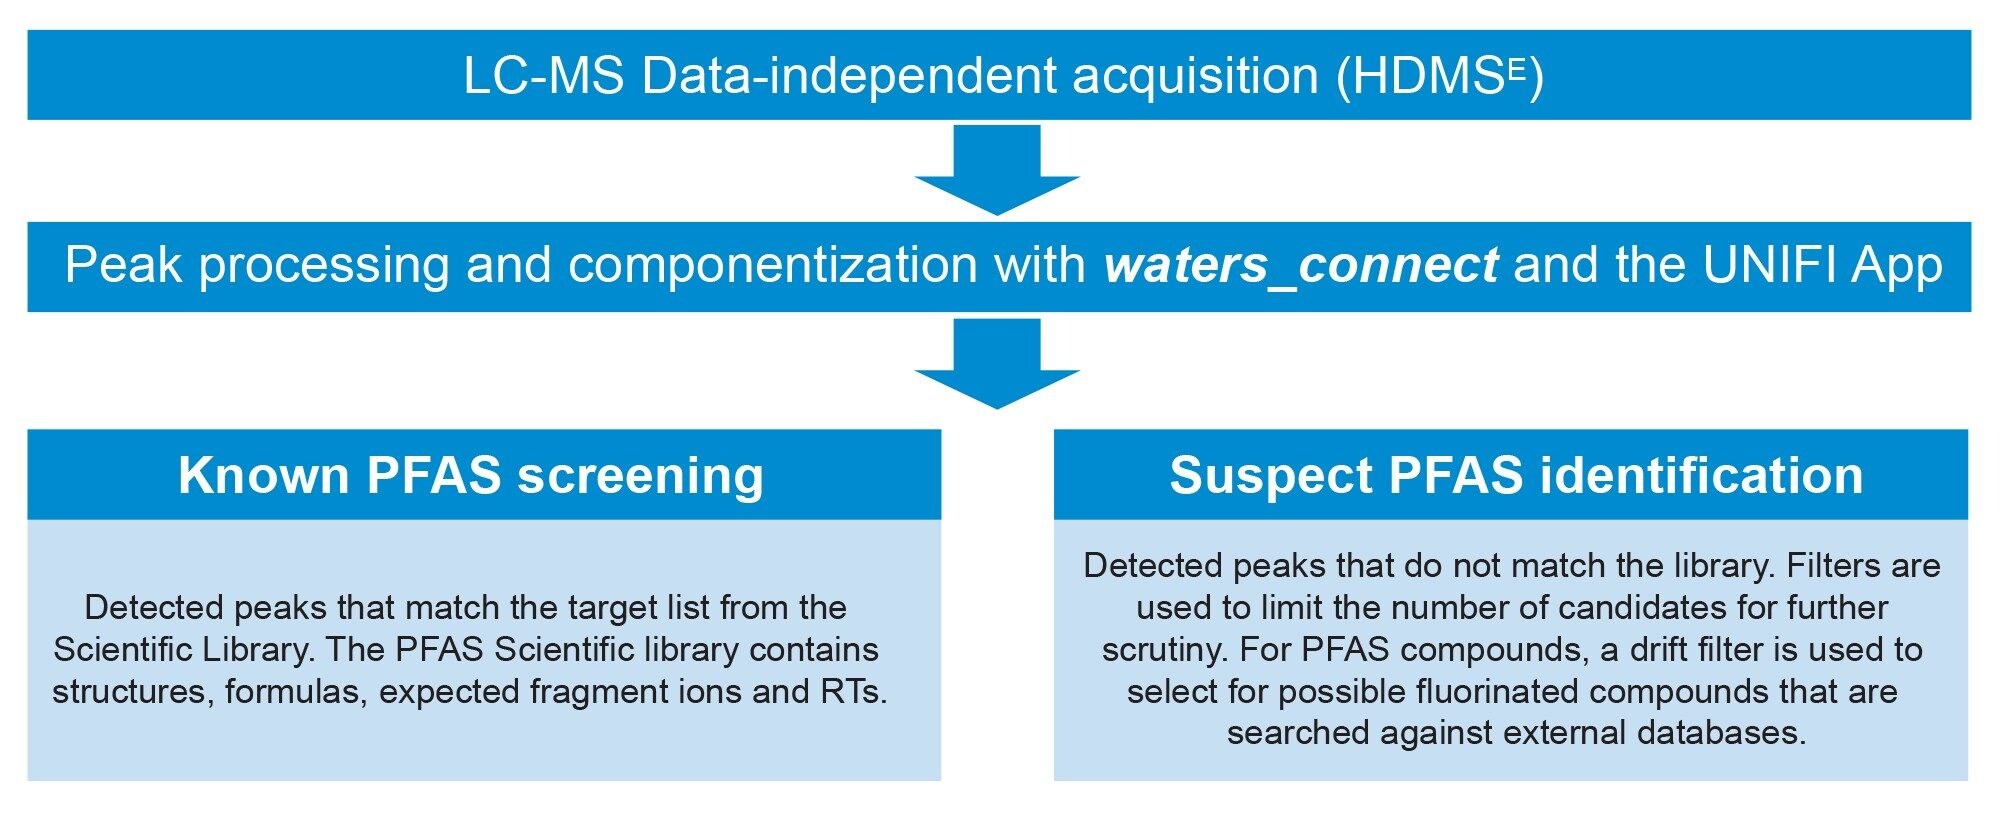 Figure 1. Schematic of the methodology used for PFAS identification in environmental samples with LC-IMS-MS.
Identifications of known PFAS in the samples were based on accurate mass (<5 ppm), identified fragments, and RT error. Observed collisional cross section (CCS) values were also compared to the measured CCS of PFAS standards to confirm identifications. In the confidence scale suggested by Charbonnet et al, these compounds would rank as level 1 or 2a.11 In the water samples, several legacy PFAS including perfluoroalkyl sulfonic acids (PFSAs), perfluoroalkyl carboxylic acids (PFCAs), and fluorotelomer sulfonates (FTS) were identified. For reporting purposes, these compounds were either not detected in the solvent blank or had peak responses greater than three times what was found in the blank injection. Figure 2 shows the compounds identified from the target list in the surface water sample. Confident identification of the short chain PFCAs is difficult because the deprotonated ion is typically not observed and they do not have many diagnostic fragment ions (two of the short chain PFCAS: PFBA and PFPeA often only have one MRM transition monitored for targeted analysis). The ion observed with LC-IMS-HRMS for the short-chain PFCAs is the decarboxylated ion [M-H-CO2]- which is the fragment monitored in targeted analyses. The additional identifying feature of CCS in these experiments improves the confidence in short-chain PFCAs identification when compared against an authentic standard. For example, the identification of PFBA in the surface water sample was based on the detected [M-H-CO2]- ion that had accurate mass measurement of m/z 168.9902 (mass error 0.8 ma or 4.7 ppm) with retention time error of 0.11 min and a measured CCS deviation of -0.35% from that of the PFBA standard. Therefore, the PFBA identification had three identification metrics that matched the authentic standard.
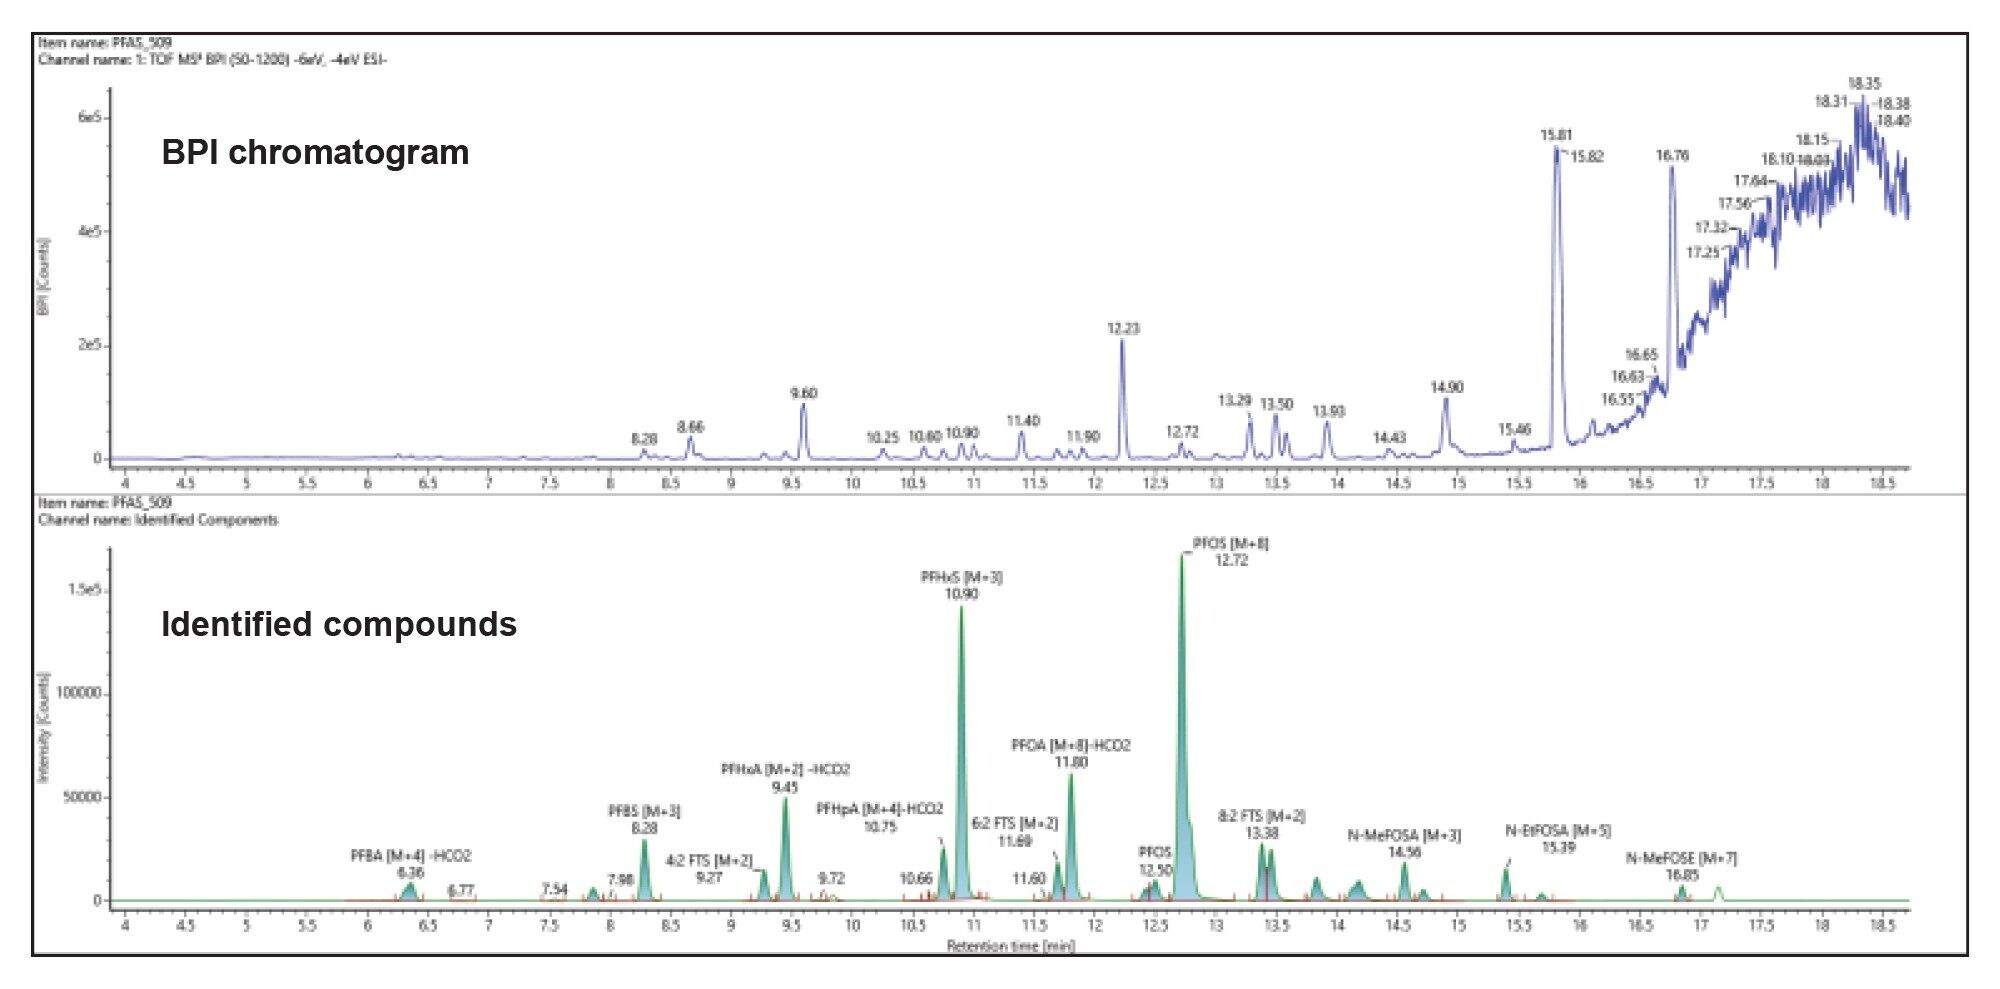 Figure 2. Comparison of the base peak intensity (BPI) chromatogram (top) and the identified compounds (bottom) found in the surface water sample.
A benefit of ion mobility for NTA is that it enables spectral cleanup by aligning components by their retention and drift time (Figure 3). With HDMSE, fragmentation by CID occurs in the transfer cell after the IMS separation and precursor and fragment ions have the same observed drift time. Low and high collision energy (CE) spectra become cleaner as chromatographically-coeluting ions with different drift times can be removed. This spectral clarity aids in elucidating unknown compounds and confirmation of known target compounds.
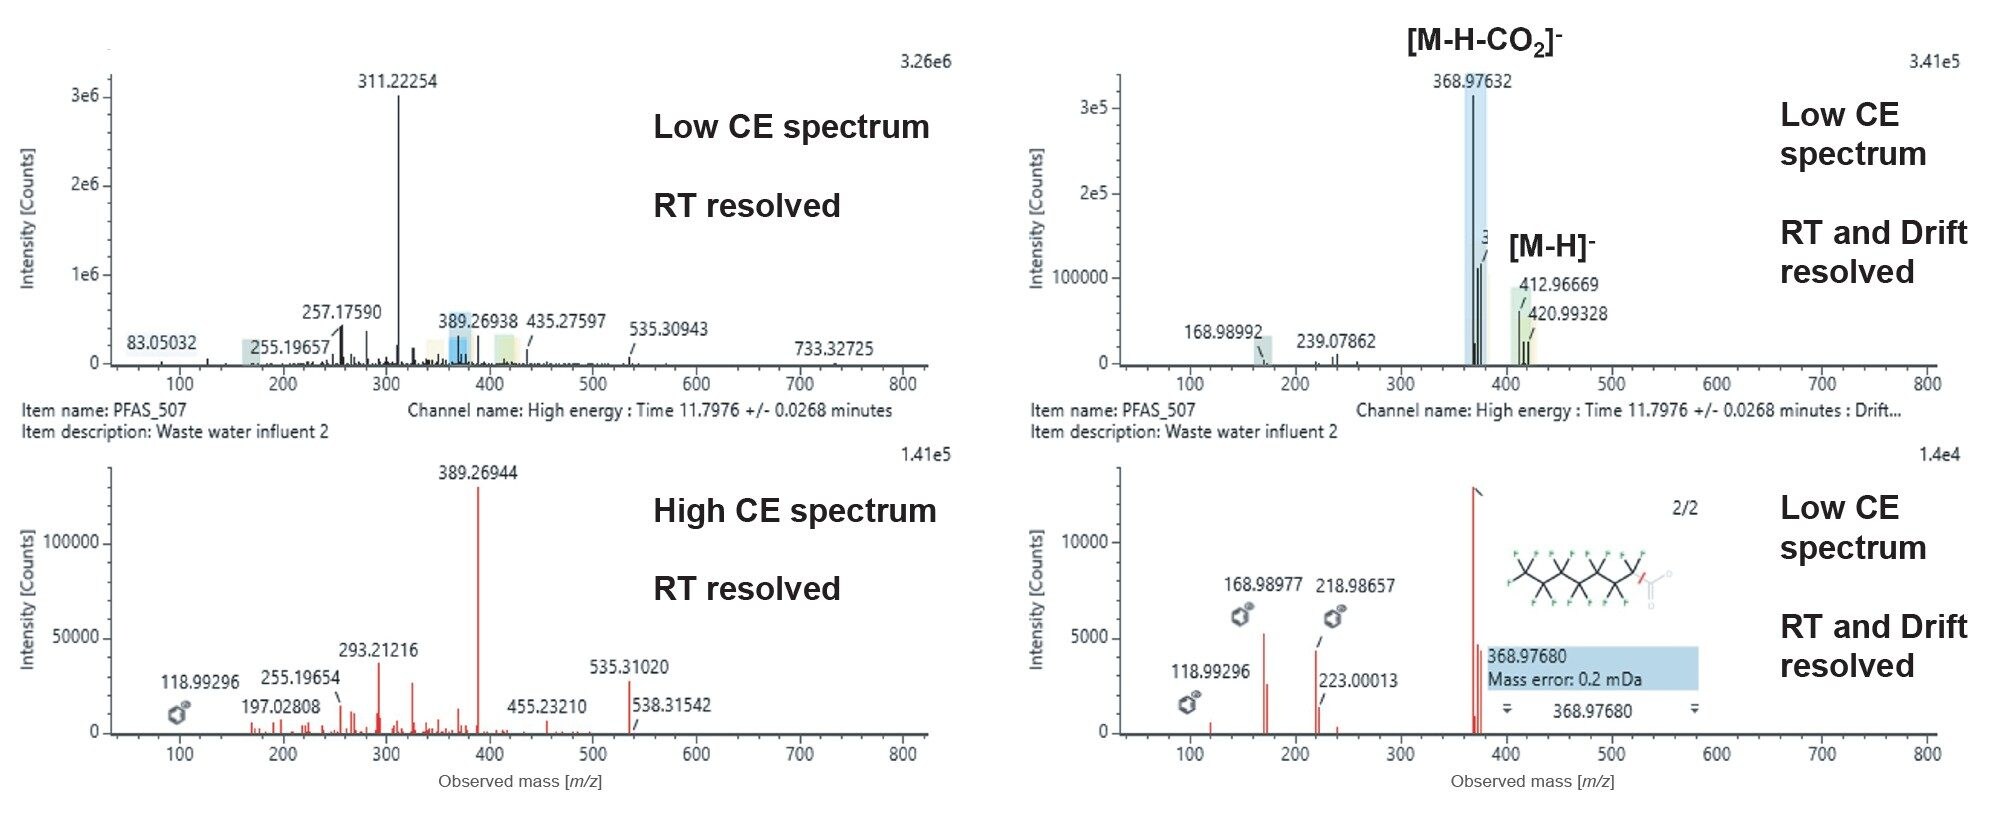 Figure 3. Low and high CE spectra for PFOA in the wastewater influent sample. Left are the spectra with alignment by retention time only and Right are the cleaner spectra having undergone retention time and drift time alignment. Fragment ions in the high CE spectrum can be associated with PFOA and the isotopically labeled standard.
In addition to the PFAS found previously, there were compounds identified in the wastewater samples that were not included as targets in EPA method 1633. These compounds included: perfluoropropane sulfonic acid (PFprS), perfluorobutane sulfonamide (FBSA), perfluoroethylcyclohexane sulfonate (PFeCHS), 6:2 fluorotelomer phosphate diester (6:2 diPAP), and 6:2/8:2 fluorotelomer phosphate diester (6:2/8:2 diPAP). Figure 4 shows the XIC and spectra for 6:2 diPAP in the wastewater influent sample. The library entry for 6:2 diPAP had an expected fragment ion that was observed in the high CE spectrum, making its identification confidence level 2b (probable by diagnostic fragmentation evidence) in the confidence scale suggested by Charbonnet et al.11
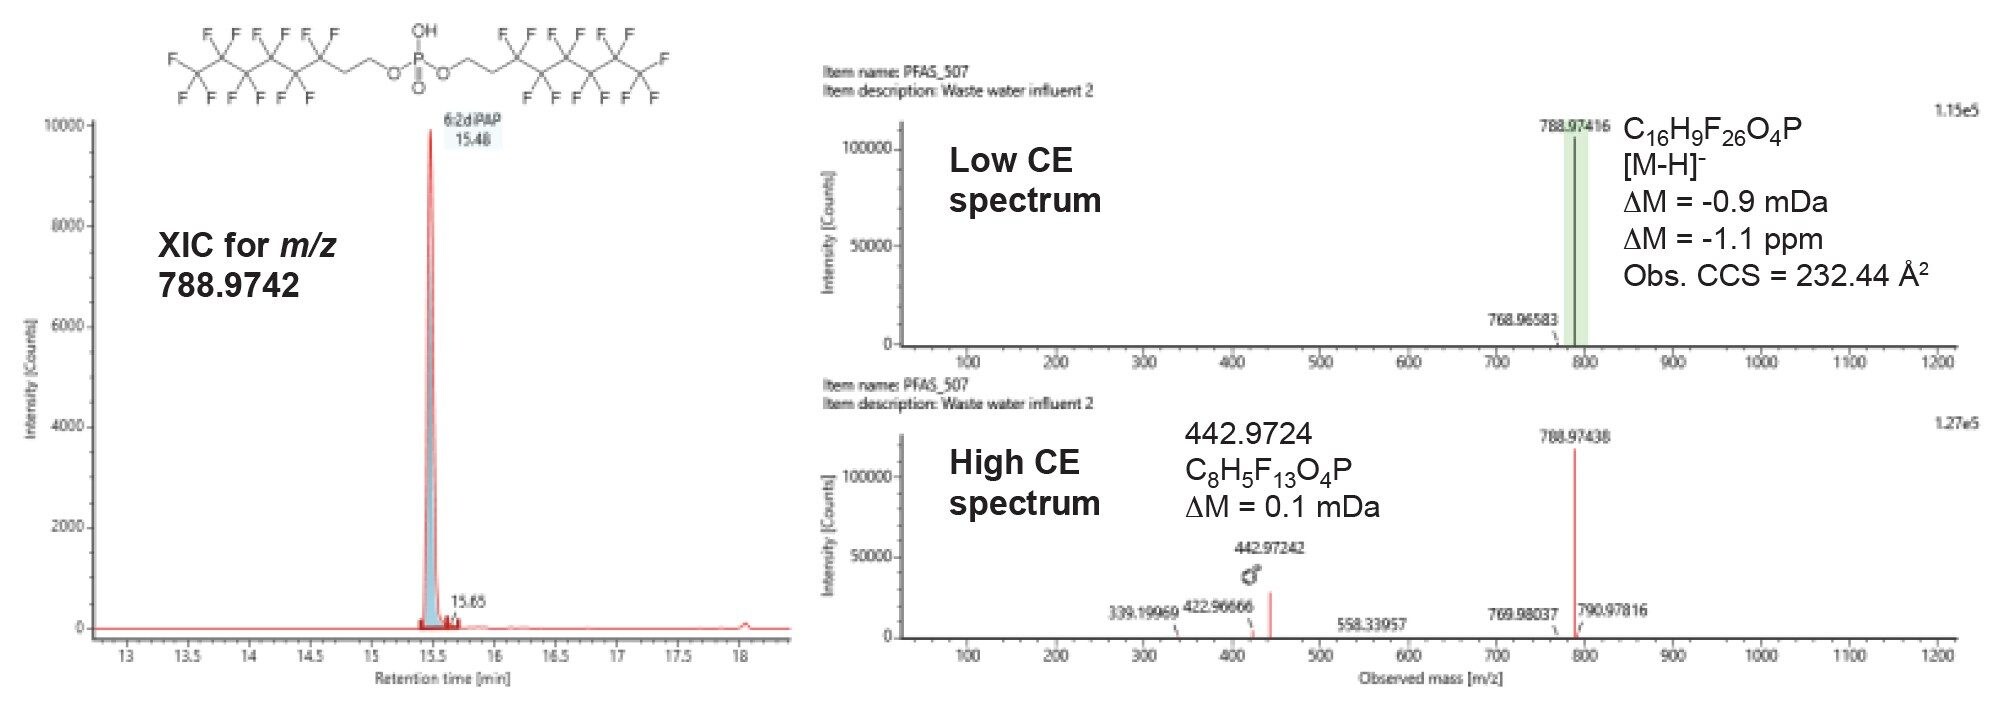 Figure 4. Chromatogram and spectra for 6:2 fluorotelomer phosphate diester (6:2 diPAP), a compound that was found in the wastewater influent sample with known PFAS screening. The expected fragment ion in the HRMS PFAS library was matched in the high CE spectrum.
One challenge with non-targeted screening is being able to find unknown PFAS among thousands of detected features in an LC-MS chromatogram. Previous strategies for finding fluorinated compounds include Kendrick Mass Defect plots, common fragment searching, and mass defect filtering. For this study, ion mobility was used to filter for potentially fluorinated or halogenated compounds. Previous studies have demonstrated that compounds that contain halogens like fluorine have smaller CCS values compared to nonhalogenated organic molecules of similar m/z.12–14 MacNeil et al. demonstrated that unknown PFAS compounds could be revealed by selecting ions that were relatively compact for their observed m/z.14 This strategy was utilized in that study and six previously unreported PFAS compounds were identified in a reference material, NIST SRM 2585 by GC-IMS-HRMS. A similar strategy was employed here where detected features were filtered by observed m/z and drift time (Figure 5). The ion mobility data viewer tool in UNIFI was used to select for this drift region and create the filter.
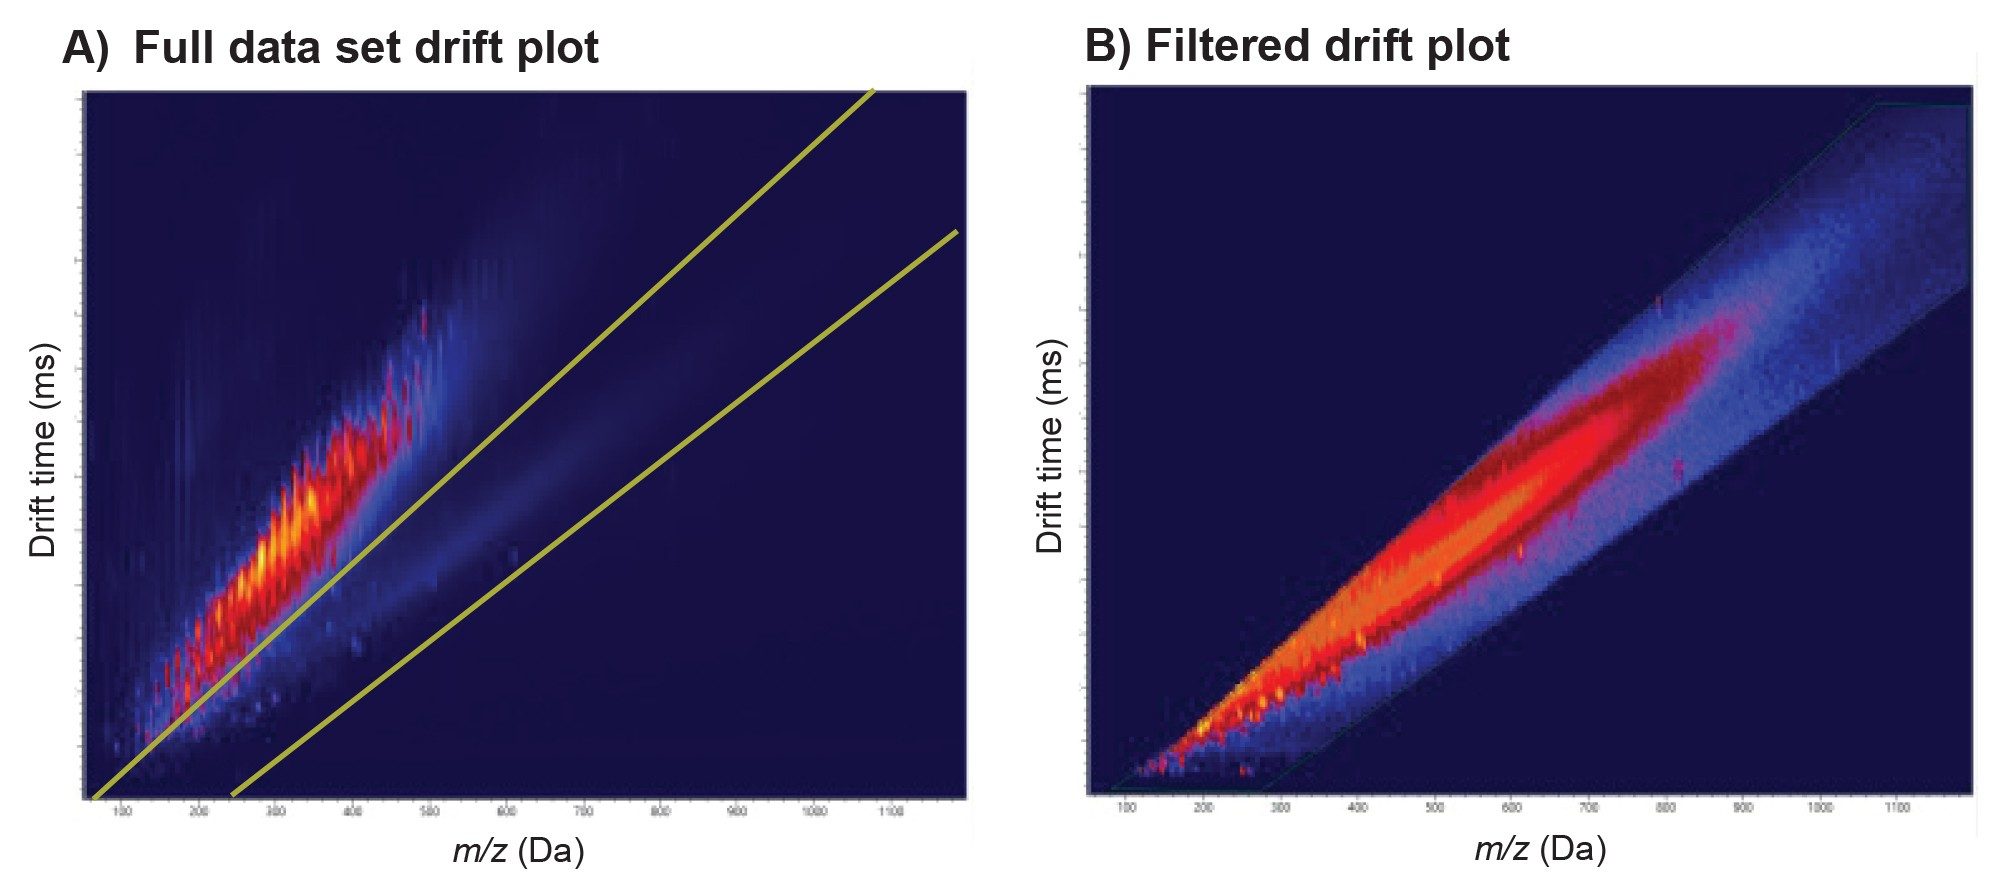 Figure 5. Top: Plots of drift time versus mass to charge (m/z) for the A) full data set for the effluent wastewater sample and B) filtered (area depicted in frame A within the yellow lines) for potential PFAS compounds. Bottom: C) Comparison of the base peak intensity chromatogram for the wastewater effluent sample before (top) and after (bottom) drift time and m/z filter was applied.
 Figure 5. Top: Plots of drift time versus mass to charge (m/z) for the A) full data set for the effluent wastewater sample and B) filtered (area depicted in frame A within the yellow lines) for potential PFAS compounds. Bottom: C) Comparison of the base peak intensity chromatogram for the wastewater effluent sample before (top) and after (bottom) drift time and m/z filter was applied.
The drift time and m/z filter was applied to the processed peak list in the data review workflow. A candidate that passed the filter in the waste water influent sample is shown in Figure 6. Applying the drift time and m/z filter to the processed data set reduced the number of candidate peaks from over 10,000 unidentified features to <300 for each injection. The number of candidates for further scrutiny can be prioritized using intensity, mass error, common fragment ions, and isotope patterns. Although the filter was aimed to find fluorinated compounds, other halogenated compounds also pass, and many of the candidates were chlorinated or brominated contaminants.
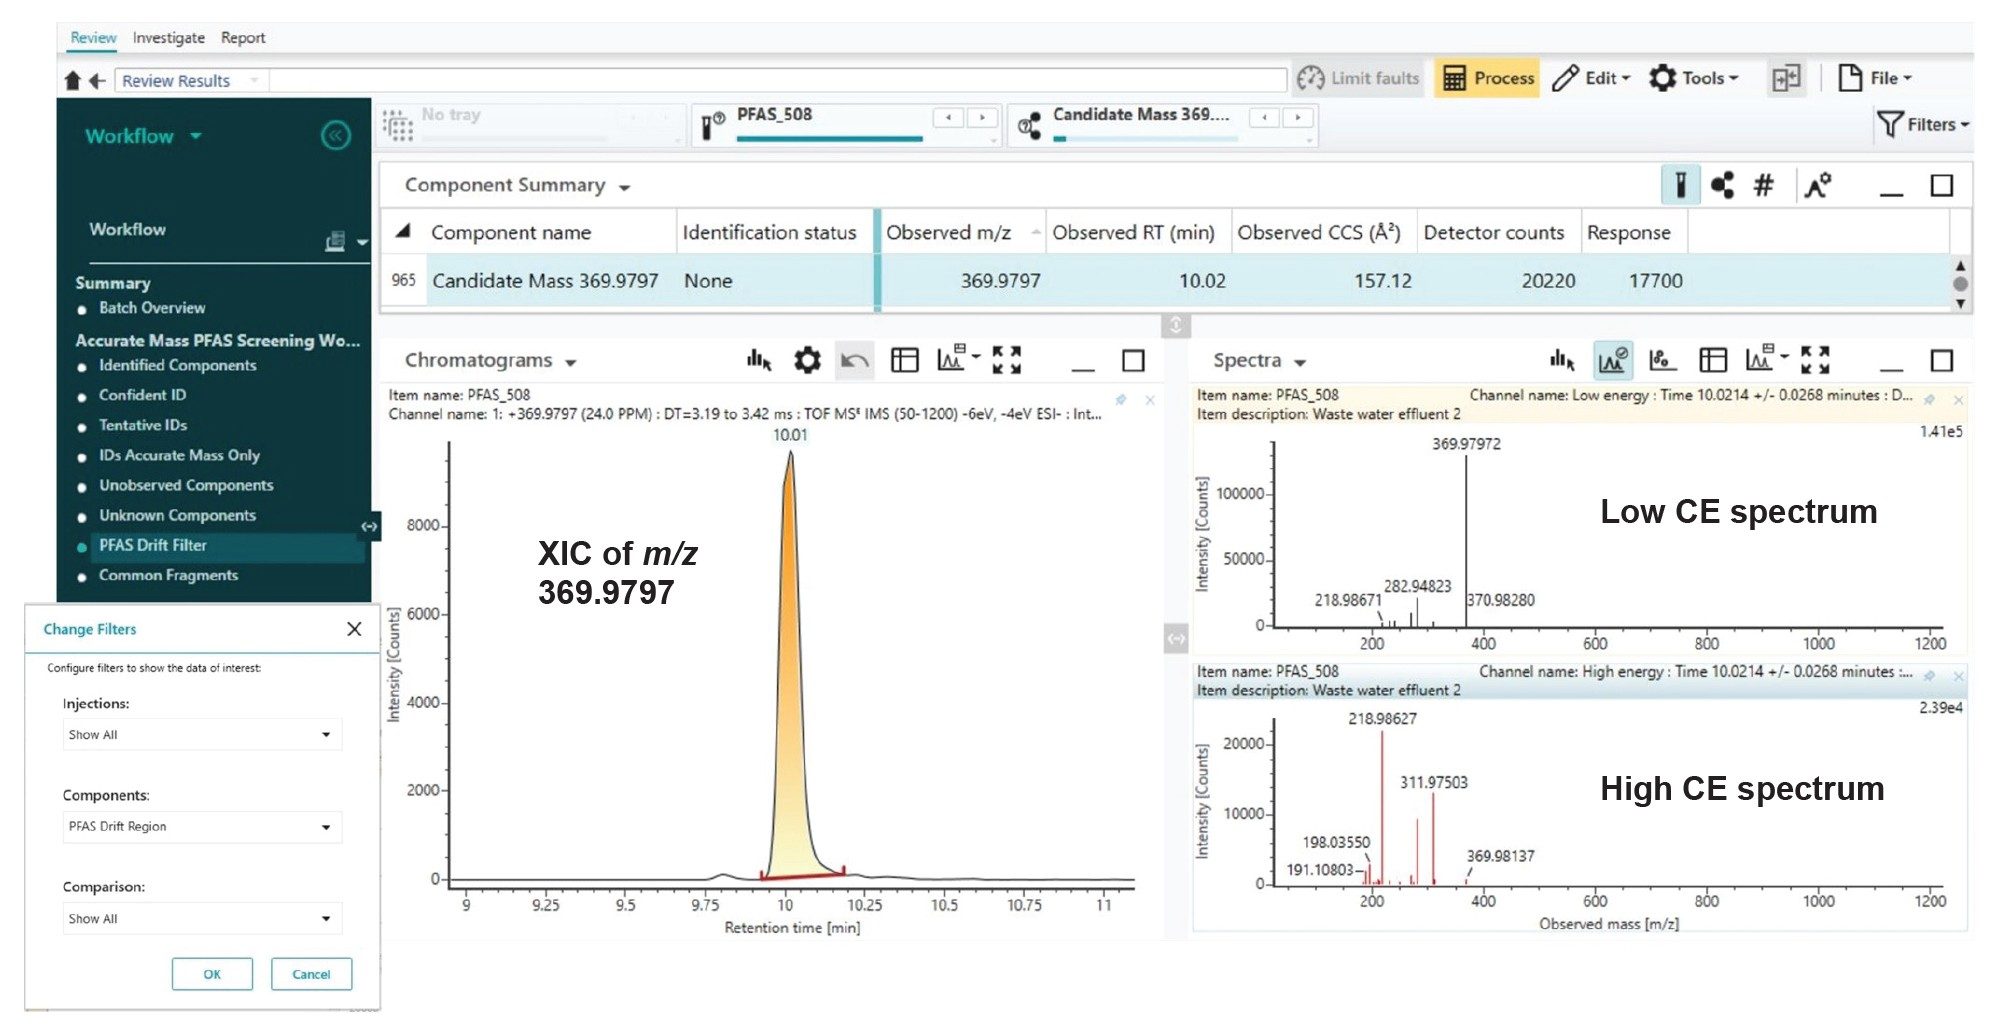 Figure 6. An example of a candidate compound (m/z 369.979, RT 10.01 min) revealed in the wastewater influent sample using the drift time vs m/z filter. The low and high CE spectra are aligned by RT and drift time for candidates and are used for structural elucidation with tools in UNIFI.
The high intensity candidate that passed the drift time and m/z filter in the wastewater effluent sample was tentatively identified as N-methyl perfluorobutane sulfonamidoacetic acid (MeFBSAA) (Figure 7). This compound has been detected previously in environmental samples.15–16 And is similar in structure to the known PFAS N-methylperfluorooctane sulfonamidoacetic acid (N-MeFOSAA), which is included in the target lists for EPA 1633 and ASTM D8421. The high CE spectrum for MeFBSAA included fragment ions that experienced the same neutral losses as the library spectrum of N-MeFOSAA: loss of C2H3O2, loss of C3H6NO2, and loss of C3H6NO4S (Figure 8). The confidence in the assignment of this candidate as MeFBSAA would be level 2b: probable by diagnostic fragmentation evidence.11 While it was found in both wastewater samples, the detected peak area of MeFBSAA in the effluent sample was higher than the influent sample.
![Elemental composition calculator results for the candidate at m/z 369.9797. The best fit formula was C7H6F9NO4S based on i-FIT confidence (isotopic pattern algorithm used to score each formula). B) The formula was searched on the CompTox Dashboard for possible PFAS structures as it did not match the experimental or theoretical PFAS libraries. A hit for the molecular formula was N-methyl-N-[(perfluorobutyl)sulfonyl]glycine or N-methyl perfluorobutane sulfonamidoacetic acid (MeFBSAA)](/content/dam/waters/en/app-notes/2024/720008269/720008269en-f7.jpg.82.resize/img.jpg) Figure 7. A) Elemental composition calculator results for the candidate at m/z 369.9797. The best fit formula was C7H6F9NO4S based on i-FIT confidence (isotopic pattern algorithm used to score each formula). B) The formula was searched on the CompTox Dashboard for possible PFAS structures as it did not match the experimental or theoretical PFAS libraries. A hit for the molecular formula was N-methyl-N-[(perfluorobutyl)sulfonyl]glycine or N-methyl perfluorobutane sulfonamidoacetic acid (MeFBSAA).
Figure 7. A) Elemental composition calculator results for the candidate at m/z 369.9797. The best fit formula was C7H6F9NO4S based on i-FIT confidence (isotopic pattern algorithm used to score each formula). B) The formula was searched on the CompTox Dashboard for possible PFAS structures as it did not match the experimental or theoretical PFAS libraries. A hit for the molecular formula was N-methyl-N-[(perfluorobutyl)sulfonyl]glycine or N-methyl perfluorobutane sulfonamidoacetic acid (MeFBSAA).
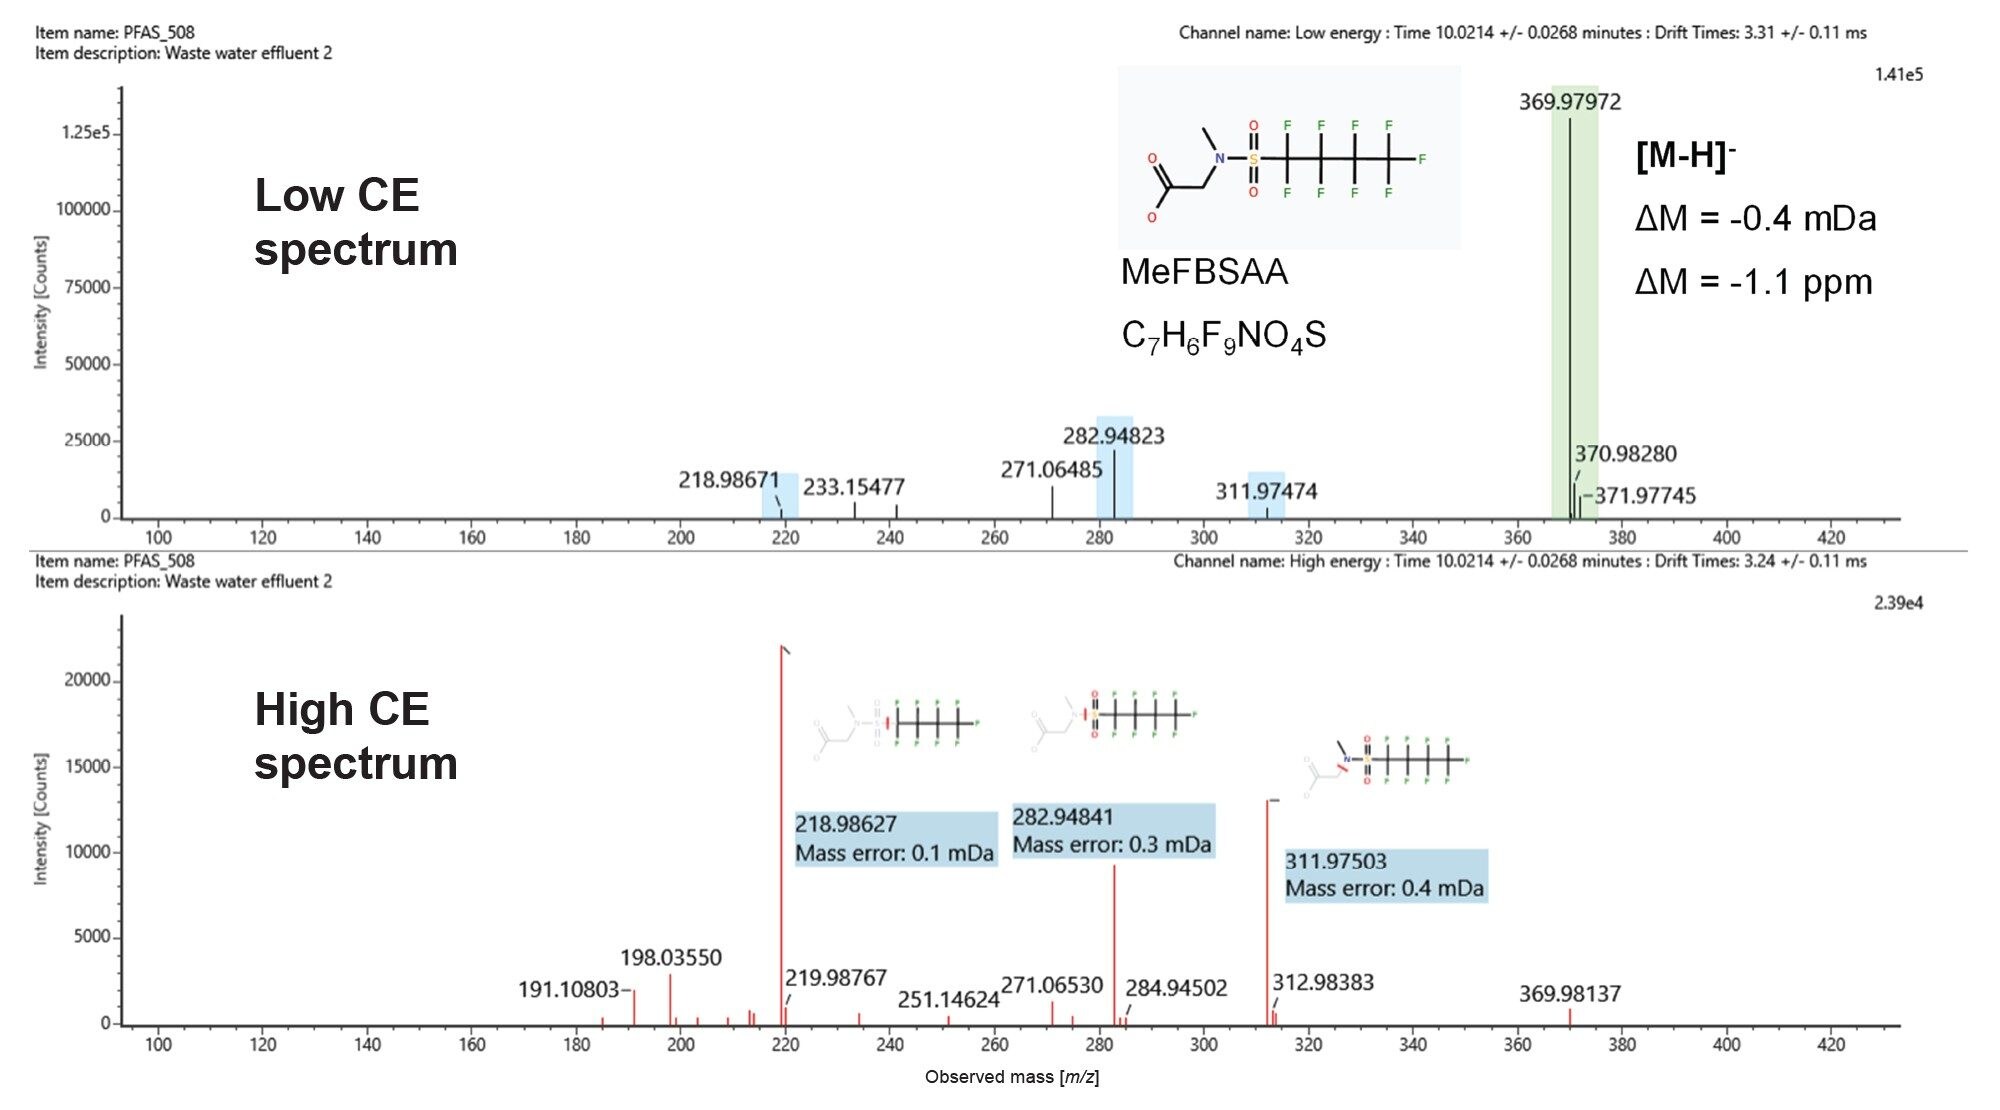 Figure 8. The high and low CE spectra for MeFBSAA in the sample annotated with theoretical fragment ions.
Further interrogation of the ion mobility filtered peak list of polyhalogenated ions detected in the wastewater effluent sample indicated the presence of three other related compounds at low levels: N-methyl perfluoropropane sulfonamidoacetic acid (MeFPrSAA), N-methyl perfluoropentane sulfonamidoacetic acid (MeFPeSAA), and N-methyl perfluorohexane sulfonamidoacetic acid (MeFHxSAA) (Figure 9). The compounds identified in this series exhibited an increase in RT and CCS with the addition of a CF2 group. These three compounds were identified at confidence level 2c: probable by diagnostic homologue evidence.11 Previous IMS studies have described how unique trendlines relating CCS to m/z can be generated for different PFAS molecular subclasses.7, 13 Figure 9B is a plot of the observed CCS versus m/z for this series of compounds and includes the measured CCS of N-MeFOSAA from an authentic standard. As shown in the plot, the relationship is linear with the increasing number of CF2 repeats, which aids in the certainty of the compound identifications. This trendline could be used to predict the CCS of compounds with the same head group, such as N-methyl perfluoroheptane sulfonamidoacetic acid (C10H6F15NO4S), which was not observed in these samples.
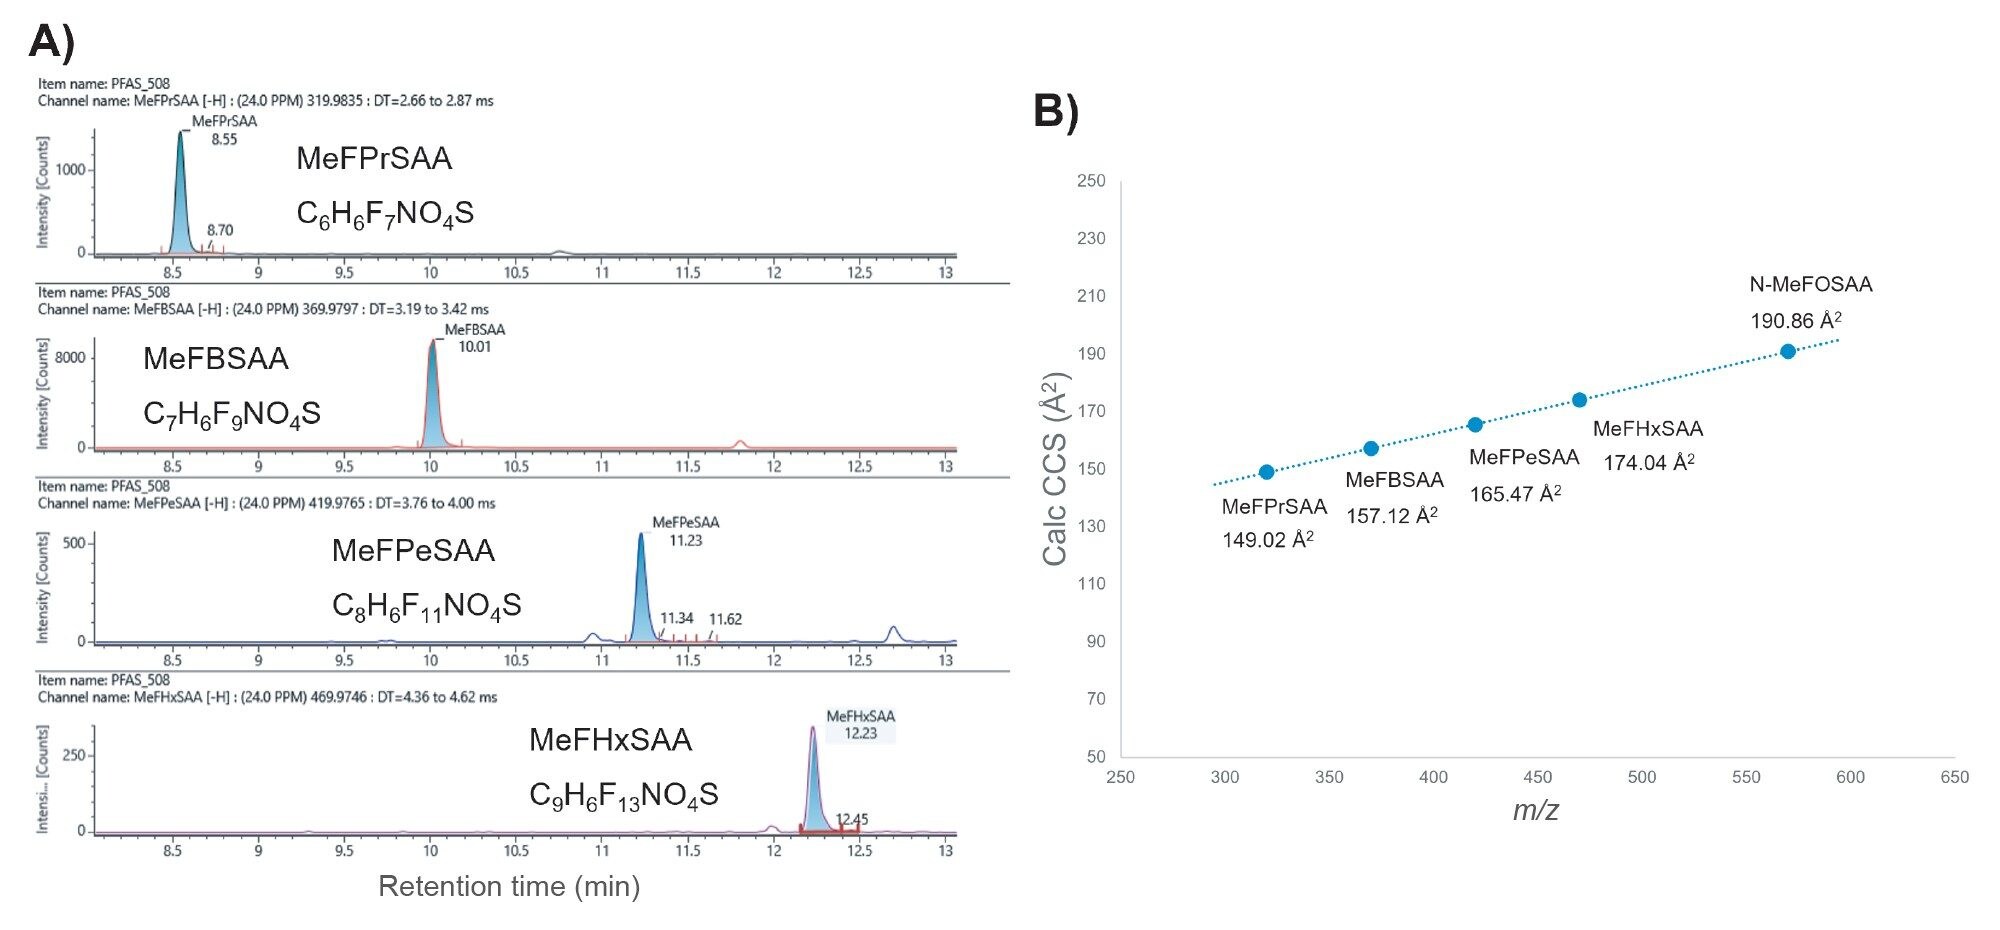 Figure 9. A) XICs for a series of related compounds (MePrSAA, MeFBSAA, MePeSAA, and MeFHxSAA) that were detected in the same wastewater effluent sample. B) Plot of calculated CCS versus m/z for the compounds and N-MeFOSAA which has a CCS value based on an authentic standard.
Conclusion
Non-targeted analysis of environmental samples with HRMS is an important technique in the detection and discovery of new, emerging, PFAS. While the potential number of PFAS is large and ever-expanding, the number of authentic standards remains limited and information-rich analytical methods are needed for compound identification. Screening for PFAS based on m/z alone can result in ambiguous identifications. Ion mobility provides an additional dimension of separation and provides CCS values that increase confidence in assignment of PFAS like features. The accurate mass screening tools in waters_connect software were able to assign detected peaks from the environmental samples as PFAS in an automated workflow. Confident identifications of known PFAS were based on metrics like accurate mass, retention time error, diagnostic fragments, and measured CCS.
For the discovery and characterization of unknown PFAS, IMS adds an additional advantage as this class of compounds have a distinct mass/CCS trendline compared to other compound classes of similar m/z. In this study, filtering detected peaks based on their observed drift time and m/z revealed polyhalogenated species that were in the environmental samples even at low intensity levels. The spectral clarity achieved with drift time alignment allowed for theoretical fragmentation matches with proposed structures as demonstrated with MeFBSAA. The peak detection and alignment, filtering, and structural elucidation of unknowns are all accomplished in a single software solution for data processing. As authentic standards for many PFAS are difficult to find, the certainty of proposed structures benefit greatly from the data generated with LC-IMS-HRMS and the additional metric of CCS.
References
- Schymanski E, Zhang J, Thiessen P, Chirsir P, Kondic, T, Bolton, E. Per- and Polyfluoroalkyl substances (PFAS) in PubChem: 7 Million and Growing. Environ. Sci. Technol. 2023 57 (44): 16918–16928
- US Environmental Protection Agency. CompTox Chemicals Dashboard. PFAS Structures in DSSTox (update August 2022). https://comptox.epa.gov/dashboard/chemical-lists/PFASSTRUCTV5
- US Environmental Protection Agency. Analysis of Per- and Polyfluoroalkyl Substances (PFAS) in Aqueous, Solid, Biosolids, and Tissue Samples by LC-MS/MS. January 2024
- ASTM D8421–22, Standard Test Method for Determination of Per- and Polyfluoroalkyl Substances (PFAS) in Aqueous Matrices by Co-solvation followed by Liquid Chromatography Tandem Mass Spectrometry (LC/MS/MS), ASTM International, West Conshohocken, PA, 2022, www.astm.org
- Liu Y, D’Agostino LA, Qu G, Jiang G, Martin JW. High-resolution mass spectrometry (HRMS) methods for non-target discovery and characterization of poly- and perfluoroalkyl substances (PFASs) in environmental and human samples. Trends Anal Chem 2019, 115420
- McCullagh M, Hodgkinson M, Dilllon L, van Bevel B, Burgess JA, Jogsten IE. Determination and Characterization of Perfluoroalkyl and Polyfluoroalkyl Substances (PFAS’s) in Environmental Samples Using UPLC Ion Mobility MS. Waters Application Note 720005090. 2014 June.
- Dodds JN, Hopkins ZR, Knappe DRU, Baker ES. Rapid Characterization of Per- and Polyfluoroalkyl substances (PFAS) by Ion Mobility Spectrometry-Mass Spectrometry (IMS-MS). Anal Chem 2020, 92, 6, 4427–4435
- Organtini KL, Rosnack KJ, Plummer C, Hancock P, Burt O. Analysis of Per- and Polyfluoroalkyl Substances (PFAS) in Accordance with EPA 1633 Part 2: Analysis of Aqueous Matrices. Waters Application Note 720008143. 2023 December.
- Organtini KL, Rosnack KJ, Hancock P. Expanding the Range of PFAS in a Single Injection to Include Ultra Short Chains Using the Atlantis BEH C18AX Mixed Mode Column. Waters Application Note 720008034. 2023 August.
- Twohig M, Fujimoto G, Mohan A, Organtini K, Rosnack KJ, Hird S. Approaches to Non-Targeted Analyses of Per- and Polyfluoroalkyl Substances (PFAS) in Environmental Samples. Waters Application Note 720007184. 2021 March.
- Charbonnet JA, McDonough CA, Xiao F, Schwichtenberg T, Cao D, Kaserzon S, Thomas KV, Dewapriya P, Place BJ, Schymanski EL, Field JA, Helbling DE, Higgins, CP. Communicating Confidence of Per- and Polyfluoroalkyl Substance Identification via High-Resolution Mass Spectrometry. Environ. Sci. Technol. Lett. 2022, 9, 473–481
- Mullin L, Jobst K, DiLorenzo RA, Plumb R, Reiner EJ, Yeung LWY, Jogsten IE. Liquid chromatography-ion mobility-high resolution mass spectrometry for analysis of pollutants in indoor dust: Identification and predictive capabilities. Analytica Chimica Acta. 2020 Aug 1125: 29–40
- Foster M, Rainey M, Watson C, Dodds JN, Kirkwood KI, Fernandez FM, Baker ES. Uncovering PFAS and Other Xenobiotics in the Dark Metabolome Using Ion Mobility, Mass Defect Analysis, and Machine Learning. Environ. Sci. Technol. 2022, 56, 12, 9133–9143
- MacNeil A, Li X, Amiri R, Muir DCG, Simpson A, Simpson MJ, Dorman FL, Jobst KJ. Gas Chromatography-(Cyclic) Ion Mobility Mass Spectrometry: A Novel Platform for the Discovery of Unknown Per-/Polyfluoroalkyl Substances. Anal. Chem. 2022, 94: 11096–11103
- Huset CA, Barlaz MA, Barofsky DF, Field JA. Quantitative Determination of Fluorochemicals in Municipal Landfill Leachates. Chemosphere. 2011 Mar 82, 10, 1380–1386
- Newton S, McMahen R, Stoeckel JA, Chislock M, Lindstrom A, Strynar M. Novel Polyfluorinated Compounds Identified Using High Resolution Mass Spectrometry Downstream of Manufacturing Facilities near Decatur, Alabama. Environ. Sci. Technol. 2017, 51, 1544–1552
720008269, February 2024