• Application Note

The Use of HRMS and Statistical Analysis in the Investigation of Basmati Rice Authenticity and Potential Food Fraud

The Use of HRMS and Statistical Analysis in the Investigation of Basmati Rice Authenticity and Potential Food Fraud

  • Gareth E. Cleland
  • Adam Ladak
  • Steven Lai
  • Jennifer A. Burgess
  • Waters Corporation

Abstract

There is increased concern regarding the authenticity of basmati rice throughout the world. For years, traders have been passing off a lesser quality rice as the world’s finest long-grained, aromatic rice. A DNA rice authenticity verification service in India has concluded that more than 30% of the basmati rice sold in the retail markets of the US and Canada is adulterated with inferior quality grains. In Britain, the Food Standard Agency found in 2005 that about half of all basmati rice sold was adulterated with other strains of long-grain rice. Genuine basmati rice is grown in the foothills of the Himalayas. What external factors play a part in the growth of the rice? Can a basmati strain grown elsewhere in the world can be classed as basmati rice? In this application note, a proof of principle method has been established to assess the authenticity of basmati rice using off the shelf supermarket samples. The combined use of APGC, SYNAPT G2-Si and Progenesis QI Software allow a flexible configuration that can be used for food fraud and food authenticity applications.

Benefits

  • Authenticity of food
  • Detecting food fraud
  • Metabolomics

Introduction

There is increased concern regarding the authenticity of basmati rice throughout the world. For years, traders have been passing off a lesser quality rice as the world’s finest long-grained, aromatic rice, basmati, in key markets like the US, Canada, and the EU. A DNA rice authenticity verification service in India has concluded that more than 30% of the basmati rice sold in the retail markets of the US and Canada is adulterated with inferior quality grains.1 In Britain, the  Food Standard Agency found in 2005 that about half of all basmati rice sold  was adulterated with other strains of long-grain rice.2

Genuine basmati rice is grown in the foothills of the Himalayas. What external factors play a part in the growth of the rice? Can a basmati strain grown  elsewhere in the world can be classed as basmati rice? 

A proof of principle method has been established to assess the authenticity of basmati rice using off the shelf supermarket samples with the latest advancements in high resolution GC-MS hardware and informatics. Volatile compounds of interest were extracted from heated dry rice via SPME and headspace. Following a generic GC separation, detection was performed using a Waters SYNAPT G2-Si MS run in HDMSE mode.3 Collection of an HDMSE dataset offers a high level of specificity as a result of an ion mobility separation of compounds based on size, shape, and charge, performed after and orthogonal to a GC or UPLC Separation.

Progenesis QI, the latest OMICS informatics package from Waters, is designed to utilize the 4-dimensional data produced during a SYNAPT G2-Si HDMSE acquisition. Initially, alignment of all injections is performed followed by the unique peak co-detection process resulting in the same number of analyte measurements in every sample and no missing values. Data from all isotopes and adducts of a parent compound are then deconvoluted giving a single robust and accurate measurement for that parent compound. Compounds of interest were highlighted using various Multi Variate Analysis (MVA) techniques and identified using elucidation tools and relevant database searches within the software platform.

Experimental

Sample preparation

Several varieties of rice from different producers, shown in Table 1, were obtained from local supermarkets. Sample IDs were given to avoid brand disclosure. 10 g of dried rice was weighed out in a 20 mL amber headspace vial. Rice samples were prepared in triplicate as to provide three replicate injections for each sample without returning to the same vial. A pooled, composite sample was prepared by mixing 100 g of each rice sample together prior to weighing out 10 g vials. All samples were placed in the autosampler tray and data collected with a randomized sample list.

Table 1. Off the shelf rice samples used during the study.

Results and Discussion

Collection and interrogation of a comprehensive APGC/HDMSE  non-targeted dataset was performed following the analysis workflow shown in Figure 1. Atmospheric Pressure Gas Chromatography (APGC) is a ‘soft’ ionization technique resulting in less compound fragmentation when compared to conventional electron ionization (EI).4

Increased abundance of precursor ion enhances sensitivity for compounds of interest. Precursor ion fragmentation can now be controlled via a high definition MSE (HDMSE) acquisition, which also leads to an increase in specificity. 

HDMSE collects accurate mass precursor ion and accurate mass fragment ion data (at elevated collision energy) in alternate MS functions in combination with ion mobility separations to provide time aligned, drift aligned accurate mass precursor and accurate mass product ion information in a single injection.2 Ion mobility provides an additional degree of separation to the chromatography used, which improves the overall peak capacity over conventional GC-MS techniques.

Figure 1. Analysis workflow for rice samples in this study.

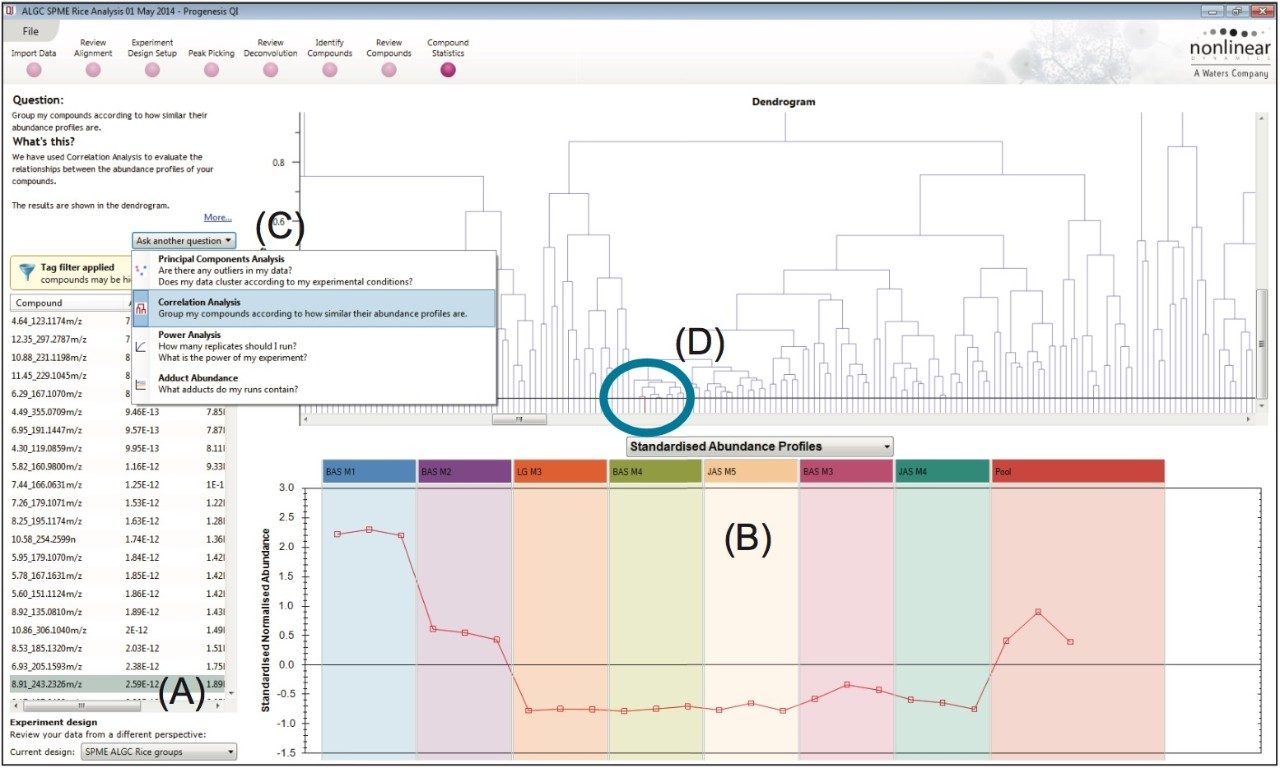
Data processing was performed using Progenesis QI, the latest OMICS software package from Waters fully able to utilize the information afforded in HDMSE datasets. Progenesis QI  is a novel software platform that is able to perform alignment, peak picking and mining of data to quantify then identify significant molecular differences between groups of samples. 

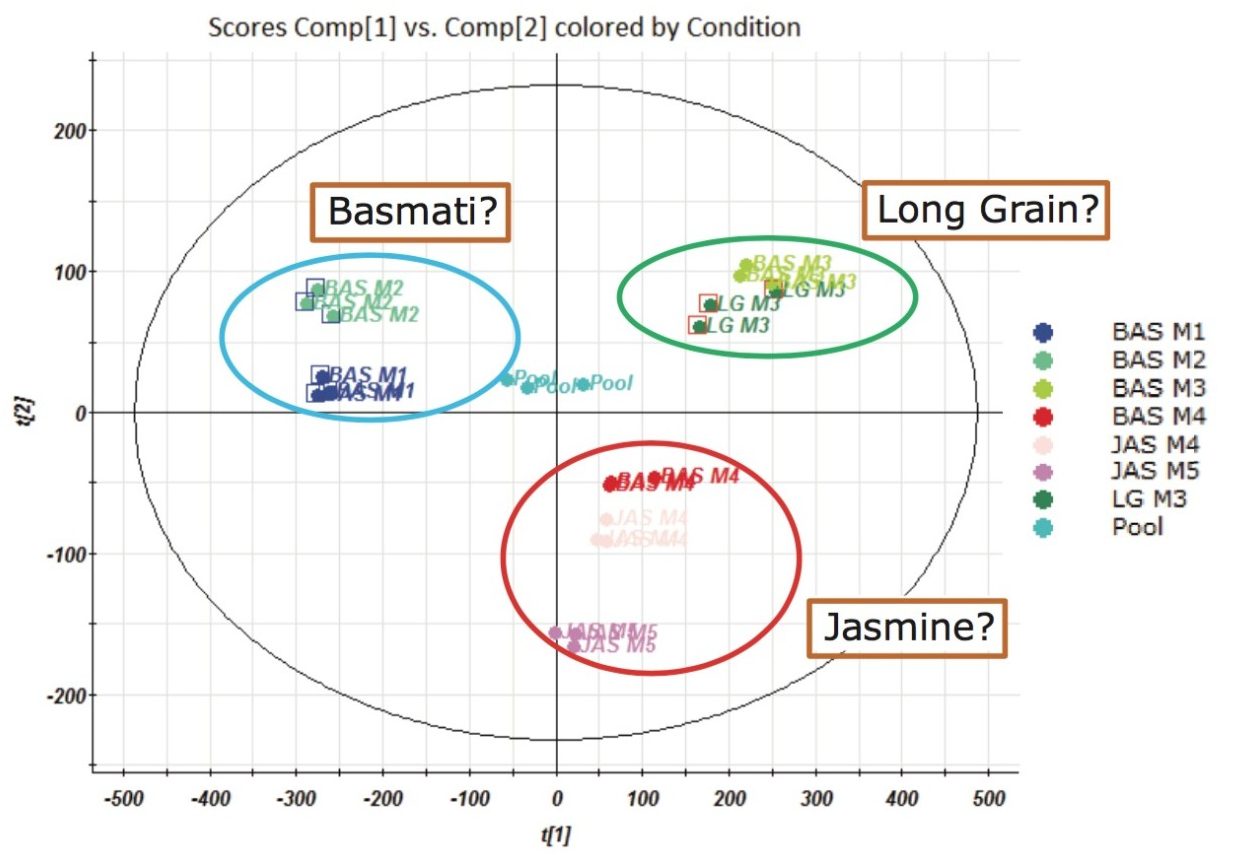
Following alignment, peak detection and deconvolution, 3885 compound ions were investigated. Initially, Principle Component Analysis (PCA) was performed yielding the scores plot in Figure 2. Tight pooling of injections from replicate samples and a centralized composite/pool sample indicated a statistically relevant dataset. Some of the basmati rice samples fell in the upper left quadrant, jasmine rice samples fell in the lower right quadrant and a long grain rice in the upper right quadrant. Exceptions to the pooling of the rice types were observed for two basmati rice samples. One originated from the same producer as a jasmine rice and pooled with other jasmine rice samples (BAS M4). The second basmati outlier (BAS M3) came  from the same producer as the long grain rice and pooled alongside this long grain rice sample (LGM3).

Since the origin of these stored purchased samples is essentially unknown, it is not possible to draw conclusions about the origin or purity of the samples. The aim of this work was to devise a proof-of-principle method for the investigation of basmati rice authenticity and potential food fraud.  A study with a larger number of well characterized samples, including both authentic and non-authentic basmati rice samples, is required. Finding unique markers of interest in this new study may then make it possible for a pass/fail method to be established on a more routinely used instrument in a quality control laboratory, such as a single or tandem quadrupole.   

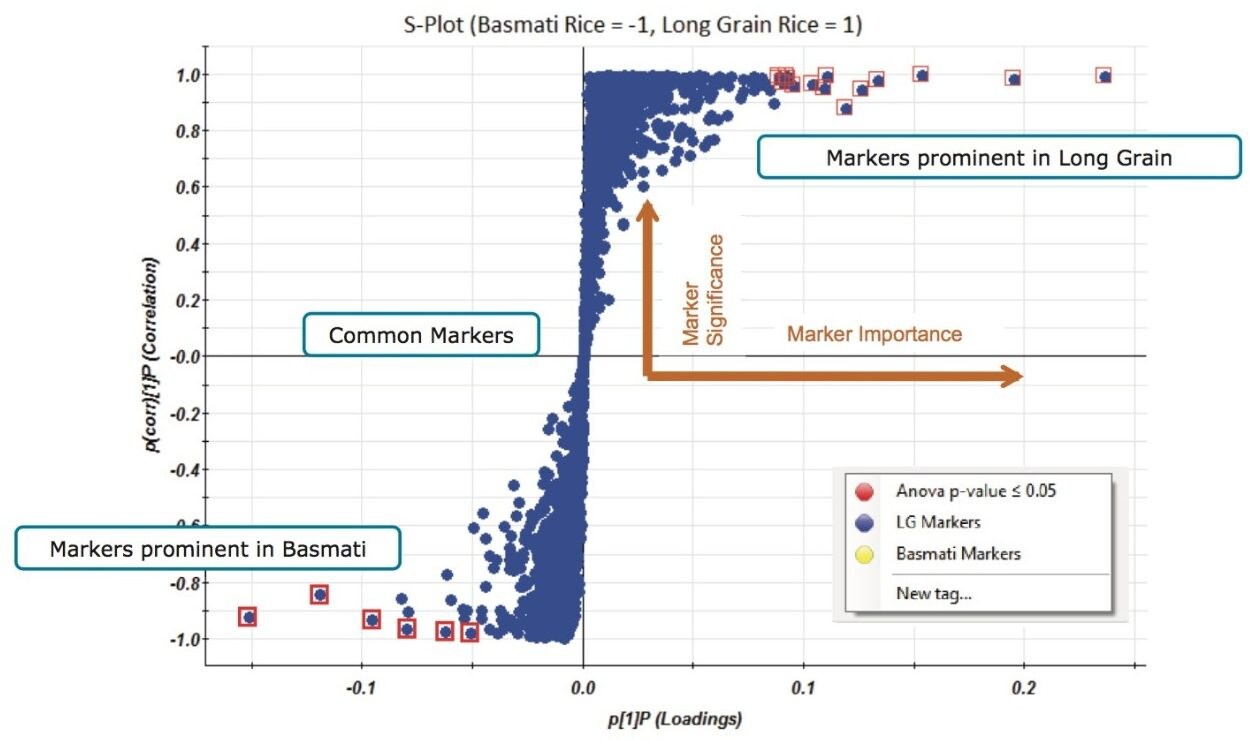
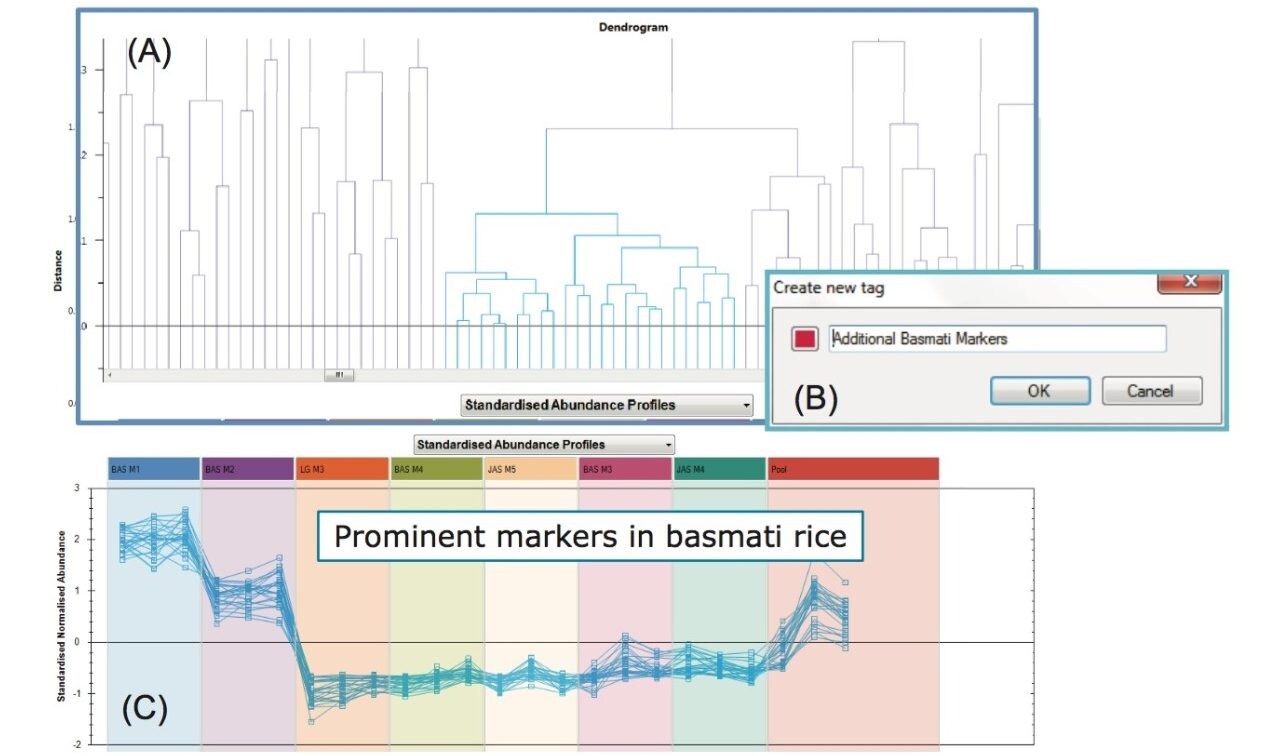
Further investigation into the data was performed using a supervised Orthogonal Projections to Latent Structures Discriminant Analysis (OPLS-DA) model. For this, the markers comprising the injections for the basmati rice samples (BAS M1 and BAS M2), highlighted with blue squares in Figure 2, were compared to the markers comprising the long grain rice sample (LG M3), highlighted with red squares in Figure 2. The S-plot from this analysis is shown in Figure 3 where the x-axis shows the measure of the magnitude of change in a particular analyte, and the y-axis shows a measure of analyte significance in the two-group comparison. Significant markers or ions of interest, highlighted with red squares in Figure 3, are the ions representing the significant markers with the biggest difference between the two rice types. Once highlighted, a set of markers can be tagged with a simple right mouse click. This subset of analytes can then be assigned a ‘tag’ within Progenesis QI for further consideration.

Figure 2. Scores plot from the PCA performed on rice samples.
Figure 3. OPLS-DA model showing differences between basmati rice and long grain rice samples.

Figure 4 shows the standardized abundance profile for the six markers tagged in basmati rice. The standardized abundance profile (also known as a trend plot) shows the normalized intensity of the six markers of interest that were highest in basmati M1 and M2 samples compared to all other injections. Their presence in the composite sample (pool) is expected owing to the contribution of the M1 and M2 samples.

Figure 4. Standardized abundance profiles for six basmati rice-related markers. 

Further interrogation of the 3885 compounds ions was performed using default quick tag filters and the Correlation Analysis, available within Progenesis QI. Applying the quick tag filter for ANOVA P value (p<0.05), resulted in a focus on 2907 statistically significant ions from the 3885 originally generated. Figure 5 shows the table of markers satisfying the ANOVA P value filter (A). The standardized abundance profile for a marker of interest previously obtained from the S-Plot in Figure 3, is also displayed (B). Selecting Correlation Analysis from the highlighted dropdown menu (C) results in a Dendrogram of markers. The correlation analysis groups compounds according to how similar their abundance profiles are across all samples. Our marker of interest is shown as the red line highlighted by the circle (D). Markers showing a similar abundance profile are found within the same Dendrogram branch.

Figure 5. Accessing and using the correlation analysis within Progenesis QI (C) enables the user to extract further ions of interest that follow a similar profile to a selected marker (B). 

These markers of a similar profile to the one highlighted are easily isolated, viewed and tagged using the Dendrogram within the Correlation Analysis, as shown in Figure 6. Over 50 markers of interest in basmati rice, showing a similar trend across all injections, have now been isolated and tagged.

Figure 6. (A) Further markers of interest in basmati rice, isolated using the Correlation Analysis in Progenesis QI. (B) A right click allows easy tagging of these markers for elucidation. (C) Standardized abundance profiles of all 57 isolated markers are shown across all injections.

The same steps were followed for selection of the key markers in the long grain rice sample (LGM3). The standardized abundance profile of 26 markers of interest, extracted using the correlation analysis within Progenesis QI, in long grain rice are displayed in Figure 7. As can be seen from Figure 7, the basmati rice from the same producer as the long grain rice showed very similar abundance profiles on the same markers of interest; yet none of these markers were observed in other basmati rice samples. This could imply that is very little difference between the basmati rice and the long grain rice samples from this producer. This could also imply that packaging material is having an impact on our profiling.

A study with a larger number of well characterized samples, including both authentic and non-authentic basmati rice samples, is required to test this proof-of-principle method, as previously mentioned.

Figure 7. (A) Markers of interest in long grain rice isolated using Correlation Analysis. (B) Standardized abundance profiles of all 26 isolated markers across all injections.

Once markers of interest have been isolated there are several options for elucidation and identification:

1. Structural elucidation within MassLynx Software.

2. Batch database searching within Progenesis QI.

3. Batch database searching outside of Progenesis QI.

Structural elucidation

To determine the structure of an ion of interest the mass, or formula (from elemental composition calculation) is submitted to a chemical structure database, such as ChemSpider. A selected structure resulting from the search is checked for matching high energy accurate mass fragment ions using the MassFragment tool.  Figure 8 summarizes the steps involved in structural elucidation for the marker 271.2644 Da at 10.79 minutes (10.79_271.2644) obtained from the OPLS-DA analysis. To confirm the proposed structure, a purchased or synthesized standard would have to be analyzed using GC-MS/MS. 

Note: Progenesis QI V2.0, available end 2014, will have Elemental Composition and ChemSpider search functionality embedded within the software. These functions were not available for use when this project was completed.

Figure 8. MassLynx Software’s structural elucidation workflow for isolated markers of interest.

Database searching within Progenesis QI

Progenesis QI’s search engine (Progenesis Metascope) allows users to query in-house and publicly available databases. Search parameters can be customized to maximize all aspects of the data acquired to the database being searched. A list of potential identifications is generated and scored using criteria such as mass accuracy, isotope distribution, retention time, drift time, and fragment matching. If the chosen database contains structures, theoretical fragmentation of the molecule is performed and a fragmentation score is used to rank potential identifications of high energy accurate mass fragment ions to the theoretical dissociation of the molecule. 

Figure 9 highlights these customizable database searching parameters in Progenesis QI software (A). An example identification of the marker elucidated earlier is shown (B) when searching several downloaded publically available databases (NIST, ChEBI, and HMDB), and the search settings used in Figure 9A. High spectral specificity (spectral cleanup) is observed due to the ability of the software to time align and drift align spectra from the four-dimensional HDMSE acquisition. All fragments in the high energy spectrum of Figure 9 (B) have been assigned to the theoretical dissociation of the molecule proposed in the database search, which increases confidence in the identification made. Identification of the same molecule via elucidation within MassLynx and via database searching within Progenesis QI also increases confidence in the identifications made. 

Figure 9. Database and search settings available in Progenesis QI (A). An example of a typical identification is also shown (B).

Database searching outside of Progenesis QI

Batch submission to the METLIN (Metabolite and Tandem MS Database) is also possible using a clipboard copied list of masses from Progenesis QI, Figure 10. The Scripts Center for Metabolomics web page is automatically launched when the user copies a list of tag filtered markers of interest to the clipboard. MS/MS spectra within the METLIN database can be used to compare to the drift and time aligned high energy spectra obtained from  a HDMSE acquisition.

Figure 10. Screen capture of the compound identification page in Progenesis QI. Highlighted areas show the ease of batch submission for markers of interest to an external (METLIN) database.

Conclusion


  • Data independent, information rich, HDMSE acquisitions enable accurate mass precursor and accurate mass product ion information to be captured in a single chromatographic run.
  • APGC is a soft ionization technique which results in an increased abundance of the parent ion and therefore enhances sensitivity and specificity.
  • The combination of a GC separation, an HDMSE acquisition, and informatics that is able to process and review four dimensional data results in a unprecedented level of specificity for all compounds the chromatographic run.
  • Alignment algorithms within Progenesis QI enable features across injections to be properly aligned prior to peak picking. This improves the ability to track ions of interest across all injections in an analysis.
  • Progenesis QI effectively streamlines and simplifies complicated non targeted, unknown screening workflows and makes compound isolation and identification faster, easier, and more robust.
  • Statistical analysis models within the software such as PCA, OPLS-DA, and Correlation Analysis allow ions of interest in complex matrices to be isolated with ease.
  • Easy-to-use database searching allows ions of interest to be identified from several publically available databases.
  • The combined use of APGC, SYNAPT G2-Si and Progenesis QI Software allow a flexible configuration that can be used for food fraud and food authenticity applications.

References

  1. The Economic Times, “Basmati Export Adulteration Leaves Bad Taste in Mouth”, Prabha Jagannathan, Jul 6, 2007. http://articles.economictimes.indiatimes.com/2007-07-06/ news/28467196_1_basmati-rice-india-s-basmati-basmati-export
  2. Contamination concerns force new Basmati regulations, Fletcher A, August 2005. http://www.foodnavigator.com/Legislation/ Contamination-concerns-force-new-Basmati-regulations
  3. Waters SYNAPT G2-Si product brochure, Part. No. 720004681EN.
  4. Waters APGC White Paper, Part No. 720004771EN.

720005218, November 2014

Back To Top Back To Top