In this application note, a simple 2-dimensional fingerprint analysis method is presented for NA black cohosh authenticity testing. The data processing was automatically handled by Empower CDS Software, which is convenient for routine analysis. The details of this 2-dimensional fingerprint analysis using Empower is described in this note.
Botanical ingredients are widely used in dietary supplements, herbal medicines, cosmetics and personal care products. Potential contamination or misidentification of plants due to the lack of standardization of production has been a health concern to consumers. Ascertaining the authenticity of botanical ingredients and processed products is a challenging task due to their complex phytochemical constituents, the natural variation in their phytochemical profiles, and the similar phytochemical profiles of closely related species. Liquid chromatography (LC) coupled with mass spectrometry (MS) is one of the most effective analytical techniques1-7 for authenticity evaluation. However, LC-MS has not been widely used in analytical labs for routine authenticity testing due to the relatively high cost of mass spectrometers and the high level of expertise needed. Recently, we have demonstrated the feasibility of using Waters ACQUITY UPLC H-Class System with the ACQUITY QDa Mass Detector for botanical authenticity testing.8 The distinctive MS ion chromatogram and the specific mass spectrum for a marker compound were found to be very effective in differentiating North American (NA) black cohosh (Actaea racemosa) from other Actaea species.
Chemometric analysis techniques, such as Principle Component Analysis (PCA), Similarity Analysis, and Clustering Analysis are powerful data processing tools for the authentication and classification of botanicals.9 However, data processing for these techniques is often sophisticated and time-consuming. In this application note, a simple 2-dimensional fingerprint analysis method is presented for NA black cohosh authenticity testing. The data processing was automatically handled by Empower CDS Software, which is convenient for routine analysis. The details of this 2-dimensional fingerprint analysis using Empower is described in this note.
Three authentic NA black cohosh extracts (NA1-NA3), three Asian black cohosh (Actaea cimicifuga) extracts (A1-A3), and four commercial black cohosh samples (U1-U4) were provided by a collaborator. These extracts were diluted with 70% methanol to about 5 mg/mL. Four standards: cimifugin, cimiracemoside C (cimigenol-3-alpha-L-arabinoside), 27-deoxyactein (23-epi-26-deoxyactein), and actein were purchased from ChromaDex (Irvine, CA). These standards were prepared in 70% methanol at about 5 µg/mL. The standards’ structures, CAS Registry numbers, and monoisotopic masses are shown in Figure 1. Home-made black cohosh samples: M-5 and M-10, were prepared by mixing NA black cohosh sample (NA1) and Asian black cohosh (A1) at 95:5 and 90:10 mass ratios, respectively. Sample solutions were filtered by 0.2 µm PTFE membrane prior to the analysis.
UPLC system: |
ACQUITY UPLC H-Class |
Column: |
ACQUITY BEH C18, 130Å, 1.7 μm, 2.1 mm x 100 mm, (p/n: 186002352) |
Column temp.: |
50 °C |
Eluent A: |
De-ionized water with 0.1% formic acid |
Eluent B: |
Acetonitrile/methanol (v/v 7/3) with 0.1% formic acid |
Injection volume: |
10 μL |
Run time: |
9 min |
Reconditioning: |
2.5 min |
Reconditioning: |
2.5 min |
MS system: |
ACQUITY QDa (with Diverter Valve) |
Software: |
Empower 3 |
Detection: |
ESI+, MS scan |
Scan: |
200 to 1000 Da |
Capillary voltage: |
1.5 kV |
Cone voltage: |
10 V |
Probe temp.: |
300 °C |
In the black cohosh authenticity study,8 cimiracemoside C was selected as the marker for the authentic black cohosh. The extracted ion chromatograms (XICs) at the marker’s molecular ion mass-to-charge ratio (m/z 621 Da) from the NA black cohosh samples shared a simple and consistent pattern that was significantly different from the XICs from the Asian black cohosh samples (Figure 2). In addition, the mass spectra extracted at the marker’s peak retention time (RT) 5.77 min showed a characteristic pattern, as shown in Figure 3. These patterns, or fingerprints, from two orthogonal dimensions provided the basis for this NA black cohosh authentication method.
The common feature in the XICs of the NA black cohosh was that there were two main peaks of about equal peak height, and the marker’s peak was one of them (Figure 2, NA 1-NA 3). We used the marker peak’s RT and its peak relative area as the quantitative parameters to characterize this chromatographic pattern. Additional parameters could be used, but these two parameters seemed to be effective enough to differentiate the NA black cohosh from the Asian black cohosh samples.
The top five abundant ions in the extracted mass spectra from NA black cohosh samples were used to characterize the pattern. These ions include the molecular ion (base peak, m/z 621 Da), a fragment ion (m/z 603 Da), the sodium adduct ion (m/z 643 Da), and the isotopic ions (m/z 622, 644 Da). Their m/z and relative intensity (relative to the base peak, or the molecular ion) values were used as the quantitative parameters for authentication. It should be noted that these mass spectra were obtained from the NA black cohosh samples, not from the cimiracemoside C standard. Therefore it is necessary to include those adduct and isotopic ions, in addition to the molecular ion and the fragment ion, in order to capture the overall spectral pattern of NA black cohosh samples at the UPLC RT 5.77 min.
The extracted mass spectra (at RT 5.77 min) were stored in a customized NA black cohosh MS library, and were used for MS library search in the unknown black cohosh sample authenticity testing. One example of the Empower MS Library Match results is shown in Figure 3.
To determine the threshold values in those authentication parameters for the NA black cohosh, three NA black cohosh and three Asian black cohosh samples were measured in triplicate by UPLC-MS. These samples were measured in a randomized fashion to avoid artifacts related to injection order. Table 2 shows the statistical averages, the standard deviations (SD), and the threshold values for those authentication parameters. In Table 2, the upper and the lower limits in RT were set at the ±1% of the RT average. For the relative peak area (%Area), the limits were set at 3X the SD from the average. For the expected mass relative intensity, the lower limits were set at 3X the SD below the average. There was no upper limit used for the expected mass relative intensity. These threshold values were mainly chosen at the 3X the SD to cover the potentially wide variation in the NA black cohosh. A data processing Method Set was created in Empower Software to carry out the authentication process. Figure 4 shows the Empower data processing flow chart. Table 3 shows the Empower functions that were used in this method.
Four commercial black cohosh samples (U1-U4) and two home-made black cohosh samples (M5 and M10) were tested by this method. Figure 5 shows an Empower report for these samples. Any nonconformity to the authentication criteria was automatically flagged in red by Empower Software. A summary of the test results was discussed in the previous application note.8 Briefly, the authentic, inauthentic, and contaminated black cohosh samples were all correctly determined.
Chemometric analyses are powerful tools for exploratory authenticity studies of botanicals. In the routine analysis environment, however, they are too sophisticated and cumbersome to be implemented. Here, we have demonstrated a novel authentication approach, in which a marker compound’s 2-dimensional fingerprints are used to authenticate NA black cohosh. Because only the marker’s chromatographic fingerprint and mass spectral fingerprint are processed, the amount of the data that need to be processed is relatively small, and the data handling is relatively simple. The whole data processing can be automated in Empower Software, which is suitable for laboratories performing routine analysis.
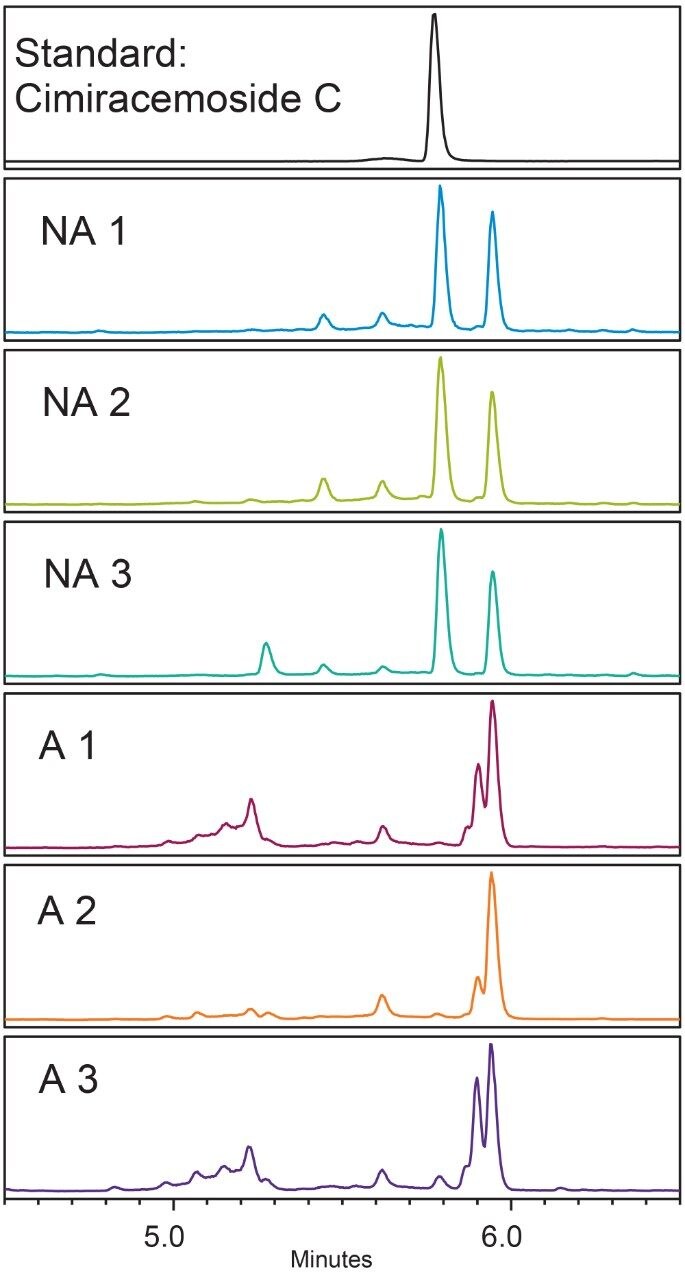
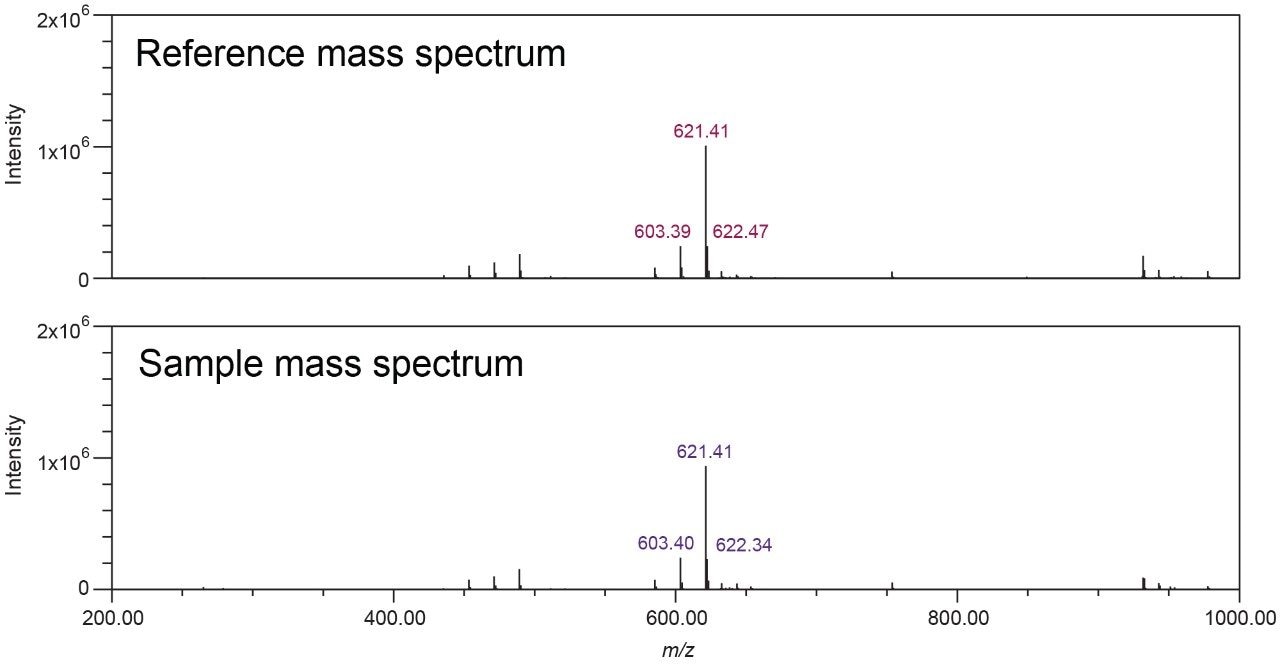
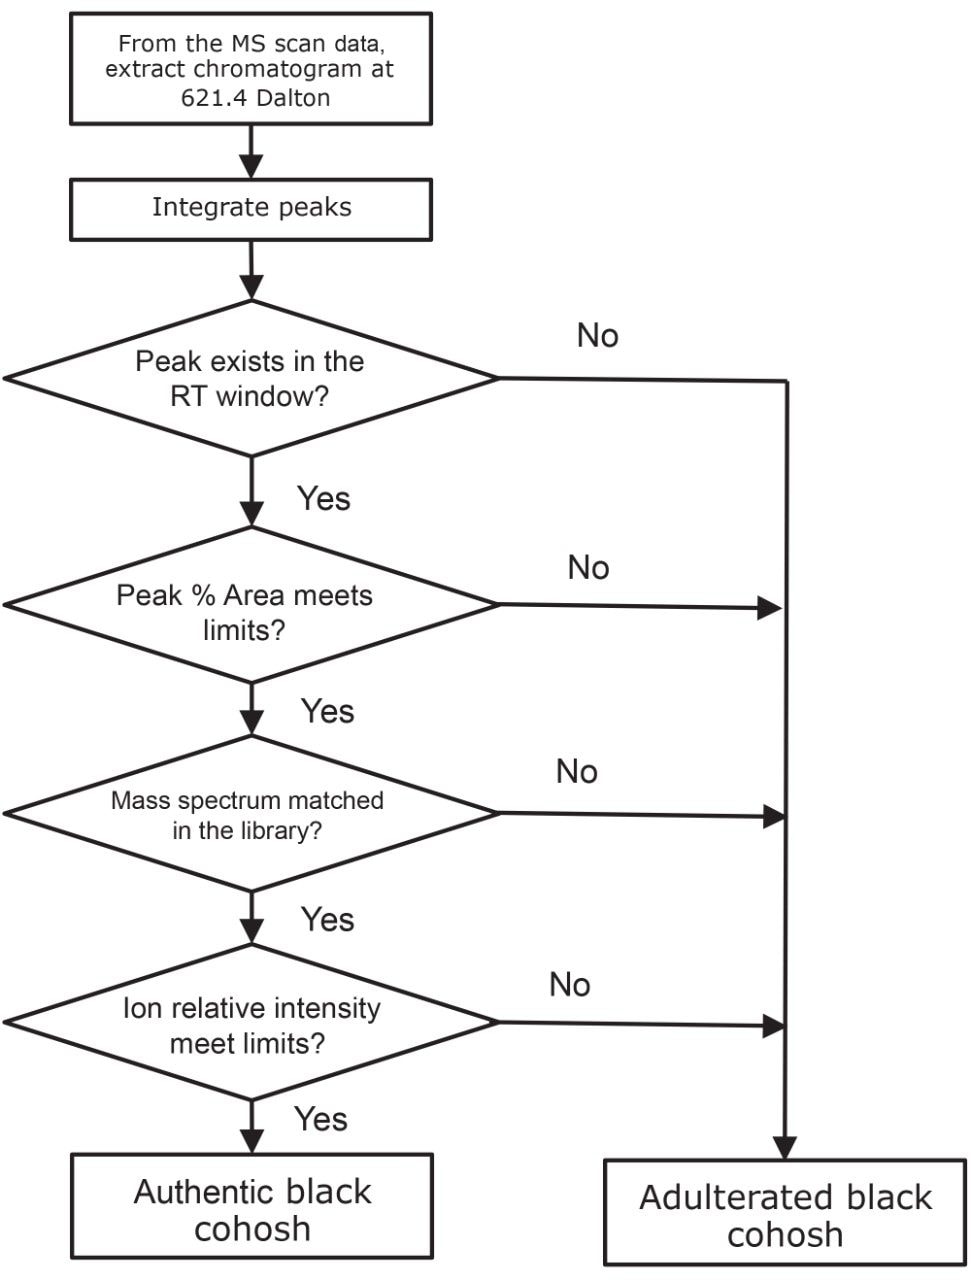
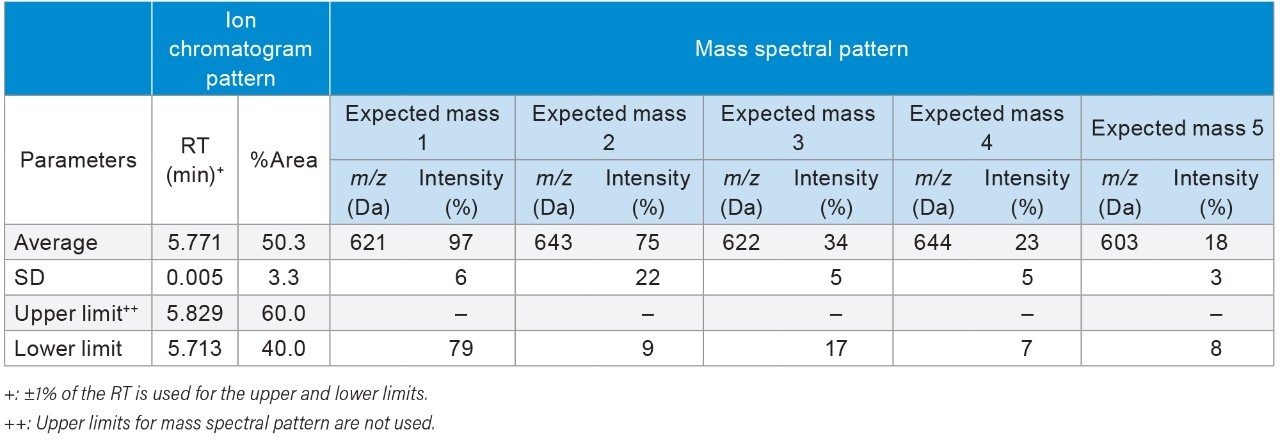
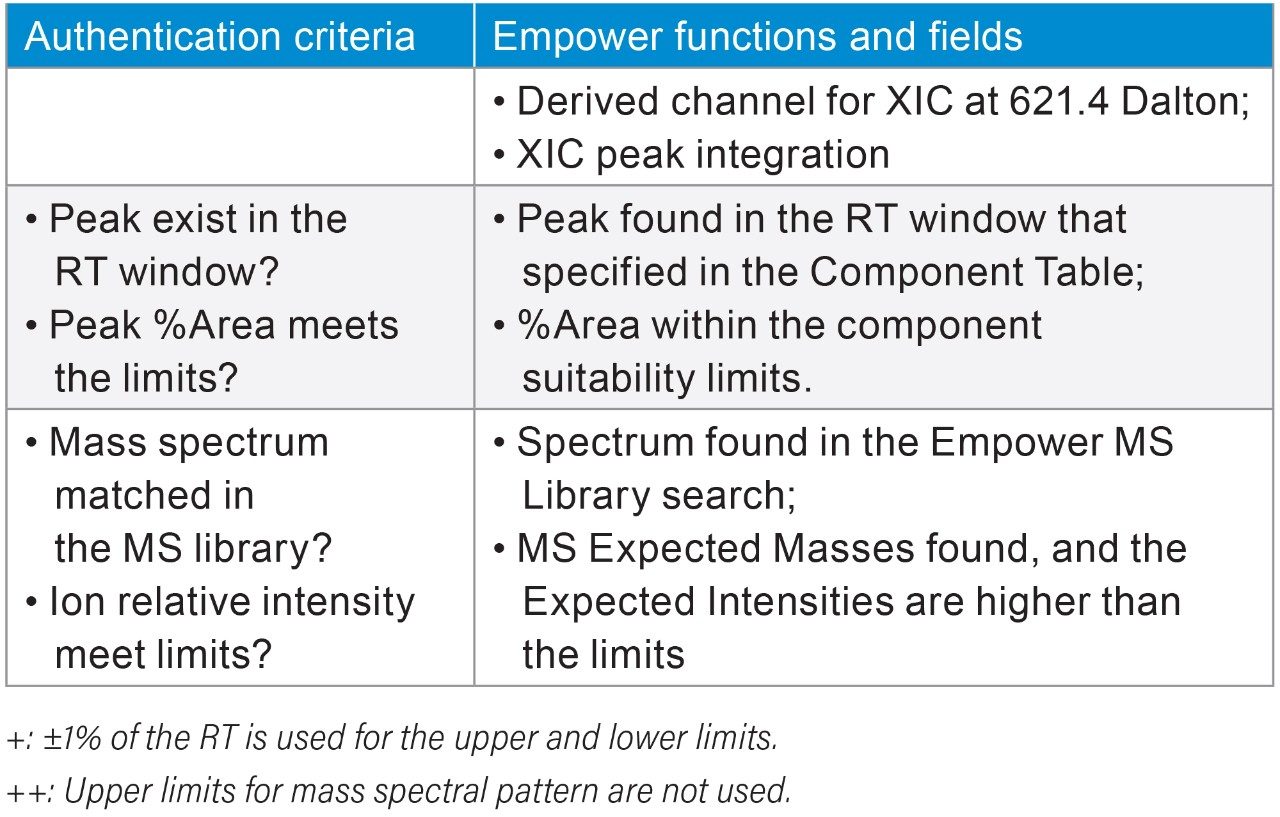
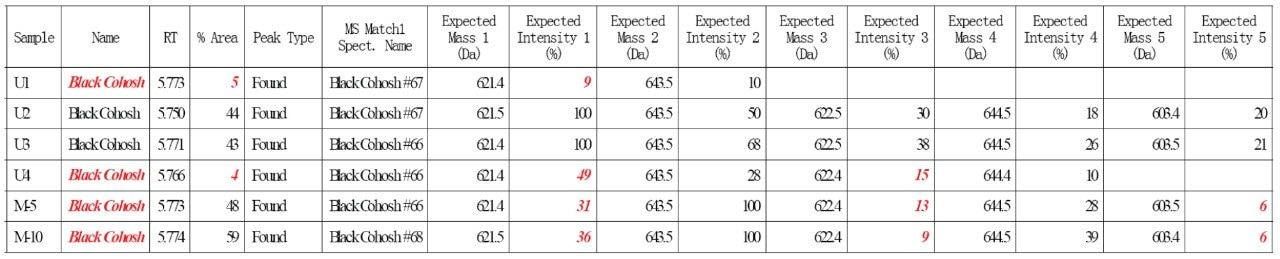
In this application note, details of an automated 2-dimensional fingerprint analysis for NA black cohosh authenticity are described. The key features, or patterns, in the chromatographic and the mass spectral fingerprints of a marker compound were characterized by a set of quantitative parameters, such as RT, peak relative area, m/z, and ion relative intensity. The threshold values of these parameters for NA black cohosh were determined and used in Empower Software’s automated data processing. Using this UPLC-MS approach, we were able to differentiate NA black cohosh from Asian black cohosh samples, and detect Asian black cohosh contamination at 5 wt%. It should be noted that due to the limited number of reference or training samples used in method development, this black cohosh authenticity method may need to be further validated.
The key features of this UPLC-MS approach include the use of the ACQUITY QDa Mass Detector, the use of a marker’s 2-dimensional fingerprints for authentication, and the automation of the whole data processing by Empower Software. The ACQUITY QDa is affordable, easy to learn, and use. Automated data processing using Empower Software is quick and objective. These features are suitable for routine authenticity testing, where the analyst’s time and expertise may be limited. This new UPLC-MS approach could be easily implemented in analytical labs for the routine authentication, and/or quality control of botanical ingredients and finished products in dietary supplements, herbal medicines, cosmetics and personal care products to safeguard product quality and safety.
720006284, May 2018