Method Development of Synthetic Triphenylmethane Dyes Using MaxPeak™ Premier Columns on an Alliance™ HPLC™ System
Abstract
HPLC method development of structurally similar components is an arduous task to undertake. Understanding the principles of liquid chromatography and applying them in a structured, streamlined approach not only speeds up the method development process but also provides traceability for the activity in an easy-to-follow format. Having a structured protocol for method development also allows novice users to develop methods independently, without the oversight of expert chromatographers.
A structured protocol, the Systematic Screening Protocol, was used to develop a method for the separation of eight synthetic dyes with structural similarity. All the dyes belong to the triphenylmethane family, containing the same core structure with varying moieties attached. The protocol used to develop the method relies on MaxPeak™ High-Performance Surfaces (HPS) technology, featured in MaxPeak Premier Columns, to mitigate any non-specific adsorption (NSA) seen between the column and the analytes. Employing this column technology, along with the systematic screening protocol, a method was developed which provides good peak shape and complete separation of all eight dyes.
Benefits
- Fast method development using the systematic screening protocol
- MaxPeak Premier Columns used to mitigate any NSA and provide the most accurate result the first time
- Full separation of eight synthetic dyes in under 20 minutes using a 100 mm column
Introduction
Developing methods can be tricky, especially for structurally similar compounds which can have similar chemical properties such as polarity or pKa. The challenge becomes even greater when a novice analyst, who may not have the most experience, is asked to develop the method as part of a project. Without a protocol for method development, the novice user will have to rely heavily on expert users, or struggle through the process themselves. In either case, the method might get developed but at a slower pace. Using a structured method development approach, like the one outlined in this application note, not only helps novice users gain experience but also provides a level of traceability to the process of developing the method. With each stage outlined and goals assigned to each step, the justification for method condition selection is readily apparent. The Systematic Screening Protocol approach to method development provides the traceability mentioned while balancing speed of development with obtaining as much data as possible to get an accurate picture of the sample being analyzed.
The Systematic Screening Protocol employs four steps to develop methods.1–3 First, an analyst much determine the criteria that needs to be met for the new method. These criteria can be as simple as achieving adequate resolution between peaks or having symmetrical peaks. Next the analyst performs a high and low pH screen using an appropriate column. This step determines which pH provides the best retention for the probes. This step can be predicted by looking at the chemical properties of the analytes, however in some cases like forced degradation studies, the chemical properties are not known so this step is vital in the method development process. Once a pH has been selected, a more traditional column and organic solvent screen is performed using both acetonitrile and methanol mobile phases on a diverse set of LC stationary phases. This step provides the most data and assesses what set of conditions provides the best separation. Lastly, if needed, method optimization can be performed to further improve the separation quality. Adjustments to gradient slope, mobile phase additives, column length, and other parameters can be adjusted during optimization to meet the criteria set in the first step of the protocol.
To demonstrate the use of the systematic screening protocol, a mixture of eight synthetic dyes was created and analyzed. All eight analytes are triphenyl methane dyes and have the same backbone structure. Each analyte is unique in the attachments to this structure, but the structural similarities make separating these compounds particularly difficult. Figure 1 shows the chemical structures of the analytes. The Systematic Screening Protocol was employed to separate these compounds, and a method was developed which met all criteria using XBridge™ Premier Columns, which uses MaxPeak Premier High-Performance Surfaces (HPS) technology. These columns are ideally suited for method development as they mitigate any secondary interactions between analyte and metal surfaces of the column. By removing those interactions, the first injection of a sample is more accurate and reproducible.4–6 The final method can now be used to test samples or be further validated for things such as robustness.
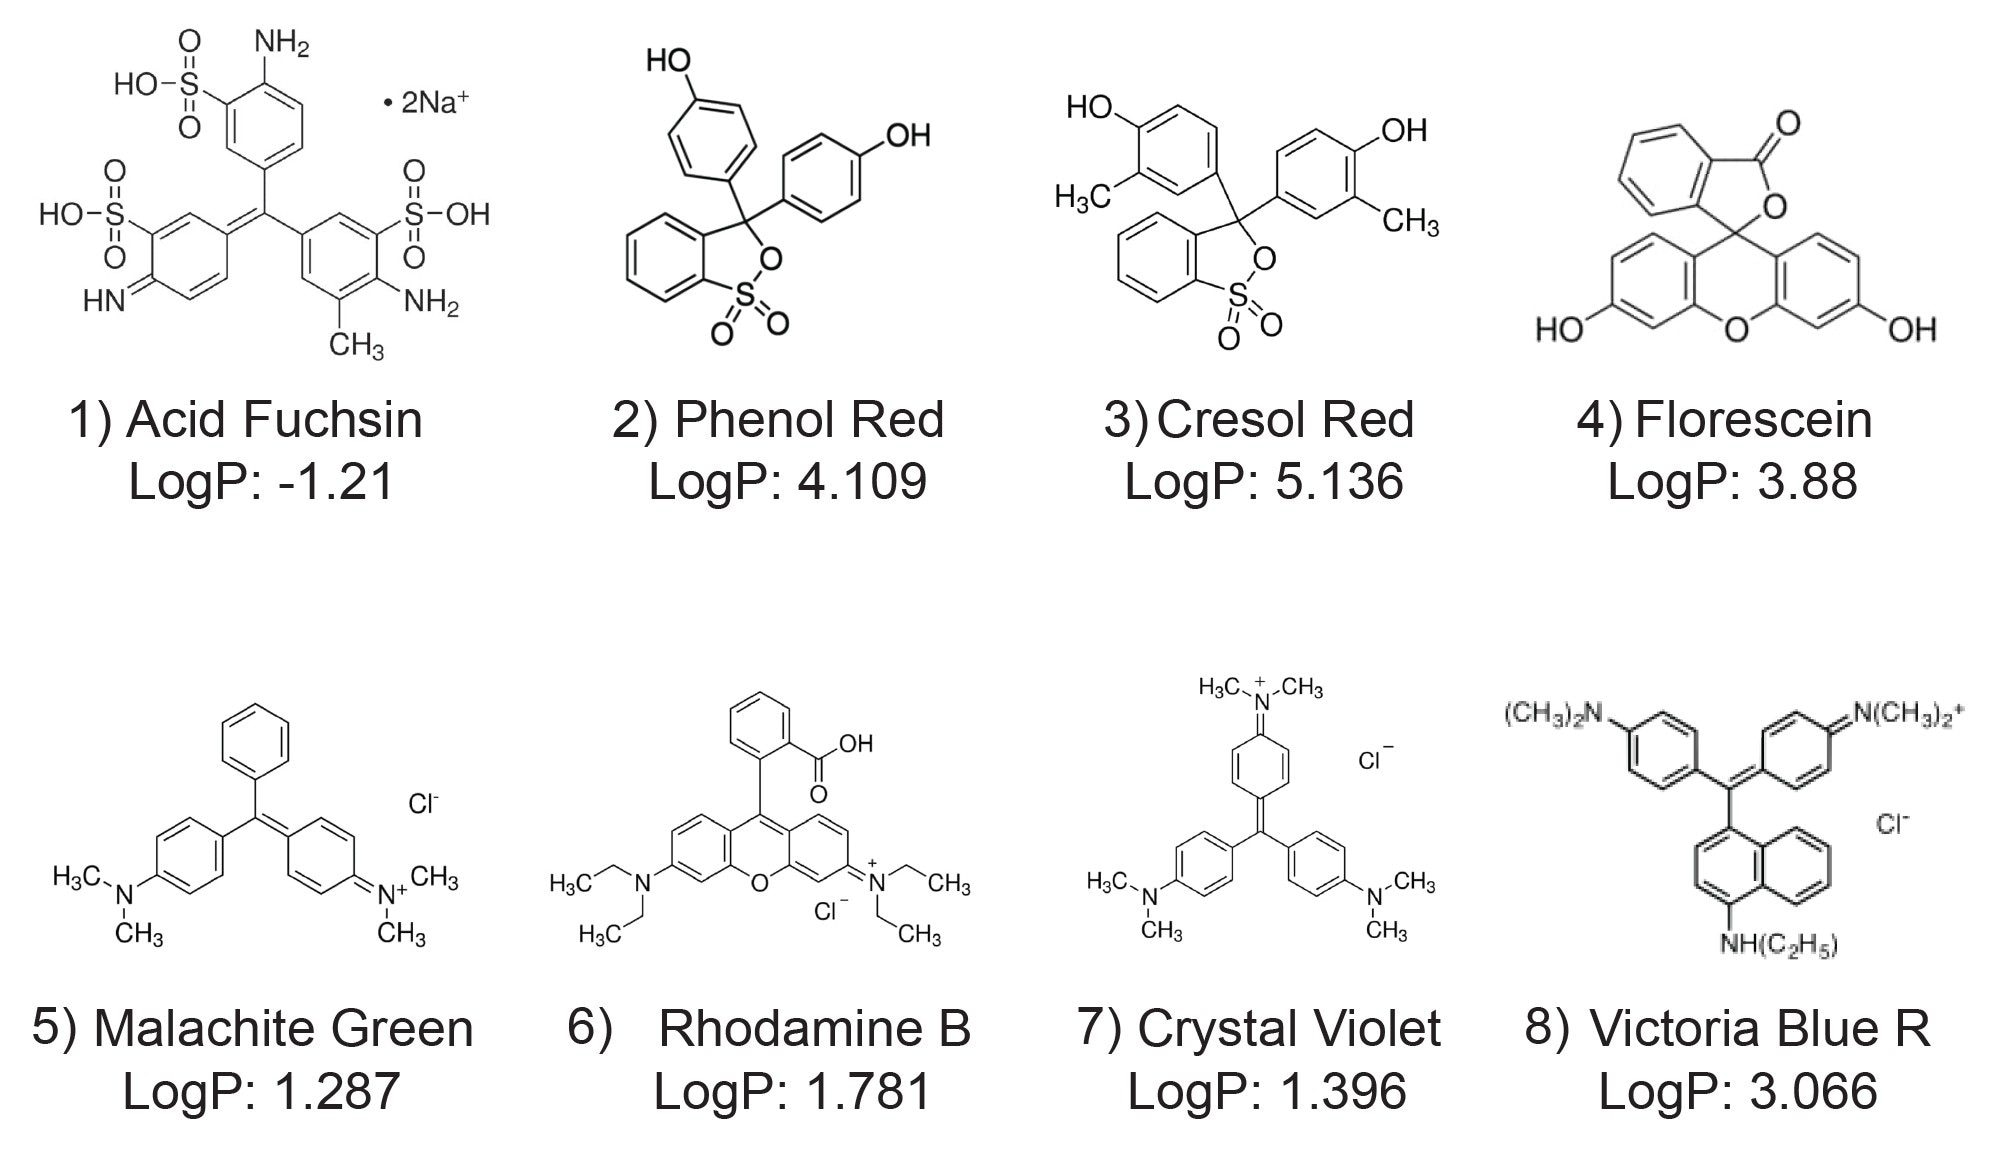 Figure 1. Chemical structures of synthetic dyes used in this application note.
Experimental
Sample Description
Stock solutions were created at 1 mg/mL and combined to have the final sample concentrations. Acid Fuchsin, Malachite Green, Fluorescein, and Phenol Red at 100 µg/mL each. Crystal Violet, Victoria Blue R, and Cresol Red at 50 µg/mL each. Rhodamine B at 10 µg/mL. Final sample diluent was 95:5 water:acetonitrile.
LC Conditions
|
LC system: |
Alliance HPLC System with TUV Detector |
|
Detection: |
UV @ 260 nm |
|
Columns: |
XBridge Premier BEH™ C18 Column 3.5 µm, 4.6 x 100 mm (p/n: 186010660) XBridge Premier BEH Phenyl Column 3.5 µm, 4.6 x 100 mm (p/n: 186010676) XBridge Premier CSH C18 Column 3.5 µm, 4.6 x 100 mm (p/n: 186010643) |
|
Column temperature: |
30 °C |
|
Sample temperature: |
10 °C |
|
Injection volume: |
10 µL |
|
Flow rate: |
2.0 mL/min |
|
Mobile phase A: |
Water |
|
Mobile phase B: |
Acetonitrile |
|
Mobile phase C: |
Methanol |
|
Mobile phase D: |
2% Formic Acid in Water OR 200 mM Ammonium Hydroxide in Water |
|
Gradient conditions: |
5% constant D to maintain additive concentration. Linear ramp of 5–95% B/C in 16.43 minutes. Hold at 95% organic for 2.7 minutes, return to 5% organic in 0.02 minutes. Re-equilibrate column for 5.51 minutes. Total run time: 25 minutes |
Data Management
|
Chromatography software: |
Empower™ 3 Feature Release 5 |
Results and Discussion
Prior to sample analysis, method development goals need to be determined. For this mixture of compounds, achieving baseline separation with good peak shape is required. Since the system being used does not have a mass spectrometer or photo-diode array, getting full separation of compounds is critical so that peaks can be identified by standard injection. For this work, individual standards were used during development, and a combined mixture was used during optimization. Figure 2 shows the systematic screening protocol in more detail.
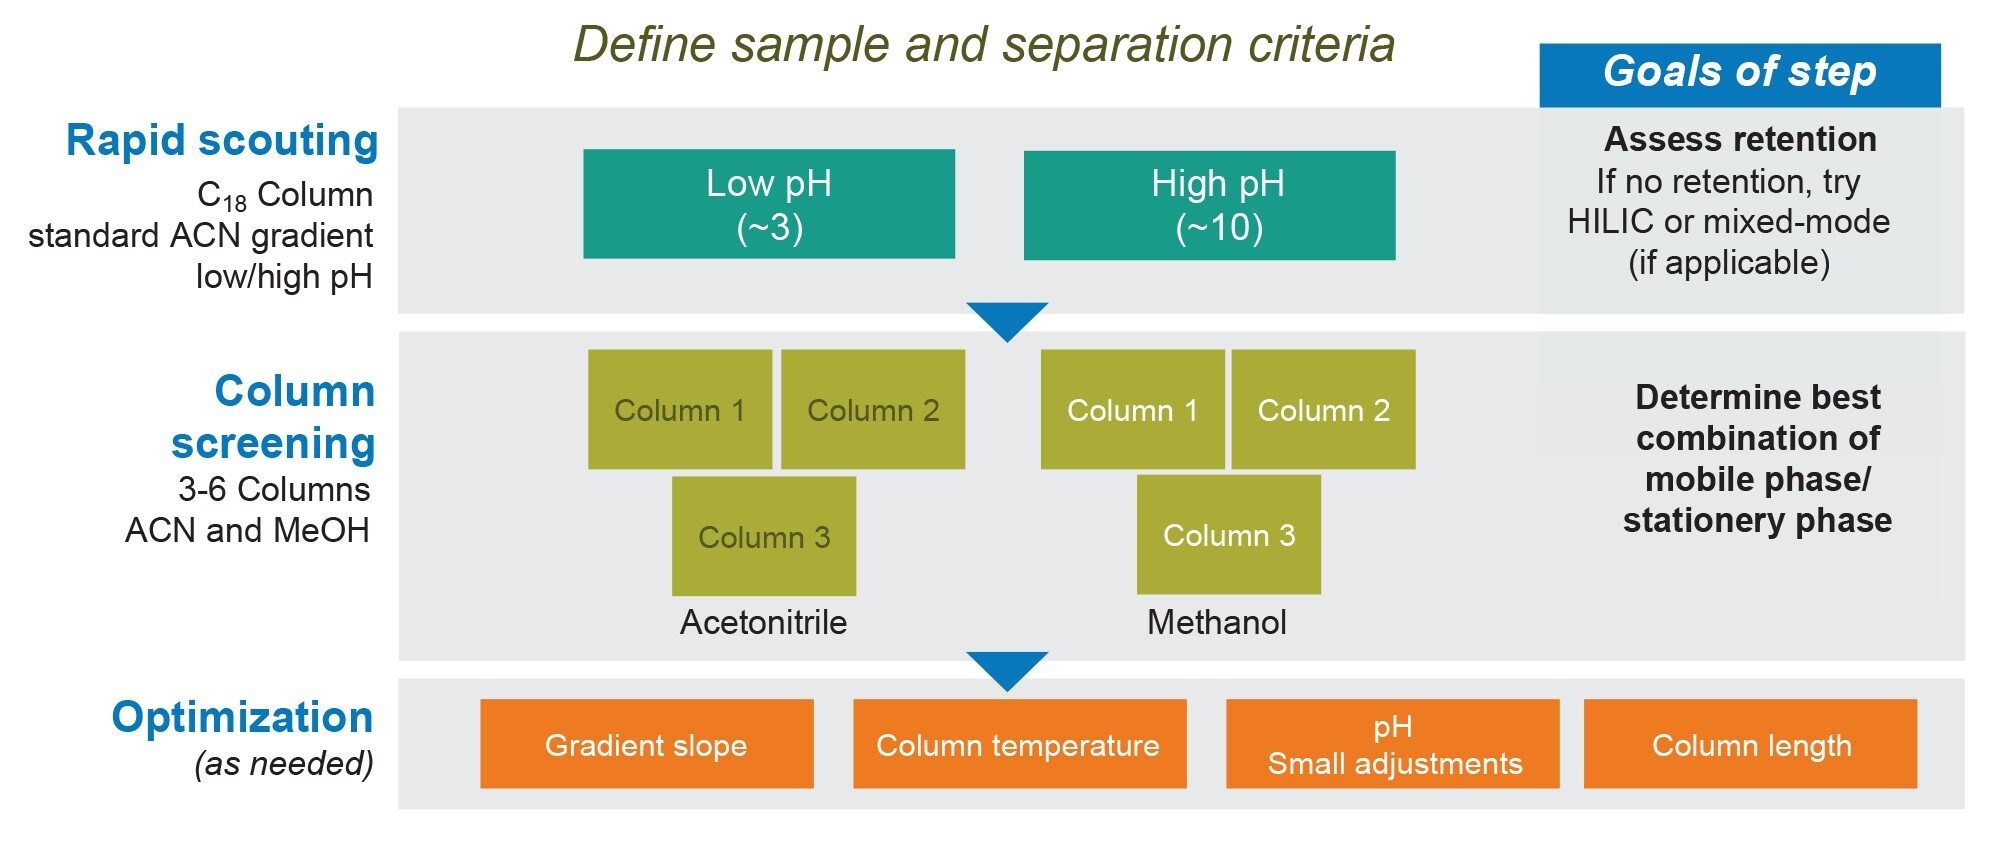 Figure 2. Systematic Screening Protocol outline.
Once method criteria are determined, a rapid scouting experiment is needed to assess the retention of the analytes at both high and low pH. To achieve this, a high pH stable stationary phase is needed. Pure silica stationary phases are not stable at high pH due to silica dissolution leading to column degradation. Additionally, to keep things simple the column should also have a C18 ligand, which retains compounds based solely on hydrophobicity as opposed to other secondary interactions. For this work, an XBridge Premier BEH C18 Column was selected. Not only is the BEH particle stable at high pH, but the use of MaxPeak HPS hardware mitigates any secondary interactions between analyte and metal surfaces in the column. Results of rapid scouting for these compounds is shown in Figure 3.
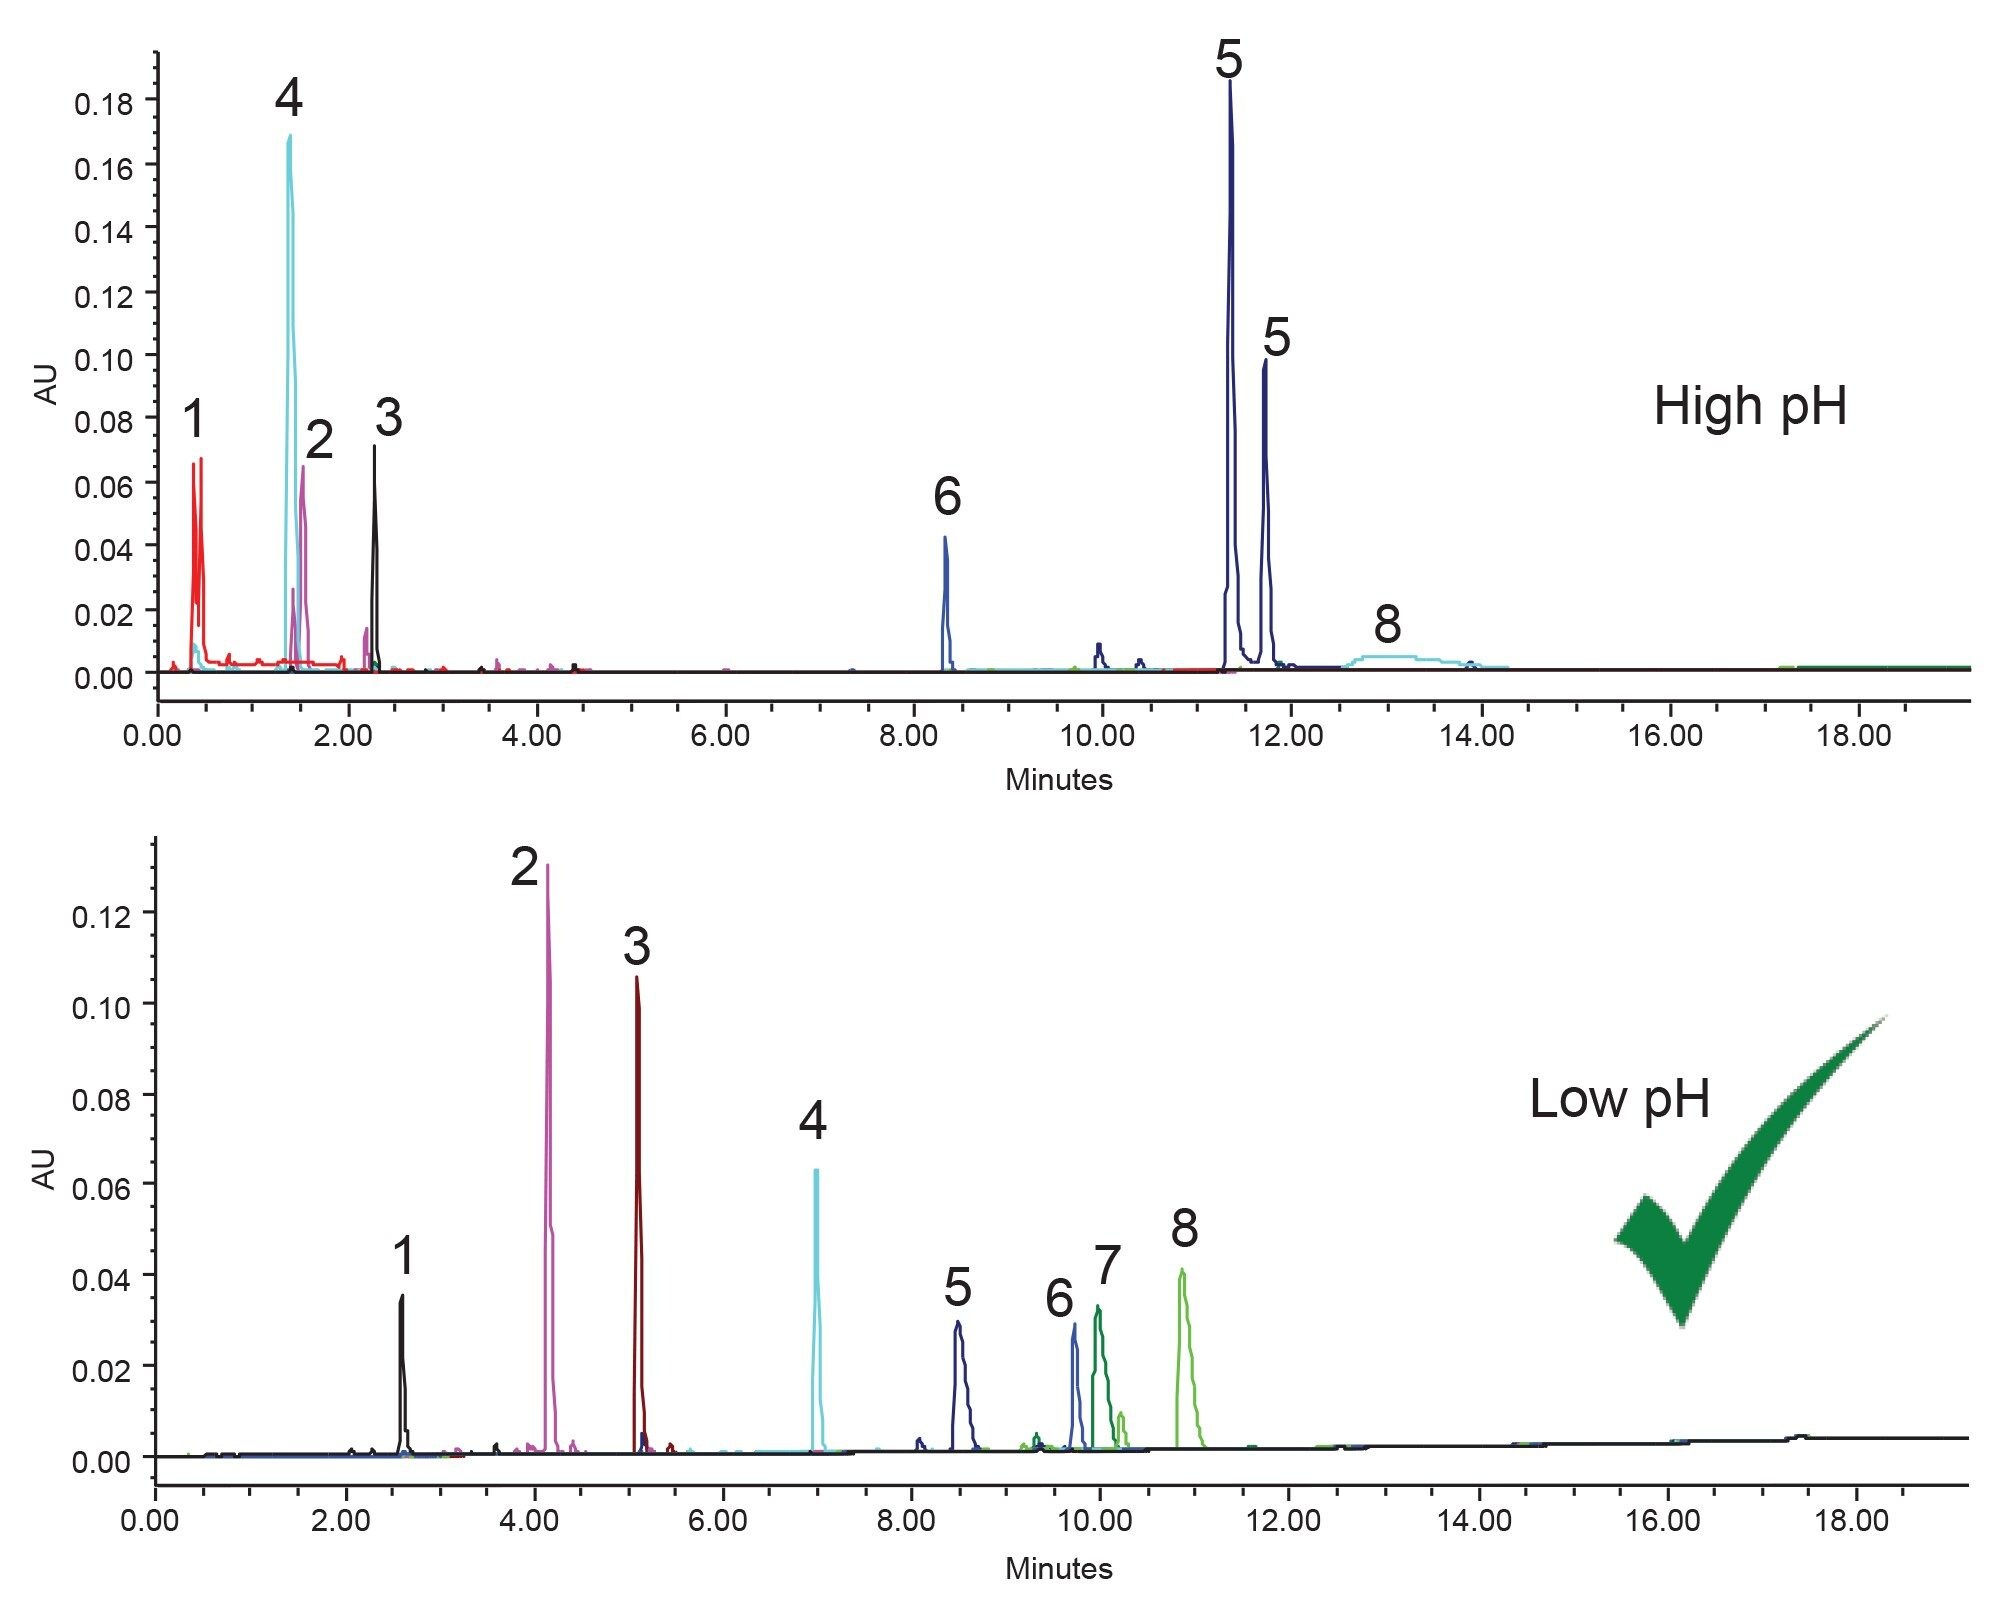 Figure 3. Overlay of single standard injections at low pH and high pH on the XBridge Premier BEH C18, 4.6 x 100 mm, 3.5 µm Column. 1) Acid Fuchsin, 2) Phenol Red, 3) Cresol Red, 4) Fluorescein, 5) Malachite Green, 6) Rhodamine B, 7) Crystal Violet, 8) Victoria Blue R.
Low pH testing using formic acid mobile phases provides the best overall retention for these analytes. At high pH acid fuchsin, peak 1, is unretained as all the acidic moieties of the compound are charged, making it extremely polar. Additionally, compounds like cresol red (3), phenol red (2), and fluorescein (4) are also less retained at high pH due to the increased polarity caused by acidic moiety charge. The sulfonic acid groups of acid fuchsin, cresol red, and phenol red along with the carboxylic acid group of fluorescein are fully charged at the high pH, while only partially charged or neutral at low pH. Alternatively, some compounds, like Victoria Blue R (8), and Crystal Violet (7) are more retained at high pH. In Figure 3, peak 8 is eluting outside the injection window for that standard and is eluting in the same run as the next sample in the sequence. This explains the very wide and small peak for the compound, as it is carried over between injections leading to a large amount of band broadening. Crystal violet (7) elutes outside the injection window for that standard but is not detected in subsequent injections. It is likely that the compound either elutes between injections when no UV data is collected, or that band broadening has completely flattened out the peak making it impossible to detect. Lastly, high pH creates a peak splitting effect for malachite green that can not be fully explained. Offline MS analysis indicates that the compound is being hydrated but further analysis was not performed as it is out of scope.
Given the issues seen at high pH, low pH was selected for further testing. As seen in Figure 3, low pH provides good separation, albeit with some poor peak shape for the basic analytes. This overloading peak shape is a secondary interaction between the amine functional groups of those compounds and the BEH base particle. Charged basic moieties can interact with free silanols on the base particle leading to peak tailing.7–9
Moving onto the next step of the protocol, two additional columns were selected to analyze these compounds at low pH. An XBridge Premier BEH Phenyl Column was selected next as the bonded ligand may provide some unique selectivity for these compounds. Given the multiple phenyl rings in each analyte, the Phenyl stationary phase can retain via not only hydrophobicity, but through π-π interactions, especially when methanol mobile phases are used. The last column selected was the XSelect™ Premier CSH C18 Column, which has the same bonded ligand as used previously but a different base particle. The CSH particle contains a slight positive charge, which should prevent any secondary interactions between the basic probes and the particle, improving peak shape. Additionally, because the particle is charged, it has some ion exchange functionality, which could help better retain the acidic probes. Figure 4 shows the separation of the analytes on the three columns selected with methanol.
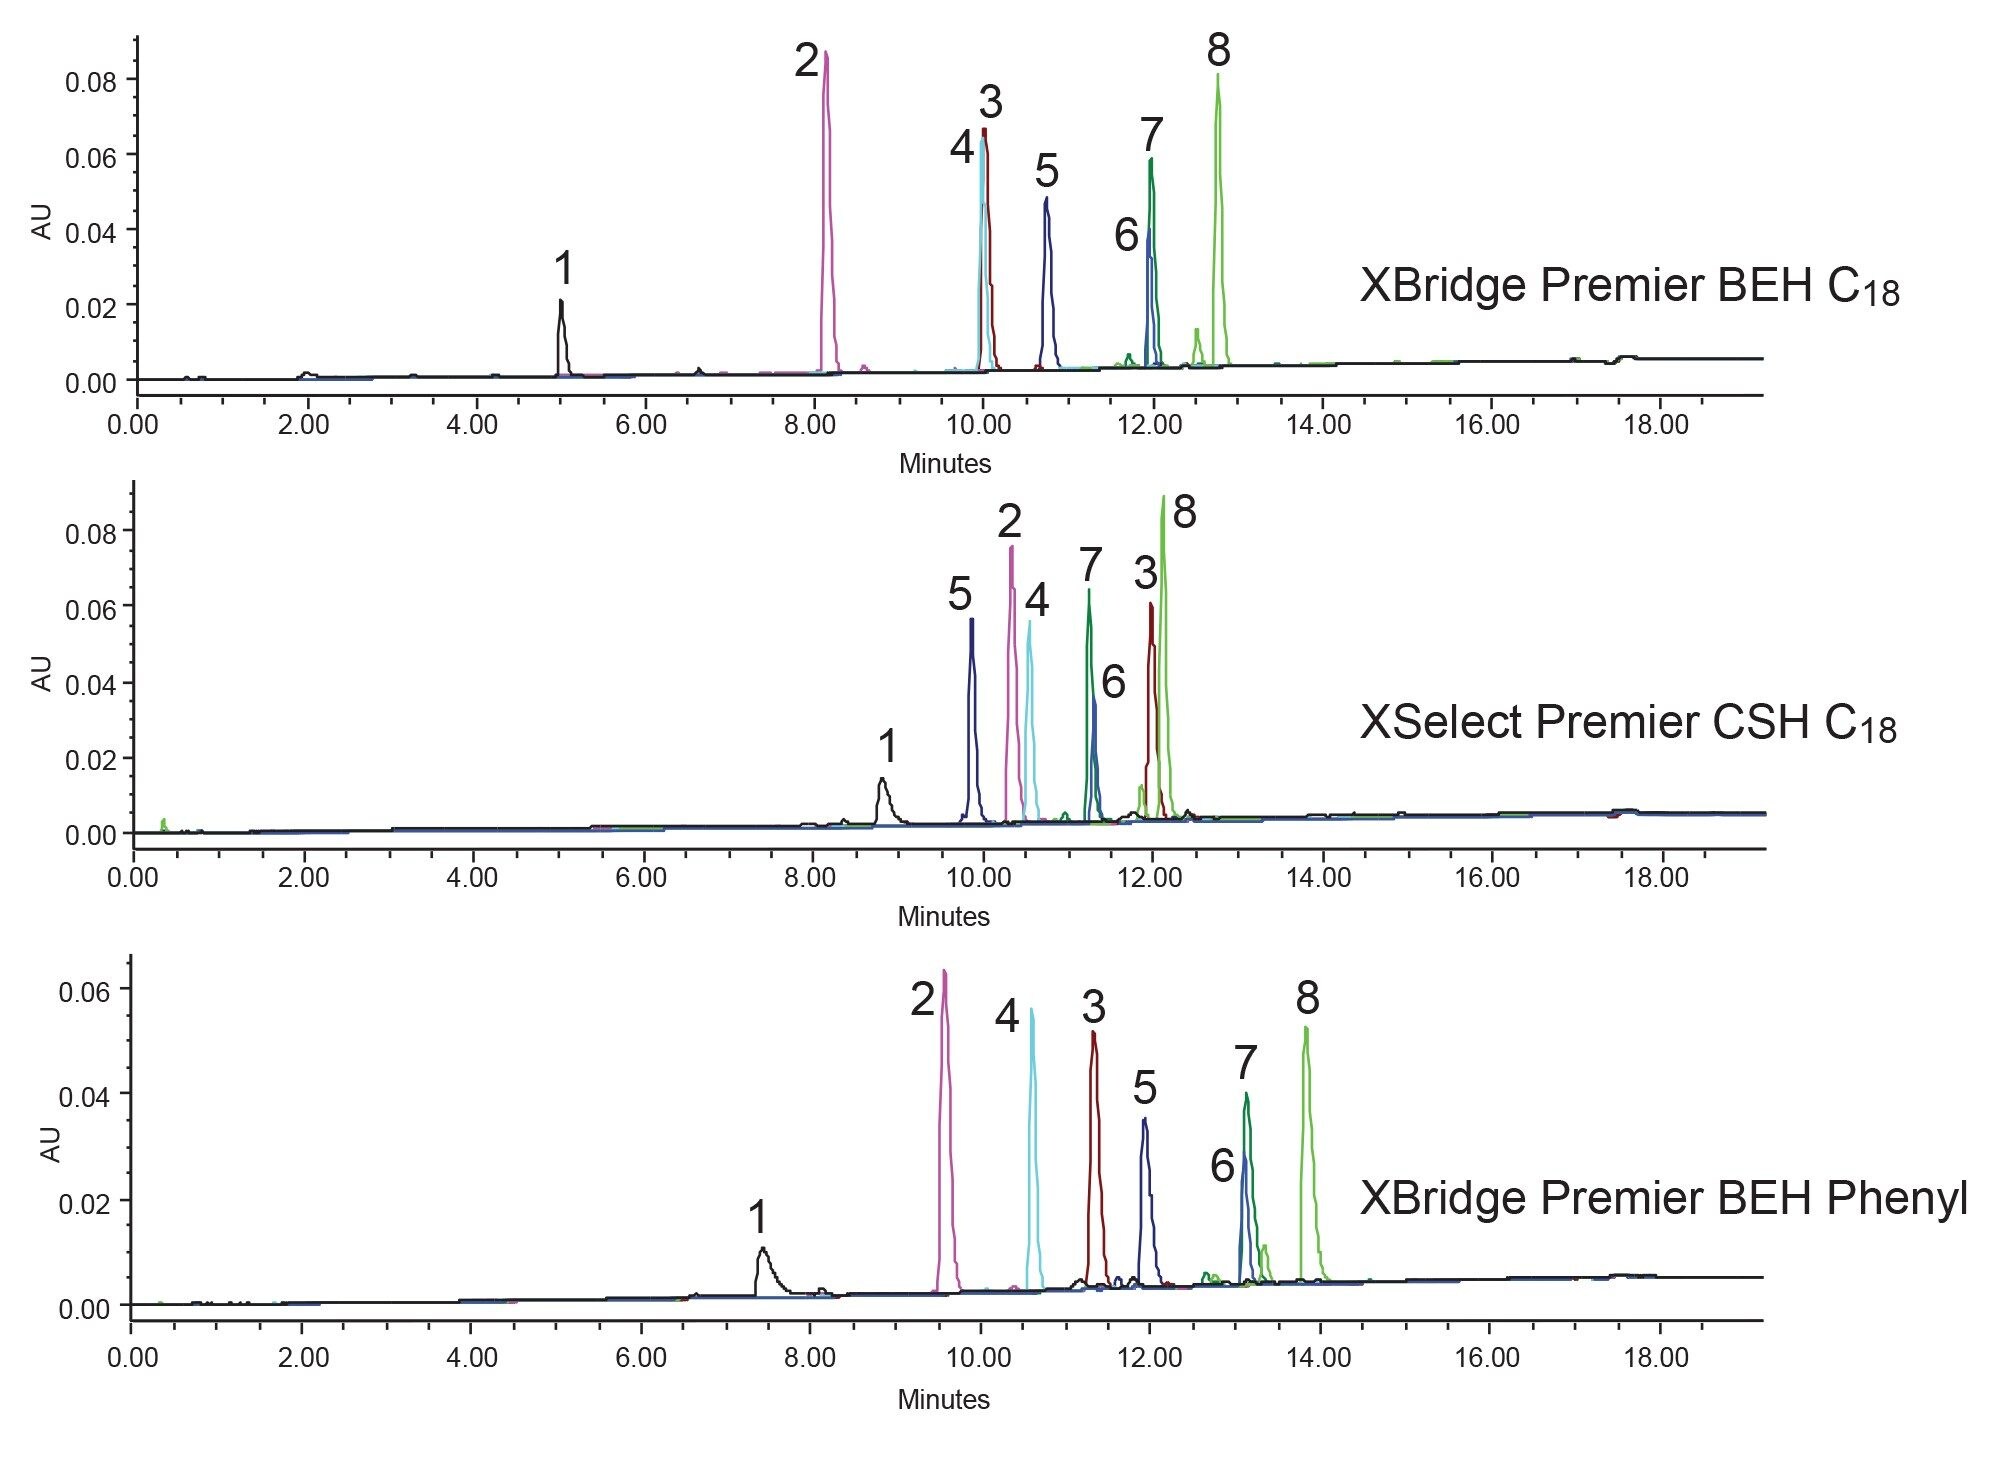 Figure 4. Overlay of single standard injections at low pH with methanol mobile phases. 1) Acid Fuchsin, 2) Phenol Red, 3) Cresol Red, 4) Fluorescein, 5) Malachite Green, 6) Rhodamine B, 7) Crystal Violet, 8) Victoria Blue R.
Selectivity differences between the three phases can be determined for these compounds. First, the use of the XSelect Premier CSH C18 Column improved the peak shape for the basic probes (5–8) while also leading to slightly less retention for those probes. Alternatively, the acidic probes (1–4) are more retained on the CSH C18 column compared to the BEH C18 column. Unfortunately for this mixture of compounds these differences are not helpful as the compounds are co-eluting due to the increased retention of the acidic probes and decreased retention of the basic probes. The XBridge Premier BEH Phenyl Column also shows some unique selectivity compared to the BEH C18, with all probes being better retained. Additionally, the Cresol Red (3) and Fluorescein (4) peaks are separated on the Phenyl column compared to the BEH C18. Unfortunately, no column provides a good separation when methanol mobile phases are used. Figure 5 shows the separation of the samples using the same three columns but with acetonitrile mobile phases.
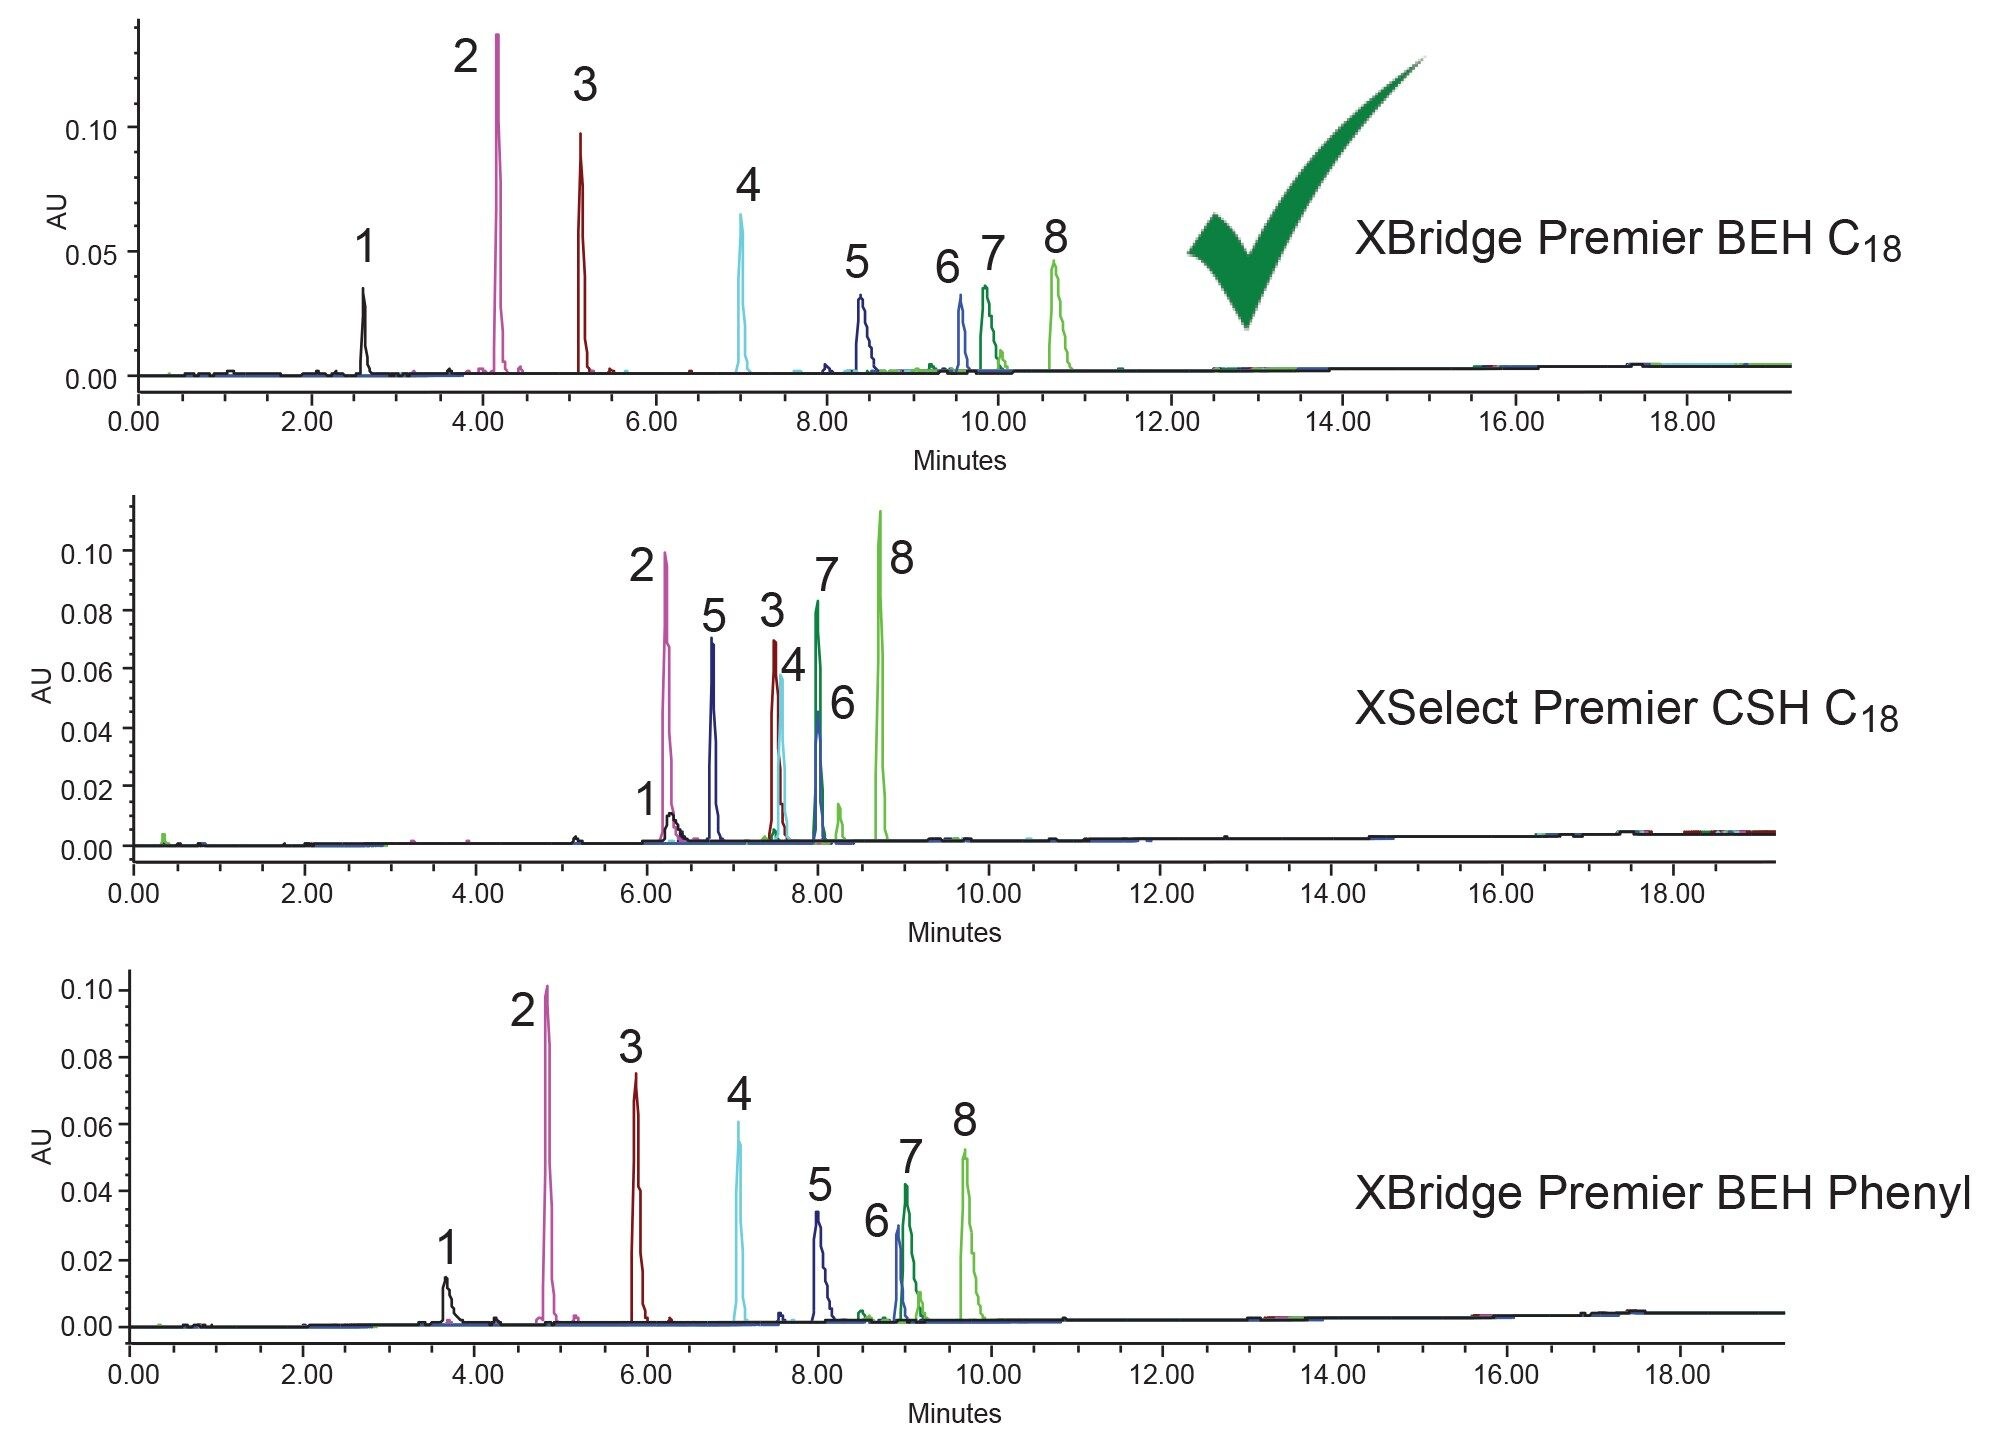 Figure 5. Overlay of single standard injections at low pH with acetonitrile mobile phases. 1) Acid Fuchsin, 2) Phenol Red, 3) Cresol Red, 4) Fluorescein, 5) Malachite Green, 6) Rhodamine B, 7) Crystal Violet, 8) Victoria Blue R.
Acetonitrile mobile phases show a similar story to methanol. The CSH C18 column still shows the ionic interactions affecting both retention and peak shape. However, as shown previously, this causes a fair amount of co-elution of the probes. The Phenyl stationary phase shows less unique selectivity compared to BEH C18 when acetonitrile mobile phases are used. Since the unique retention mechanism of the Phenyl phase is governed by π-π interactions, the use of acetonitrile prevents those interactions. Acetonitrile contains a considerable amount of π electrons, which “mask” the analytes from the stationary phase, thereby preventing that secondary retention mechanism. Without those secondary interactions the Phenyl ligand provides slightly less retention for the more hydrophobic probes like Victoria Blue R (8). The acidic probes (1–4) are slightly more retained on the Phenyl phase compared to the C18, likely due to the differences in hydrophobicity of the ligand and the polarity of the probes.
The only combination of column and mobile phase which provides a reasonable separation is the use of the BEH C18 column with acetonitrile. This combination was selected for optimization, with the goal being to improve the peak shape of the basic probes, while maintaining the separation performance. One way to improve the peak shape for these probes is to use a buffered mobile phase while staying at low pH. In this case, two different concentrations of ammonium formate, pH 3.0, were tested. This was achieved by adjusting the gradient profile to go from 5–90% B and using the mobile phase D line to control the buffer concentration. Figure 6 shows the method optimization results of using 0.1% formic acid from earlier as well as two different concentrations of ammonium formate pH 3 buffer.
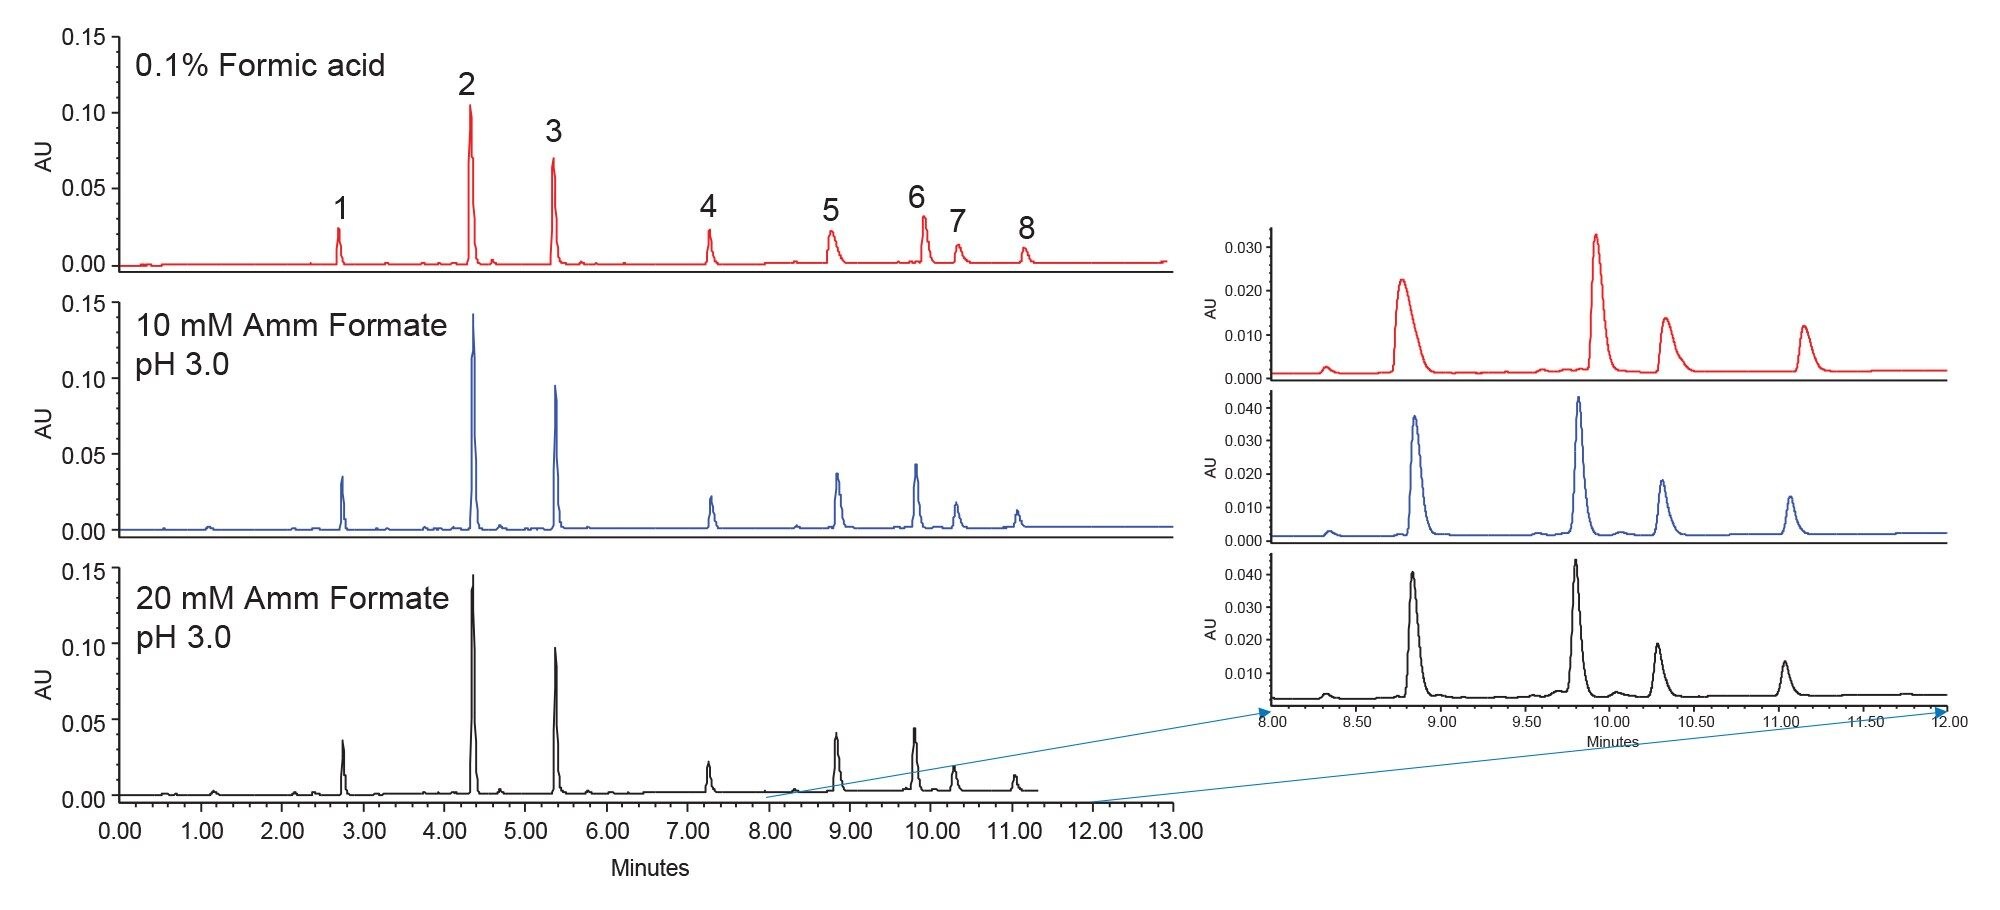 Figure 6. Sample mixture separated on an XBridge Premier BEH C18 Column using acetonitrile mobile phase and different mobile phase additives. Gradient profile of 5–90% B over the indicated time in the experimental section. 1) Acid Fuchsin, 2) Phenol Red, 3) Cresol Red, 4) Fluorescein, 5) Malachite Green, 6) Rhodamine B, 7) Crystal Violet, 8) Victoria Blue R.
The results using 0.1% formic acid continue to show the secondary interaction between the basic probes and the BEH particle. These effects are seen as peak tailing and slight overload characteristics. However, when buffered mobile phases are used these effects are mitigated. 10 mM Ammonium Formate pH 3.0 additive is sufficient to significantly reduce peak shape issues for these probes while having little to no effect on retention and selectivity. With the improvement of the peak shape, the criteria for this method have been met and the development can be stopped. This method can now be used to analyze samples or be moved onto validation activities. Using the systematic screening protocol and MaxPeak Premier Columns, a method was developed for eight structurally similar synthetic dyes. These compounds have a variety of chemical properties, but the same backbone structure making them particularly challenging to separate.
Conclusion
MaxPeak Premier Columns were used to separate eight structurally similar synthetic dyes. These columns, now available in HPLC format, mitigate secondary interactions between an analyte and metal surfaces in the column hardware. This provides a great starting point for method development, as the data collected will be accurate and reproducible from the first injection. Using these columns enabled the development of a new method without any issue. This method can now be further validated or used for sample analysis.
References
- Hong P, McConville P. A Complete Solution to Perform a Systematic Screening Protocol for LC Method Development. Waters White Paper. 720005268.
- Maziarz M, Rainville P. Efficient Method Development for the Analysis of Naphazoline Hydrochloride, Pheniramine Maleate, and Associated Related Substances using a Systematic Screening Protocol. Waters Application note. 720007850. January 2023.
- Method Development of Ten Antibiotic Compounds Using a Systematic Screening Protocol on an ACQUITY Arc with UV and QDa Detection. Waters Application Note. 720007352. August 2021.
- Delano M, Walter TH, Lauber M, Gilar M, Jung MC, Nguyen JM, Boissel C, Patel A, Bates-Harrison A, Wyndham K. Using Hybrid Organic-Inorganic Surface Technology to Mitigate Analyte Interactions with Metal Surfaces in UHPLC. Anal. Chem. 93 (2021) 5773–5781.
- Walter TH, Alden BA, Belanger J, Berthelette K, Boissel C, DeLano M, Kizekai L, Nguyen JM, Shiner S. Modifying the Metal Surfaces in HPLC Systems and Columns to Prevent Analyte Adsorption and Other Deleterious Effects. LCGC Supplements (2022) 28–34.
- Zabala G, Berthelette K, Gu W, Haynes K. Improved Reproducibility for Acetaminophen Assay USP Monograph Using MaxPeak Premier Columns after Modernization to 2.5 µm Particles. Waters Application Note. 720007938. July 2023.
- Fountain KJ, Hewitson H, Iraneta P, Morrison D. Practical Applications of Charged Surface Hybrid (CSH) Technology. Waters Application note. 720003720. September 2010.
- Summers M, Fountain K. Improved Analysis of Goldenseal Root Extract Using Charged Surface Hybrid (CSH) Column Technology. Waters Application Note. 720004098. September 2011.
- Alden BA, Isaac G, Chen W, Lauber MA. Lipid Nanoparticle Compositional Analysis Using Charged Surface Hybrid Phenyl-Hexyl Separation with Evaporative Light Scattering Detection. Waters Application Note. 720007331. August 2021.
720008098, October 2023